Gender, Skill, and Performance in Amateur Golf: An Examination of NCAA Division I Golfers

Abstract

In a previous study, it was found that male amateur golfers must possess a variety of shot-making skills to be successful and that relative to driving ability, putting skills and reaching greens in regulation contribute more to explaining tournament success. This present research extends these findings by expanding the investigation to analyze the performance determinants of both female and male amateur golfers. In so doing, we are able to test for the presence of gender-based differences in skill levels and in the relationship between skills and tournament performance. Using a sample of NCAA Division I male and female golfers who participated in tournament play during 2004-2005, our research offers two interesting observations. First, on average, male and female amateur golfers possess different levels of shot-making skills. Second, these disparate skills influence tournament performance differently across genders. Although the causality of these gender-based disparities cannot be identified with certainty, several plausible explanations are considered.

Introduction

In an earlier research study of amateur golfers, we empirically examine the relationship between a male golfer’s tournament performance and a set of shot-making skills (Callan and Thomas, 2004). This initial investigation was the first of its kind to focus on a sample of NCAA Division I male golfers. Statistically, those findings validate analogous research on the performance of professional golfers. What we discovered is that male amateur golfers, like their professional counterparts, must possess a wide variety of shot-making skills to be successful. Moreover, we found that, relative to driving ability, putting skills and reaching greens in regulation contribute more to explaining the variability in a player’s success. This present study extends that research to study both men and women amateur golfers and, in so doing, allows us to test for the presence of gender-based differences in skill levels or in any skill-to-performance relationship.

That gender-specific skill differences exist in the game of golf is explicitly recognized by the United States Golf Association (USGA), which is the governing body for the rules of golf. For example, in its rating system of golf courses, the USGA specifically defines a bogey golfer and a scratch golfer according to the golfer’s gender, as noted below (United States Golf Association, 2005).

Bogey Golfer:

“A male bogey golfer is a player who has a Course Handicap© of approximately 20 on a course of standard difficulty. He can hit tee shots an average of 200 yards and can reach a 370-yard hole in two shots at sea level.

A female bogey golfer is a player who has a Course Handicap© of approximately 24 on a course of standard difficulty. She can hit tee shots an average of 150 yards and can reach a 280-yard hole in two shots at sea level.”

Scratch Golfer:
“A male scratch golfer is a player who can play to a Course Handicap© of zero on any and all rated golf courses. A male scratch golfer, for rating purposes, can hit tee shots an average of 250 yards and can reach a 470-yard hole in two shots at sea level.

A female scratch golfer is a player who can play to a Course Handicap© of zero on any and all rated golf courses. A female scratch golfer, for rating purposes, can hit tee shots an average of 210 yards and can reach a 400-yard hole in two shots at sea level.”

Following these and other gender-specific distinctions made by the USGA, it is reasonable to expect that on average, male golfers are able to drive the ball longer distances off the tee, and female golfers have shorter approach shots to each green. Similar assertions, some with supporting data, are found in the literature, for example, Shmanske (2000) and Wiseman, Chatterjee, Wiseman, and Chatterjee (1994). Such observations motivate the need to learn how such gender-based skill differences translate into scoring performances under actual tournament conditions.

While no existing research papers examine this skill-to-performance relationship across male and female amateur golfers, there are studies that investigate the existence and degree of gender differences among professional golfers. Generally in such investigations, two questions are examined:

  1. Do the data support the hypothesis that there are statistically different shot-making skills across male and female golfers?
  2. How do shot-making skills influence a golfer’s tournament performance, and is this set of relationships gender specific?

To illustrate, we offer a few salient examples of this research and an overview of the approach used in each case.

Using performance measures for the 1992 season, Wiseman, Chatterjee, Wiseman, and Chatterjee (1994) investigate the influence of gender differences across golfers in the Professional Golfers’ Association (PGA), Senior PGA (SPGA), and Ladies PGA (LPGA). Overall performance is measured in their study by the average score per round of golf, and the shot-making skills considered are driving distance, driving accuracy, hitting greens in regulation, and putting. What these researchers find is that, on average, male PGA golfers drive the ball farther and hit a larger percentage of greens in regulation than female professionals. Driving accuracy was approximately the same across genders. Because the PGA and LPGA do not collect putting data in the same manner, no gender comparisons could be made about putting ability. However, using multiple regression analysis, Wiseman, et al. (1994) discover that the two most influential skills for female golfers are putting and hitting greens in regulations. These two skills explained 88 percent of the variability in an LPGA member’s average score per round. However, male PGA golfers need a more well-rounded game, as indicated by the importance of all shot-making skills in determining their tournament performance.

In a more recent study, Moy and Liaw (1998) examine golfers’ shot-making skills and tournament performance during the 1993 tournament season for the same professional tours used by Wiseman, et al. (1994). For the most part, Moy and Liaw’s findings agree with those of Wiseman, et al. (1994) regarding PGA golfers’ skills at driving the ball and reaching greens in regulation relative to LPGA golfers. However, they add a variable that captures sand saves, measured as the percentage of time a player gets out of a greenside bunker and scores par or better on the hole. They find that, on average, PGA golfers achieve a higher proportion of sand saves relative to their female counterparts in the LPGA. Given that no comparable putting statistic was available across the two tours, Moy and Liaw were unable to test for gender differences with respect to putting skills.

Shmanske (2000) statistically compares the skill-to-performance relationship for a sample of PGA golfers and LPGA golfers for the 1998 tournament season. In addition to the conventional shot-making skills, Shmanske constructed a comparable putting skill measure for each set of tour professionals. Overall, his results on gender differences are consistent with those of previous researchers. Specifically, he finds that male professional golfers drive the ball farther off the tee, have a higher sand save percentage, and demonstrate a higher putting proficiency. For the other key shot-making skills, namely driving accuracy and hitting greens in regulation, Shmanske observes no meaningful difference across genders.

While these studies have contributed to our understanding of gender differences in professional golf, no analogous investigations have been done for amateur golf. Recognizing the importance of this issue, we extend our previous study of amateur golfers (Callan and Thomas, 2004) to an analysis of skills and performance across male and female amateurs. Using the fundamental framework suggested by Wiseman, et al. (1994) and others, we use a two-pronged approach to our investigation. First, we statistically test for gender-specific skill differences at the amateur level. Second, we use regression analysis to assess the influence of a player’s shot-making skills on tournament performance and statistically determine if these skill-to-performance relationships are affected by gender.

Method

Sample

To conduct our investigation, we use a subset of NCAA Division I male and female golfers who participated in at least one tournament during the 2004–2005 season. Data on members of all Division I teams are not available. The colleges and universities represented in this study are identified in Table 1 along with the number of players on each team, the number of tournaments played during the season, and the average length in yards of the typical course on which the teams played. Most of these data are obtained from Golfstat, Inc. (2005), which is accessible on the Internet at www.golfstat.com.

Notice that the data presented in Table 1 suggest some important distinctions across genders. At a fundamental level, we observe that male golf teams, on average, comprise between 8 and 9 players, while female teams are smaller, averaging between 7 and 8 players. We also note that males play in slightly more tournaments than females, averaging 10.8 for males and 9.7 for females. Consistent with the USGA’s rating system, we also observe that the average male golfer plays courses that are almost 1,000 yards longer than those played by females, specifically 7,042 yards for men versus 6,104 for women. As a consequence, one might infer that male golfers place a higher premium on driving distance, while female golfers might focus more on developing their short game skills.

Measures

For each of the universities included in this research, Golfstat, Inc. collects and reports statistics for player skills and tournament performance. In this study, we use data for the 2004–2005 NCAA Division I tournament season for men and women teams from the same group of institutions. Just as we argue in our 2004 study, AVERAGE SCORE per round is a viable measure of tournament performance, since earnings are not relevant at the amateur level. Moreover, Wiseman et al. (1994) assert that correlation results are actually stronger when scoring average, as opposed to earnings, is used. As for the shot-making skills, we use a set of variables that collectively capture each player’s golf game from tee to green. Among these are measures of driving ability, fairways hit, greens in regulation, sand saves, and putting, which follows the approach used in Callan and Thomas (2004). We briefly discuss each measure in turn, starting with those capturing a player’s long game.

To capture each amateur’s ability to drive the golf ball, we use the variable EAGLES, defined as the cumulative number of recorded eagles (i.e., two strokes under par on any hole) a player makes each season. This variable serves as a proxy for driving distance, which is a statistic not reported by Golfstat. In support of this proxy measure, Dorsel and Rotunda (2001) report a positive correlation between a player’s driving distance and the number of eagles made. Related to driving distance is accuracy in driving the ball into the fairway. To measure this skill, we use the variable FAIRWAYS HIT, measured as the percentage of time a player drives the golf ball off the tee and into the fairway. We also define a variable called GREENS IN REGULATION (GIR) as the percentage of time a player reaches a green in the requisite number of strokes, specifically one for a par three, two for a par four, and three for a par five. This follows the work of Belkin, Gansneder, Pickens, Rotella, and Striegel (1994), who assert that GIR captures a player’s iron skill and success in reaching a green within the regulation number of strokes.

As for a player’s short game, we employ two skill variables that are commonly used in the literature. The first is SAND SAVES, which measures the percentage of time a player gets out of a greenside bunker and achieves a score of par or better. The second is a player’s ability to putt the ball into the hole once on the green. To capture this shot-making skill, we use the variable PUTTS PER ROUND, which measures the average number of putts a golfer makes per round of golf. This follows Belkin, et al. (1994).

Beyond the effect of shot-making skills, we hypothesize that a golfer’s overall performance is influenced by two other key factors – a player’s experience level and any associated team effects. Recognizing experience as a determinant of a golfer’s performance follows Shmanske (1992) and others. In the professional literature, experience is typically captured by the number of years a player has been a professional player. For this analysis of amateur golfers, we construct two experience variables. One is the variable ROUNDS, which is simply the number of tournament rounds completed by each player during the 2004–2005 season. This variable effectively measures a player’s short-term experience, because it captures the way each additional round played in a season adds to the knowledge a player can call upon in subsequent rounds. The second experience measure controls for longer-term cumulative experience and is modeled through a set of dummy variables that reflect the player’s academic age, specifically FRESHMAN, SOPHOMORE, JUNIOR, or SENIOR. The underlying expectation is that the more advanced is a player’s academic age, the more collegiate golfing experience has been gained and, therefore, the lower the expected average score.

The other theorized non-skill determinant of amateur performance is characterized as team effects. These are expected to arise from various factors, including the expertise and experience of the coach and the relative challenge of the courses played by the team. Coaches can directly affect the success of each player in myriad ways, such as through mentoring, leadership, instruction, and guidance. As a leader, the coach is responsible for setting team strategy and for determining the extent of each player’s tournament participation. As an instructor, the coach guides and motivates the development of each player’s athleticism and skills. Hence, collegiate golfers can achieve varying levels of success in the sport based in part on the expertise and experience of their coach, holding skill levels constant.

Likewise, a player’s amateur performance might be affected by the courses played by their team, because course venues, and hence their relative difficulty, vary across collegiate teams. Therefore, a member of a team that plays on relatively easy courses in a tournament season might enjoy a lower average score for that season, and, of course, the converse is true. To account for such team effects, we construct university-specific dummy variables for each player, whereby each identifies the team to which a player belongs.

Procedures

For this study, two conventional statistical procedures were used to analyze the skill and non-skill determinants of amateur golf performance, controlling for gender. One is the two-sample t-test, which was used to statistically examine the difference between mean values of male and female shot-making skills. The second procedure is the use of a multiple regression model that estimates the influence of skill, experience, and team effects on a player’s tournament score, holding constant all other score determinants. Ordinary least squares (OLS) is used to derive the regression estimates.

Results and Discussion

In Table 2, we present descriptive statistics for the sample of 179 amateur golfers, comprising 94 males and 85 females. At the collegiate level, tournaments generally consist of 3 rounds of golf, and each round comprises 18 holes of play. In our sample, the average NCAA Division I male golfer had an average score per round of approximately 75 strokes during the 2004–2005 season. In comparison, the average female golfer had a higher average score per round of about 79 for the season.

Based on the two experience variables, the average male amateur has more experience than the average female. For short-term experience, we observe that males play slightly more than 24 rounds of golf in the season, while females play fewer rounds, at about 22. As for longer-term experience based on academic age, approximately 61 percent of male team members are juniors and seniors, while the comparable value for females is lower at 47 percent.

Turning our attention to shot-making skills, we observe the following distinctions across genders. The average male golfer hits approximately 64 percent of fairways and reaches greens in the regulation number of strokes 60 percent of the time. Female golfers, on the other hand, hit 70 percent of fairways and reach greens in regulation 50 percent of the time. Over the course of a round, a male golfer makes slightly less than 31 putts, while the female golfer makes slightly more than 32 putts. For sand saves, the data show that the amateur male golfer makes par or better when hitting from a bunker 39 percent of the time, which is notably higher than the amateur female golfer, who has a comparable success rate of 29 percent. Lastly, over the course of the 2004–2005 season, the average male player makes 1.8 eagles, while the average female had 0.34 eagles, suggesting superior driving distance for males.

For each variable in the table, we also find the coefficient of variation for each gender group. As a measure of dispersion, this statistic contributes useful information about performance and skills across genders. Notice that for AVERAGE SCORE, the coefficient of variation is smaller for males than females. The same is true for all shot-making skill variables with the single exception of PUTTS PER ROUND. What these results imply is that there is a greater degree of competition among amateur male golfers than among females, an interpretation that follows Moy and Liaw (1998).

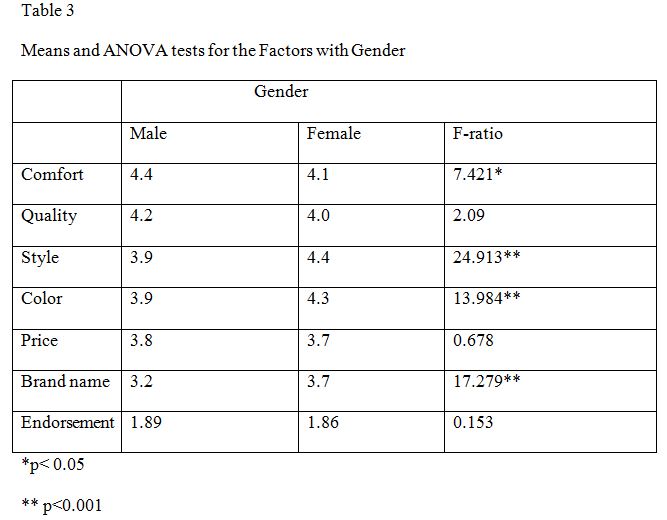
By simple observation, these data suggest that there may be statistically significant differences in skill levels across genders. To formally examine this theory, we use two-sample t-tests across the gender-specific skill variables and present our findings in Table 3. Not surprisingly, there are indeed statistically significant differences across genders (i.e., p < 0.0001) for all shot-making skills. Specifically, NCAA Division I male golfers, on average, possess superior shot-making skills relative to their female counterparts for EAGLES, GIR, PUTTS PER ROUND, and SAND SAVES. These findings generally agree with those found in research studies of professional golfers (Wiseman, et al., 1994; Moy and Liaw, 1998; Shmanske, 2000). The opposite relationship holds for FAIRWAYS HIT, the measure of driving accuracy, for which female collegiate golfers are statistically superior to males, on average.

While certainly of interest, the observation of gender-specific skill differences does not ensure that they translate into comparable changes in tournament performances. Investigation of this important issue requires the use of a multiple regression model. To that end, we specify a model to estimate the relationship between an amateur golfer’s average score and each of the determinants identified previously, specifically the set of five shot-making skills, the two experience measures, and the team dummy variables. To identify whether these determinants affect average score differently across males and females, we explicitly control for gender through the use of an interactive binary variable, FEMALE. This variable equals 1 if the golfer is female and 0 if male. It enters the model by itself as well as multiplicatively with each of the other explanatory variables. That way, each score determinant enters the model directly to represent males and multiplicatively with FEMALE to represent any incremental differences for females. In so doing, the estimation results quantify not only how shot-making skills, experience, and team effects influence average score but also whether those effects vary across genders.

The results of this multiple regression analysis are given in Table 4. Based on the adjusted R2 statistic, the regression model explains approximately 95 percent of the variability in a golfer’s tournament performance. Of particular interest are the gender-specific estimates that communicate the relative importance of each shot-making skill on overall performance, holding constant all other skills, team effects, and player experience. We also can assess the influence of all non-skill factors on a player’s average score independent of skill levels, and again, we can do so by gender. The estimated values for male golfers are listed in the first two columns of the table, and the estimates of any incremental differences for females are given in the second pair of columns.

To determine if the gender-based distinctions are collectively relevant, we conducted several F-tests, the results of which are shown at the bottom of Table 4. Other than the test for academic age variables for which gender differences are only marginally significant, all other F-tests indicate that gender differences exist and are statistically significant. These include tests for the overall model, for shot-making skills, and for team effects. These are important findings, which, to the best of our knowledge, have not yet been identified in the literature. They communicate far more than differences in skill levels across males and females. Rather, these results suggest that improvements in skill levels do not translate equivalently to better performance outcomes for both gender groups.

Next consider the individual results for each of the explanatory variables, starting with the set of shot-making skills. With the exception of FAIRWAYS HIT, each shot-making skill has a statistically significant influence on a player’s tournament performance, and each bears the expected algebraic sign. We also find that for several of these shot-making skills, gender differences exist and are statistically significant. Specifically, male golfers gain more tournament success than females from improving SAND SAVES. Conversely, increasing the GIR proportion statistically improves a female golfer’s tournament performance more than it does for a male. An analogous argument is relevant to reducing PUTTS PER ROUND. There are no apparent gender-based differences for EAGLES. Perhaps this outcome is due to the USGA establishing different tee boxes for males and females, which may correctly adjust for any inherent gender-based differences in driving ability.

As for the experience measures, the results suggest that short-term experience measured through ROUNDS does improve tournament performance and does so with no difference between the genders. For cumulative experience, captured through the academic age variables, FRESHMAN, SOPHOMORE, JUNIOR, and SENIOR, only the results for females are reasonable. Specifically, we find that female sophomores achieve higher average scores relative to seniors (the suppressed academic age variable). This makes sense, suggesting that greater collegiate experience improves performance. For males, the parameter on SOPHOMORE is significant, but its algebraic sign is negative. This outcome may be an artifact of the data sample, such as an unusually talented group of male sophomores in the 2004–2005 tournament season. It might also be related to the fact that in this sample, there are about 50 percent more male seniors than male sophomores, while for females there are 12.5 percent fewer seniors than sophomores.

We further find that team effects exist for certain universities. Golfers from East Tennessee State, on average, have higher average scores for the season than those from Vanderbilt University (the suppressed variable), regardless of gender. The same is true for players at the University of Texas. This implies that Vanderbilt University may have a better coaching staff and/or the Vanderbilt teams may play on less challenging courses. Interestingly, the team effect results also suggest a gender difference for teams at Indiana University and Kent State. In both cases, female teams perform at a lower level (i.e., have higher average scores), than their male counterparts, holding constant all other score determinants, including shot-making skills.

To quantify the effect of these differences, we follow Shmanske (2000) and compare the fitted value of average score for an arbitrarily defined male (e.g., a sophomore at Kent State University), with a predicted value that uses female parameter estimates with mean values of male score determinants. What we find is that the fitted value for average score is 73.88, but the predicted value is 75.38. This helps to underscore how the skill-to-performance relationship for females causes their scores to be higher than males, holding all else constant. Using the same approach for an analogously defined female (i.e., a sophomore at Kent State University) yields a fitted value for average score of 79.51, but a predicted value of 77.35, using mean values of female score determinants with male parameter estimates. Again, the difference indicates that the skill-to-performance relationship for males contributes to their scores being lower than that of females, holding skills, experience, and team effects constant.

That these collective results provide some evidence of gender-specific differences in how various factors affect performance is an interesting set of findings. That is, we now have a better sense of why amateur golf performance varies across gender groups. The commonly discussed observation of different average scores for males versus females seems not to be solely a function of differences in skill levels or years of experience but also a function of how changes in score determinants affect golfer performance.

How might we explain these differences? Although definitive answers are beyond the scope of this research, we offer three possible explanations based on selected analyses and theories that have been explored in the literature. These are based on: (1) differences in the degree of competition; (2) varying opportunities within and across university athletic programs; and (3) dissimilar physiological and psychological factors. We present a brief overview of each, which may encourage further investigation of these and other possible explanations.

First, based on the calculations of the coefficient of variation discussed previously and presented in Table 2, there seems to be a greater degree of competition among male amateurs. This is not unlike what Moy and Liaw (1998) find in their analysis comparing professional male and female golfers. More competition among males might encourage longer practice sessions and greater concentration, which in turn should yield higher skill levels and correspondingly greater improvements in performance as those skills develop. Somewhat related to this issue is that male amateurs might also be more highly motivated to practice and may compete more aggressively because of greater earnings potential at the professional level than females. This reality is based in part on higher purses offered on the PGA tour than on the LPGA tour. In fact, some studies of professional golf suggest that golfer success depends on effort, which in turn is influenced by the skewed distribution of tournament purses, meaning that performance improves when the stakes are higher (Ehrenberg and Bognanno, 1990; Shmanske, 2000).

Second, there may be disparate expertise in the coaching staffs and/or significant differences in course difficulty for male teams relative to female teams. This might be the case across institutions or it may arise within a university’s athletic department. The source of such differences is important, since the provision of unequal opportunities based on gender is a violation of Title IX of the Educational Amendment Act of 1972, in which Section 106.41 pertains specifically to athletic programs. Part C of that section identifies several factors that are to be considered when assessing the provision of equal opportunities to both sexes. These include the provision of equipment and supplies, the scheduling of games and practice time, the opportunity to receive coaching and academic tutoring, and the provision of practice and competitive facilities (U.S. Department of Education, 1972).

Third, it is often argued in both the common press and professional journals that gender differences in golf skills and performance might be attributable to physiological or psychological distinctions between males and females. The nature and validity of such arguments are being studied and intensely debated in the literature, and hence no definitive conclusion can be offered here. However, we can identify some of the more salient elements of these arguments, and suggest that they may help to explain the gender differences observed in our sample of amateur golfers.

Some researchers focus on psychological factors that may have differing effects on the play of male and female golfers. To illustrate, consider that Hassmen, Raglin, and Lundqvist (2004) identify a significant correlation between the variability of amateur male golfers’ somatic (or physiological) anxiety levels and the variability of their golf scores. However, Krane and Williams (1992) find no such relationship for their sample of amateur female golfers.

Others ascribe gender-based performance differences to physiological attributes. A common assertion in the professional golf literature is that men’s larger physical size and greater strength explains their ability to drive the ball further than females, and this may in turn explain the lower mean golf scores achieved by males. See, for example, Moy and Liaw (1998). However, others argue that such an assertion is incorrect, because driving a golf ball requires more skill than brute strength alone would provide (Shmanske, 2000). Indeed, in a sophisticated study of the biomechanics of golf, Hume, Keogh and Reid (2005), analyze the two main movements in golf – the swing and the putt, and show that golfers must possess strength, flexibility, and timing to achieve the distance and accuracy necessary for success. Hence, observed gender differences in shot-making skills might be linked to dissimilarities in any or all of these attributes. Some evidence of this hypothesis is offered by Myers, Gebhardt, Crump, and Fleishman (1993), who find within their tests of male and female physical abilities that males scored higher than females on tests of strength and stamina, while females scored higher on tests of flexibility. These findings might explain why male golfers generally drive the ball farther than women and why females typically achieve greater driving accuracy, results found in our analysis and others.

Conclusions

In our previous study of NCAA Division I male golfers, we identified the relationship between an amateur golfer’s tournament performance and various shot-making skills (Callan and Thomas, 2004). This present investigation advances this work by extending the analysis to both females and males. In so doing, we are able to examine whether the skill levels of amateur female golfers differ from those identified for males. Taking this one step further, we also are able to estimate the relationship between each shot-making skill and overall performance for males and females and specifically test for any statistically significant gender differences. To our knowledge, this is the first such study to examine gender differences in amateur golf.

Using a sample of NCAA Division I male and female golfers who participated in tournament play during 2004-2005, our empirical estimation and subsequent analysis supports two important conclusions. First, male and female amateur golfers, on average, possess dissimilar levels of various shot-making skills, and these differences indeed are statistically significant. Such dissimilarities are consistent with the literature examining gender distinctions among professional golfers. In this case, we find that on average, NCAA Division I male golfers possess superior shot-making skills relative to females for all shot-making skills except FAIRWAYS HIT, for which the opposite is true. Second, the manner in which shot-making skills influence tournament performance is not independent of gender. For example, male golfers achieve greater performance improvements by improving SAND SAVES, while females gain more from increasing the GIR proportion and from reducing PUTTS PER ROUND.

Both sets of results are of interest because they improve our understanding of the complexities of amateur golf tournament play. Moreover, through statistical testing, they validate anecdotal evidence of differing skill levels and performance outcomes across male and female collegiate teams. In so doing, the findings suggest the need for further research to learn more about these distinctions and, if necessary, to suggest changes in tournament play that recognize, and perhaps correct for, these disparities.

Although the root causes of gender-based differences in NCAA Division I golf cannot be identified, we do offer several plausible explanations based on research findings from the economics, sports medicine, and physiology literatures. First, we offer the possibility that the higher degree of competition among male golfers may incite more practice and more intensity of play, which in turn may translate into superior skills and/or tournament scores. Second, we suggest that skill and performance distinctions may be related to differences in facilities, coaching, and/or varying course venues. Further study is needed to identify these differences and to determine if there are associated implications for Title IX. Lastly, we consider the role of physiological and psychological factors in explaining gender-specific skill levels and performance in sports, an area that has been, and likely will continue to be, studied in earnest.

We believe that our study and its associated findings are of interest in their own right and contribute to the literature examining both professional and amateur golf. However, it is our hope that this work will have broader implications by encouraging new research in amateur golf and other sports aimed at learning more about the skill-to-performance relationship and the influence of gender and other factors on this important connection in amateur and professional sports.

REFERENCES

  1. Belkin, D.S., Gansneder, B., Pickens, M., Rotella, R.J., and Striegel, D. (1994) “Predictability and Stability of Professional Golf Association Tour Statistics.” Perceptual and Motor Skills, 78, 1275-1280.
  2. Callan, Scott J. and Thomas, Janet M. (2004) “Determinants of Success among Amateur Golfers: An Examination of NCAA Division I Male Golfers.” The Sport Journal, 7 (3). Available at http://www.thesportjournal.org/2004Journal/Vol7-No3/CallanThomas.asp.
  3. Dorsel, T. N. and Rotunda, R. J. (2001) “Low Scores, Top 10 Finishes, and Big Money: An Analysis of Professional Golf Association Tour Statistics and How These Relate to Overall Performance.” Perceptual and Motor Skills, 92, 575-585.
  4. Ehrenberg, Ronald G. and Bognanno, Michael L. (1990) “Do Tournaments Have Incentive Effects?” Journal of Political Economy, 96, 1307-1324.
  5. Golfstat, Inc. (2005) “Customized Team Pages-Men and Women,” (accessed August 16, 2005), various teams.
  6. Hassmen, Peter; Raglin, John S.; and Lundqvist, Carolina (2004) “Intra-Individual Variability in State Anxiety and Self-Confidence in Elite Golfers.” Journal of Sport Behavior, 27 (3), 277-290.
  7. Hume, Patria A., Keogh, Justin, and Reid, Duncan. (2005) “The Role of Biomechanics in Maximizing Distance and Accuracy of Golf Shots.” Sports Medicine, 35(5), 429-49.
  8. Krane, Vikki and Williams, Jean. (1992) “Path Analysis Examining Relationships among Cognitive Anxiety, Somatic Anxiety, State Confidence, Performance Expectations, and Golf Performance. “ Journal of Sports Behavior, December, 15(4), 279-96.
  9. Myers, David C.; Gebhardt, Deborah L.; Crump, Carolyn E.; and Fleishman, Edwin A. (1993) “The Dimensions of Human Physical Performance: Factor Analysis of Strength, Stamina, Flexibility, and Body Composition Measures.” Human Performance, 6 (4), 309-44.
  10. Moy, R. L. and Liaw, T. (1998) “Determinants of Professional Golf Tournament Earnings.” The American Economist, 42, 65-70.
  11. Shmanske, Stephen (2000) “Gender, Skill, and Earnings in Professional Golf.” Journal of Sports Economics 1(4), 385-400.
  12. United States Department of Education. (1972). “Title IX of the Educational Amendment Act.”(Available at http://www.ed.gov/policy/rights/reg/ocr/edlite-34cfr106.html)
  13. United States Golf Association (USGA) (2005), “Course Rating™ Primer.” (Available at http://www.usga.org/playing/handicaps/course_ratings/course_rating_primer.html, accessed April 25, 2006.)
  14. Wiseman, F., Chatterjee, S., Wiseman, D., and Chatterjee, N. (1994) “An Analysis of 1992 Performance Statistics for Players on the U.S. PGA, Senior PGA, and LPGA Tours.” In A. J. Cochran and M. R. Farrally (Eds.), Science and Golf: II. Proceedings of the World Scientific Congress of Golf. London: E & FN Spon. 199-204.
TABLE 1
UNIVERSITIES INCLUDED IN THE STUDY
MEN’S GOLF TEAM WOMEN’S GOLF TEAM
UNIVERSITY NUMBER
OF
GOLFERS
NUMBER OF TOURNAMENTS AVERAGE YARDS PER TOURNAMENT (STANDARD DEVIATION NUMBER OF GOLFERS NUMBER OF TOURNAMENTS AVERAGE YARDS PER TOURNAMENT (STANDARD DEVIATION)
Coastal Carolina University 10 11 6971
(119)
5 10 5994
(75)
Ea. Tenn. State University 9 10 7029
(125)
7 9 5978
(106)
Fresno State University 8 14 6924
(238)
8 11 6080
(121)
Indiana
University
9 11 7035
(129)
8 10 6120
(111)
Kent State University 8 10 7017
(156)
7 11 6111
(123)
University of Kentucky 7 10 7091
(227)
11 11 6162
(377)
University of New Mexico 8 11 7128
(330)
6 8 6090
(177)
University of So. California 9 11 6934
(186)
10 9 6115
(169)
Texas A & M University 10 11 7066
(213)
9 10 6187
(125)
University of
Texas
8 10 7218
(224)
8 9 6169
(186)
Vanderbilt University 8 10 7045
(215)
6 9 6139
(171)
Average
(std. deviation)
8.5
(0.93)
10.8
(1.17)
7042
(85.34)
7.7
(1.8)
9.7
(1.01)
6104
(66.99)

Source: Golfstat, Inc. (2005) and individual team Web pages.

TABLE 2
BASIC DESCRIPTIVE STATISTICS
MEAN STANDARD DEVIATION MINIMUM MAXIMUM COEFFICIENT OF VARIATION
VARIABLE MALE
(N=94)
FEMALE
(N=85)
MALE FEMALE MALE FEMALE MALE FEMALE MALE FEMALE
Score 74.97 79.23 2.22 3.53 69.95 73.50 81.33 94.45 0.030 0.045
Eagles 1.80 0.34 2.23 0.61 0.00 0.00 9.00 2.00 1.239 1.794
Fairways Hit 0.64 0.70 0.08 0.09 0.36 0.47 0.86 0.88 0.125 0.129
Greens in Regulation 0.60 0.50 0.08 0.10 0.33 0.16 0.81 0.65 0.133 0.200
Putts per Round 30.83 32.31 1.42 1.29 23.00 29.84 35.33 35.71 0.046 0.040
Sand Saves 0.39 0.29 0.15 0.13 0.00 0.06 1.00 1.00 0.385 0.448
Rounds 24.11 22.31 12.83 8.89 3.00 3.00 43.00 36.00 0.532 0.398
Freshman 0.17 0.29 0.38 0.46 0.00 0.00 1.00 1.00 2.235 1.586
Sophomore 0.22 0.24 0.42 0.43 0.00 0.00 1.00 1.00 1.909 1.792
Junior 0.28 0.26 0.45 0.44 0.00 0.00 1.00 1.00 1.607 1.692
Senior 0.33 0.21 0.47 0.41 0.00 0.00 1.00 1.00 1.424 1.952

NOTE: Basic statistics for each university dummy variable are available from the authors upon request.

TABLE 3
MEAN DIFFERENCES IN SHOT–MAKING SKILLS ACROSS GENDERS
Variable Mean Difference
(Male – Female)
Standard Error* t-statistic p-value
Eagles 1.4567 0.2501 5.82 <.0001
Fairways Hit –0.0540 0.0128 –4.24 <.0001
Greens in Regulation 0.0982 0.0132 7.46 <.0001
Putts per Round –1.4810 0.2036 –7.27 <.0001
Sand Saves 0.0984 0.0216 4.56 <.0001

*Standard error calculation assumes male and female populations have equal variances.


TABLE 4
REGRESSION MODEL PARAMETER ESTIMATES
DETERMINANTS PARAMETER ESTIMATE INTERACTION TERMS (FOR FEMALES) PARAMETER ESTIMATE
Intercept 69.40 *** Female Intercept –15.24 ***
Shot-Making Skill Variables Shot-Making Skill Variables
Eagles –0.10 ** (Female)(Eagles) 0.22
Fairways Hit 0.05 (Female)(Fairways Hit) –0.40
Greens in Regulation (GIR) –21.86 *** (Female)(GIR) –4.08 *
Putts per round 0.64 *** (Female)(Putts per Round) 0.53 ***
Sand Saves –1.32 ** (Female)(Sand Saves) 1.68 **
Experience Variables Academic Age Variables
Rounds –0.03 *** (Female)(Rounds) 0.01
Junior 0.05 (female)(Junior) –0.23
Sophomore –0.41 * (Female)(Sophomore) 0.68 *
Freshman 0.08 (Female)(Freshman) 0.02
Team Variables Team Variables
Coastal Carolina 0.44 (Female)(Coastal Carolina) 0.95
East Tennessee State 1.11 *** (Female)(East Tennessee) 0.49
Fresno State 0.58 (Female)(Fresno State) –0.14
Indiana University –0.21 (Female)(Indiana University) 1.77 **
Kent State –0.34 (Female)(Kent State) 1.13 *
Univ. of Kentucky 0.56 (Female)(Univ. of Kentucky) 0.35
Univ. of New Mexico 0.32 (Female)(Univ. of New Mexico) 0.07
Univ. of Southern California 0.44 (Female)(Univ. of Southern California) –0.55
Texas A&M University 0.06 (Female)(Texas A&M University) 1.01
University of Texas 0.99 ** (Female)(University of Texas) –0.56
F-Statistic 82.75
(p-value< 0.001)
R-Squared 95.87
Adjusted R-Squared 94.71
F-Statistic (no gender differences overall) 2.83
(p-value < 0.001)
F-Statistic (no gender differences with respect to shot-making skills) 2.84
(p-value = 0.012)
F-Statistic (no gender differences with respect to academic age) 2.10
(p-value = 0.103)
F-Statistic (no gender differences with respect to team variables) 2.39
(p-value = 0.012)

* significant at the 0.10 level, assuming a one-tailed test of hypothesis for skills and two-tailed test elsewhere
** significant at the 0.05 level, assuming a one-tailed test of hypothesis for skills and two-tailed test elsewhere
*** significant at the 0.01 level, assuming a one-tailed test of hypothesis for skills and two-tailed test elsewhere

2015-03-27T11:50:33-05:00June 3rd, 2006|Contemporary Sports Issues, Sports Exercise Science, Sports Studies and Sports Psychology, Women and Sports|Comments Off on Gender, Skill, and Performance in Amateur Golf: An Examination of NCAA Division I Golfers

Gender, Age, and Race as Predictors of Sports-Viewing Behavior of Sport Management Undergraduates

Abstract

In what has traditionally been a white male-dominated industry,
there are a growing number of females and minorities assuming the position
of sport manager. This trend is attributed to increasing opportunities
for female and minority participation in sport organizations at various
levels. Such levels include recreational, interscholastic, collegiate,
and professional athletic involvement. It should be noted that coaching
and management opportunities are also increasing. The purpose of this
study was to determine which, if any, demographic variables of age, gender,
or race could significantly predict the frequency of viewing behaviors
of sport-related media for undergraduate sport management students. Based
upon the literature, credibility in a sport management role can be increased
through sport-related media consumption. Fifty-five students in the undergraduate
sport management program at a research extensive university in the Southeastern
United States participated in the study. The instrument, constructed by
the researchers, was a sixteen question survey. Using multiple linear
regression analyses, only one predictor, gender, was found to have a statistically
significant impact upon the frequency of viewing sport-related media (sport
networks). The predictors of age and race were not found to be significant.

Introduction

“Print, radio, television, the Internet: When
it comes to Americans’ media consumption, it seems just about anything
goes.”

Pamela Paul, Targeting Boomers

Due to changes in education as well as the ever-changing ethnic demographic
of America, entertainment interests have changed, particularly with sport
programming (Paul, 2003). The latest U.S. Census Report indicates there
are 38.8 million Hispanics living in America and have replaced African-Americans
as America’s largest racial minority. Numerous studies have been
conducted to address the parallel between demographics and media viewing
behaviors, however research results are still inconclusive (Jack, 1999).

Where much of the media in the past was consumed by males, the trend
is changing. In fact, women have significantly higher levels of television
exposure than their male counterparts (Besley & Shanahan, 2003). In
regard to sport programming, the number of female viewers (who watch television)
is substantial. Recent studies have indicated that women have an increasing
interest in sport events (Shachar & Emerson, 2000).

Women place more importance on personal gratification exemplified by
such things as a comfortable life, pleasure, and happiness, which in turn
is conducive to an increase in their television viewing habits. According
to McCarty & Shrum (1993), “females may perceive a certain amount
of fulfillment of personal gratification through television viewing”
(p. 92). Men on the other hand, do not find fulfillment of such values
as a comfortable life, etc. in watching television (McCarty & Shrum,
1993). Men tend to be more regular readers of newspapers than women (Besley
and Shanahan, 2003). Men have a tendency to obtain information (including
sports) from newspapers as it is a medium that is seen to produce the
most reliable information (Hudson, 2001).

In regard to age and media, research and surveys conducted by Neilsen
Media Research reveal that households headed by people between the ages
of thirty-five and fifty-four comprise 40 percent of all households (Paul,
2003). Furthermore, while much television is targeted to the youth market,
adults between the ages of thirty-five and sixty-four spend an average
of 248 minutes a day watching television. This is 22 minutes more a day,
on average, than adults eighteen to thirty-four (Paul, 2003). “In
general, television viewership increases with age” (p. 25).

The Baby Boomer generation is comprised of 78 million Americans (Paul,
2003). Considering this, many media outlets are consumed by them. “Radio
is more common to the Baby Boomer generation” (p. 26). For the younger
generation, “radio may seem old-school” (p. 26) and therefore
is not considered a substantial outlet for information.

Regarding the Internet, “adults ages 35 – 54 spend more time
online than any other demographic group” (Paul, 2003, p. 26). In
addition to this group being online, many go on the Internet more than
one time a day, with an average of 22.2 days per month versus an average
of 15.2 days per month for 18-24 year olds (Paul, 2003). Fifty-seven percent
of Baby Boomers have access at work, compared with 45 percent of all adults;
69 percent of Baby Boomers have access at home compared with 64 percent
of adults overall (Paul, 2003). Nevertheless, according to the DDB Life
Style Study, 74 percent of adults younger than Baby Boomers believe that
“the Internet is the best place to get information” (p. 26)
and sports is included in this mix.

In the case of print, a study conducted by the National Opinion Research
Center found that 75 percent of those who are aged 65 to 74 read the newspaper
on a daily basis, compared with 42 percent of the total population (Polyak,
2000). As far as television viewing is concerned, the same study found
that 33 percent of those 75 and older watch five or more hours of television
a day on a regular basis, which is more than any other age group (Polyak,
2000).

Much of the media is targeted toward youth. A study that analyzed surveys
and interviews from 8-17 year olds found that at least 61 percent of children
now have a television in their bedroom (Yin, 2004). Seventeen percent
of these children have their own personal computer (Yin, 2004). Regarding
sports and youth, extreme sports have produced the greatest gains in children’s
sport consumption. (American Demographics, 2001).

Young girls tend to favor sports in which other females participate.
Girls are twice as likely as boys to watch women’s basketball (American
Demographics, 2001). Eighty-eight percent of girls like watching the Olympics
with gymnastics and ice skating comprising 78 percent of girls’
interest (American Demographics, 2001). Interestingly, football and basketball
made the list of interest among girls with 68 percent and 67 percent respectively
(American Demographics, 2001).

In contrast, 89 percent of boys tend to be interested in football (American
Demographics, 2001). Twice as many boys as girls enjoy watching boxing
(American Demographics, 2001). Soccer is the one sport that appeared to
be relatively equal among boys and girls (American Demographics, 2001).

In regard to race and media, “people may work together during the
day, but at night they’re immersed in their own culture” (Weissman,
1999, p. 16). The different television habits among blacks and whites
continue to be vastly different. However, although differences in viewing
patterns continue among blacks and whites, the gap is closing. Sports
viewing appears to be a vehicle for closing this gap. Programs such as
Monday Night Football are shown to have similarities in viewing patterns
among racial groups (Weisman, 1996). In regard to television, blacks watch
40 percent more than whites, although this gap too is narrowing (Weisman,
1996).

As the Hispanic population in America is growing, it is particularly
important to note their media viewing patterns. Marketers have recently
taken interest in this ethnic group and the question remains whether English-or
Spanish-language programming provides the best vehicle for reaching Hispanics.
Studies indicate that many Hispanics prefer programs that reflect the
first language in which they learned to speak (Mogelonsky, 1995). Print
media are used less frequently by Hispanics. On average, they (Hispanics)
spend 36 minutes a day reading newspapers, while bilingual Hispanics only
devote about 12 minutes a day reading newspapers (Mogelonsky, 1995).

“The average Latino watches 58.6 hours of television per week,
which is 4.4 hours more than the typical non-Hispanic viewer” (Fetto,
2002, p. 14). It has been noted, according to research studies, that “Hispanics
are passionately devoted to their Spanish-language television networks”
(p. 14). However, Hispanics turn to English-language television for what
they cannot get in Spanish (Fetto, 2002). Many sports attract the greatest
number of Hispanic viewers to the six major English networks, “perhaps
because these programs are virtually nonexistent in the Spanish-language
stations” (p. 15).

While television continues to be the media of choice for Hispanics, newsmagazines
are becoming increasingly popular among this group (Fetto, 2002); however,
print has been traditionally viewed as a challenging medium (Hudson, 2001).
This is due, in part to the splintered audience of the American population,
and no single form of print media can reach everyone (Fetto, 2002).

The country of origin and media usage varies for Latinos. For example,
Cubans read, listen, and watch about 7.4 hours of media a day. Dominicans
spend 10.7 hours a day with media, followed by Central and South Americans
at 10.4 hours a day. Puerto Ricans spend 10.3 hours a day with media,
while Mexicans spend 9.2 hours (Mogelonsky, 1995). Interestingly, Central-American
Hispanics watch the most television, while Cubans spend the most time
reading print materials (Mogelonsky, 1995). Listening to the radio and
reading newspapers are the media of choice for Dominicans (Mogelonsky,
1995).

This study considers which, if any, demographic variables of age, gender,
and race significantly predict the frequency of viewing behaviors of sport-related
media among undergraduate sport management students. It is hypothesized
that the demographic variables are significant in predicting viewing behaviors.

Method

Participants
Fifty-five students in the undergraduate sport management program at a
research extensive university in the Southeastern United States participated
in the study. The sample was made up of 15 females (27.3%) and 37 males
(67.3%). 83.6% were between the ages of 21-25. 30.9% were black, 65.5%
were white, and 3.6% were classified as other. 66.7% earned less than
$15,000 a year. Students were selected by the researchers as they were
representative of the sport management undergraduate program population.

Materials
The instrument, constructed by the researchers, was a sixteen question
survey. It was reviewed by a panel of experts for face validity. The approximate
time given to complete the survey was between 10 to 15 minutes. The content
questions addressed the students’ perceptions on: the importance
of reading and viewing sport-related media in obtaining future job roles
as sport administrators, whether prior or current knowledge of a sport
issue has enhanced academic performance, whether credibility is increased
among peers if they engage in consistent viewing or reading of sports
media, whether current knowledge of the athletic industry will assist
in making future business decisions, whether staying current on athletic
trends can potentially enhance business relationships, whether sports
media outlets are able to contribute to overall professionalism, and the
importance for peers to be knowledgeable on current athletic trends. In
addition, the survey was divided into two categories: 1. reading behaviors
of sport media, which addressed the amount of time spent on Internet resources,
journal articles, magazine articles, newspaper articles, and books. 2.
viewing behaviors of sport media, which addressed the amount of time spent
watching sport movies, sport networks, local sport coverage, and national
sport coverage.

The answers to these content questions were based on a five-point
Likert type scale, with a rating of one indicating strongly agree and
a rating of five indicating strongly disagree. The frequency of viewing
and reading behaviors were also based on a five-point Likert type scale,
with a rating of one indicating never and a rating of five indicating
always.

The researchers assessed the internal reliability of the
survey. The resulting Cronbach’s alpha of .626 (after the variable “journal
article” was deleted from the survey) demonstrates that the survey
was acceptably reliable.

Procedures
The researchers obtained approval from the university’s Institutional
Review Board. Students signed forms stating that their participation in
the study was voluntary. Permission from the students’ instructors
was also obtained. Students were given a survey to complete at the beginning
of class, after a brief description of the study. Ten to fifteen minutes
was given to complete the survey. No students required any type of accommodation
in completing the survey.

Prior to running the statistical analyses, the researchers
determined that the predictors of age, race, and gender should be recoded
as effect-coded variables since they are categorical.

Results

Standard multiple linear regression analyses were conducted
to see which, if any, of the demographic variables could significantly
predict the frequency of viewing behaviors of sport-related media.

Thirty-six usable surveys were included in the statistical
analyses. The mean indicates that the participants on average view sport
networks approximately 4 times a week (Table 1).

Table 1

Sport Network Viewing
Mean Standard Deviation Sample Size
Sport Networks 4.41 .84 36

It was indicated that there was a significant correlation among gender
and sport networks with a p<.05. The Pearson Correlation is r=-.624.
The direction of this relationship indicates that females on average,
view fewer sport networks per week than males. Furthermore this r value
indicates a strong relationship between the two variables. No other variables
were significant with a p< .05 (Table 2).

Table 2

Correlations between demographics
Subscale 1 2 3 4
1. Sport Networks .000* .271 .073
2. Gender .297 .233
3. Age .451
4. Race
* p<.05

The multiple correlation coefficient (R) is .65 and the multiple coefficient
of determination (R squared) is .35. This indicates that 35.2% of the
variance is accounted for in the summary. The Durbin Watson statistic
is between 1.5 and 2.5, which suggest normality. The linear combination
of predictors are significant: F(4,35)=5.758, p<.05 (Table 3)

Table 3

Analysis of Variance for Gender
Source df F p
Gender 4 5.758 .001*
Within 31 .458
Total 35
* p<.05

Discussion

The researchers investigated which, if any, of the demographic variables
of age, race, and gender significantly predicted the frequency of viewing
behaviors of sport-related media. The dependant variable, “frequency
of viewing behaviors” was comprised of six behaviors that were representative
of both reading and viewing behaviors of sport media. The behaviors included
sport networks, sport movies, Internet resources, books, newspaper articles,
and magazine articles. Only one behavior, “sport networks”
was found to have any statistical significance. As stated earlier, the
analysis found that only one predictor, “gender” was statistically
significant in predicting the frequency of viewing sport networks among
the sample.

The sample size was relatively small, thus increasing the likelihood
of a Type II error in determining that most predictors did not have a
significant effect on the frequency of viewing sport-related media. The
study targeted undergraduate sport management students at one southeastern
university, thus reducing the pool of participants. Future recommendations
would include expanding the sample size by targeting multiple universities
with similar undergraduate programs. Also, the sample size could be expanded
by targeting graduate students in sport management programs at other universities.

Furthermore, the sample was relatively homogeneous in nature; most participants
were between the ages of 21-25. Another consideration is that homogeneity
existed in regard to all of the participants being enrolled in a sport
management program; it can be assumed that an interest in sports is the
norm. The study could again be expanded by targeting other students in
programs that are non-sport related. Perhaps a comparative analysis could
be conducted to determine the differences in viewing behaviors of sport
management students and non-sport management students.

Regarding the survey, the breadth of questions could be expanded to increase
reliability as well as provide more meaningful insight to the study. The
use of focus groups could also be helpful in determining the researchers’
interest in the factors that contribute to viewing sport media.

The survey questionnaire also revealed that the juxtaposition of reading
and viewing sports-related media is conducive to credibility in the sports
industry. Research studies indicate that education is a factor in determining
the frequency of viewing media in general; it can be surmised that sport
managers are well-educated, thus increasing their engagement in consuming
sport-related media. Future studies could focus on the perceived credibility
of sport administrators who engage regularly in sport media consumption.

References

American Demographics (2001, October). Good sports-children’s interest
in sports vary.
Retrieved April 12, 2004, from American Demographics Web site:
http://www.adage.com/section.cms?sectionId=195.

Besley, J., & Shanahan, J. (2004). Skepticism about media effects
concerning the
environment: Examining Lomborg’s hypotheses. Society and Natural

Resources, 17, 861-880.

Fetto, J. (2003). Me gusta TV. American Demographics, 24(11). Retrieved
May 7, 2005
From EBSCO Business Source Elite Database.

Hudson, E.D., & Fitzgerald, M., (2001). Capturing audience requires
a dragnet.
American Demographics, 134(41). Retrieved May 1, 2005 from EBSCO Business

Source Elite Database.

Jack, C., (1999, September). Viewing motivations and implications in
the new media
environment: Postulation of a model of media orientations. American Education
Journalism Conference. 4(36). Retrieved April 12, 2005, from AEJMC archives
Web site: http://list.msu.edu/cgi-gin/wa?=ind9900d&L.

McCarty, J., & Shrum, L.J., (1993). The role of personal values and
demographics
in predicting television viewing behavior: Implications for theory and

application. Journal of Advertising, 22(4). Retrieved May 1, 2005 from
EBSCO
Business Source Elite Database.

Mogelonsky, M., (1995). First language comes first. American Demographics,
17(10).
Retrieved May 1, 2005 from EBSCO Business Source Elite Database.

Paul, P., (2003). Targeting boomers. American Demographics, 25(2). Retrieved
May1,
2005 from EBSCO Business Source Elite Database.

Polyak, I., (2000). The center of attention. American Demographics, 22(11).
Retrieved
May 1, 2005 from EBSCO Business Source Elite Database.

Shacher, R., & Emerson, J., (2000). Cast demographics, unobserved
segments, and
heterogeneous switching costs in a television viewing choice model.
Journal of Marketing Research, 37(2). Retrieved May 1, 2005 from EBSCO
Business Source Elite Database.

Weissman, R., (1999). Different strokes. American Demographics, 21(5).
Retrieved
May 1, 2005 from EBSCO Business Source Elite Database.

Yin, S., (2004). Kiddy clickers. American Demographics, 26(1). Retrieved
May 1,
2005 from EBSCO Business Source Elite Database.

2015-03-27T11:37:32-05:00March 7th, 2006|Contemporary Sports Issues, Sports Management, Sports Studies and Sports Psychology, Women and Sports|Comments Off on Gender, Age, and Race as Predictors of Sports-Viewing Behavior of Sport Management Undergraduates

The Effect of Gender Opportunity in Sports on the Priorities and Aspirations of Young Athletes

Abstract

The role and importance of athletics in the lives of today&#8217;s
male and female youth is analyzed in responses to a survey co-authored
by a professor and conducted by two undergraduate students at the United
States Sports Academy. Athletes at the middle school, high school and
junior college level were asked to rate the importance of sports in their
lives and the likelihood of advancement in athletics as well as careers
in sports. The two survey researchers, their professor and a third undergraduate
analyzed the results of the survey and how they reflect of the current
status of males and females in athletics today. The authors concluded
that female athletes have a different set of priorities regarding sports
because of the difference in athletic opportunities afforded them.

Introduction

The differences in opportunities and recognition in sports between male
and females have been well documented. Opportunities for female athletes
have increased in certain areas in the past 30 years, but females continue
to lag far behind their male counterparts.

The researchers in this project set out to find how that situation affects
the values and opinions of young athletes at the middle school, high school
and junior college level. How important are sports in their lives? What
is the likelihood they will play sports at a higher level? What is the
likelihood they will pursue a career in sports, either as a professional
athlete, coach or administrator?

The hypothesis is that the differences in opportunities and publicity
in sports for males vs. females would result in different answers between
the male and female athletes.

Background

The progress made in athletics for women and girls since the Civil Rights
act of 1964 was amended with Title IX in 1972 has been well documented.

Title IX was aimed at outlawing discrimination in schools that received
federal assistance. When opportunities for females in sports began to
be interpreted as “discrimination” and government-backed college
loans and grants began to be interpreted as “federal assistance,”
the expanded scope of the legislation allowed opportunities for females
in athletics to increase dramatically. The recognition of female athletes
resulting from increased opportunities parlayed into a larger place in
the professional sports market place as three professional women’s
basketball leagues, two pro softball leagues and a professional women’s
soccer league have existed since the passing of Title IX.

“When I was growing up, the only women you saw in professional
sports were in tennis and golf,” said Ann Meyers-Drysdale, ESPN
analyst who played in the first women’s professional basketball
league and was the first woman to try out for a team in the National Basketball
Association. “Those are sports not very many people can afford to
play, especially if you are in a family with 11 children (ussa.edu).”

The number of collegiate and professional opportunities in sports has
increased for females, as well as participation (NCWGE, 2002). While such
opportunities have increased, the differences between males and female
opportunities in the sports are still apparent. Of the aforementioned
professional leagues, only two continue operations today while the others
lasted less than five years each.

Recognition in the media has also increased, as ESPN televised all games
in the NCAA Women’s Basketball Tournament for the first time in
2003. However, male sports figures still are far more prevalent in the
media. Television commercials with male athletes endorsing products overwhelmingly
outnumber those with female athletic endorsements. Seventy to 90 percent
of the articles in Sports Illustrated are about male athletes (Eitzen
and Sage, 2003).

An NCAA survey of Division One universities in 1992 revealed that men’s’
programs received 70 percent of all athletic scholarship funds, 83 percent
of the recruiting funds and 77 percent of the operating budgets (Eitzen
and Sage, 2003).

Women are underrepresented at all levels of sports, including coaching
and administration opportunities, which have proportionately decreased
since the passage of Title IX. In 1972, coaches in female sports were
about 90 percent women. By 1998, that percentage dropped to 58 percent,
44 percent in 2002. Only 18 percent of those programs were administered
by women (Coakley, 2004).

These facts are reviewed along with the results of the survey, to see
if there is a reflection of the gender climate in sports in the athletes’
answers.

Process

Two undergraduate students and their professor composed a survey that
asked the respondents to rate the values of sports and certain aspects
there of on a scale of 1-5, with “5” meaning “very important”
and “1” meaning “not at all important.” They were
also asked to use a 1-5 scale to rate the likelihood of having a future
in sports at various levels of college or careers in sports as a professional
athlete, coach, official or in an administrative function. A score of
“5” meant “very likely” and “1” meant
“not at all likely.”

The specific questions are in Figure 1. The hypothesis was that female
athletes were more likely to give accomplishments in sports a lower priority
in their lives and to have lower expectations about their futures in sports.
The researchers also believed that because the quantity and depth of athletic
opportunities for males exceeds that for females, female respondents would
give athletics a lower priority in their lives and have lower expectations
of their future in sports.

Figure 1: Survey Content
Figure 1

One student surveyed 16 girls and 18 boys who participate in sports at
Central Baldwin Middle School in Robertsdale, Ala. Another surveyed 17
girls and 13 boys who participate in sports at Murphy High School in Mobile,
Ala. The same student surveyed 15 women and 14 men who participate in
athletics at Bishop State Community College, also in Mobile.
After the results were computed, the professor, the two students and one
additional student analyzed the results and the gathered facts about opportunities
for females in sports to see if there was a difference in the responses
between males and females that could be attributed to the current sport
climate.

Results

Because opportunities in sports at a higher level are more prevalent
for males than for females, it was believed that the more serious aspects
of sports, — such as competition, scholarship potential and challenges
— would be more important to the male athletes than the female and the
more social aspects — experience, building friendships, fun and physical
fitness — would score higher on the female responses.

The friendship hypothesis held true on all three surveys. Among middle
school athletes, the average score of importance on “building friendships”
was 4.38 for girls and 4.17 for boys, although a comparable number (nine
girls and eight boys) gave that aspect a “5” score. The high
school girls gave friendships an average rating of 4.41, compared to 4.15
for the boys, and the number of respondents rating it a “5”
was 10 girls and seven boys. Community college athletes overall gave friendships
less weight, with the women averaging a 4.0 response and the men 3.36.
Only six women and two men rated friendship a “5.” Females
at the middle school and community college level gave physical fitness
a higher average score than males (4.75 to 4.61 middle school, 4.73 to
4.21 community college), but the high school boys gave it more importance
than the high school girls (4.69 to 4.47). However, 12 high school girls
and 10 high school boys gave physical fitness a “5.” The “experience”
answer was close in the middle school group (4.38 girls and 4.33 boys
with eight each rating it a “5”), but was clearly favored
by the boys in high school (4.54 to 4.24) and women in community college
(4.2 to 4.0). “Fun” produced mixed results, with girls giving
it a higher score than boys at the middle school level, just the opposite
in high school and about even in community college.

Scholarship potential rated a higher importance among boys than girls
in the high school (4.62 to 4.0) level but it is just the opposite in
middle school (4.38 girls, 4.17 boys). In community college, where some
already have scholarships but may aspire to transfer and play at a four-year
institution, the results were about even (4.6 women, 4.57 men). The scores
were about even between male and female athletes at the high school and
community college level in the area of “challenge,” but it
ranked higher in importance for middle school boys (4.44) than girls (4.19).
Competition was also an even factor between males and females at the high
school and community college level, but higher among middle school boys
(4.56) than girls (4.38).

The students were asked “How important in your daily time are the
following activities?” with the choices being socializing with friends,
time with family, practicing sports and time with boyfriend/girlfriend.
Practicing sports was the number one answer among middle school boys (4.61)
and high school boys (4.46) but number two for community college men (3.57)
who gave studying the highest average score (3.79). Six of the 14 respondents
gave studying a “5.” Middle school girls and community college
women made “time with family” their top answer (4.5, 4.6),
while high school girls found studying (4.41) most important. In all cases,
female athletes gave “studying” a higher score than the male
athletes.

The students were asked “How important are the following accomplishments
to you?” with the choices being winning sports, personal accomplishments
in sports and “good grades.” The results were often mixed
when it came to male vs. female athletes at different levels, but the
female athletes tended to be more serious about their studies as they
approached the higher levels. Middle school girls gave “good grades”
an average score of 3.44 with more than half giving it a “3”
or lower, while high school girls scored it 4.82 and community college
women 4.93.

The importance of sports in young athletes’ lives can also be indicated
by the sources of influence in decisions regarding athletic participation.
The athletes were asked “Whose influence is important to you in
your decisions about sports?” with the options being parents, siblings,
coaches, or teammates and friends. High school and middle school boys
were most influenced by their teammates and friends while coaching influence
was more important to the girls in high school and middle school (with
parents and coaches rating a 4.63 for middle school girls). Parents were
the biggest athletic influence among both men and women in the community
college sample.

The athletes were asked to rate the likelihood they would be accomplishing
each of the following: play sports National Association of Intercollegiate
Athletics (NAIA) or at a small National Collegiate Athletic Association
(NCAA) institution, play sports at a Division One NCAA college or university,
play professional sports and have a career in sports (coaching, administrative,
officiating, etc.) In each category at each level, the male athletes gave
themselves a higher likelihood score than the female athletes. The middle
school boys gave a 4.22 to the likelihood they would have a career in
sports and/or play sports professionally. The lowest average scores in
likelihood of a career in sports were entered by the female athletes (3.13
middle school, 2.47 high school and 3.07 community college).

Conclusion

One of the most telling results of this survey as it reflects the situation
of women in sports is the fact that female athlete at all levels gave
extremely low scores among the likelihood they would pursue a career in
sports, which could be a result of the declining number of women in coaching
and administrative positions in female athletics.

The lack of exposure and opportunities for women’s professional
sports is evident when it is noted that male athletes consistently gave
themselves higher scores than female athletes when assessing the likelihood
of playing professional sports.

Perhaps this also gives the female athletes a more balanced perspective.
While the likelihood scores on professional sports and careers in sports
were consistently low for females, the likelihood score declines in the
male athletes as they reach a higher level: 4.22 in middle school, 4.08
in high school and 3.0 in college. While middle school and community college
students gave high priority to study time and time with family at the
high school and community college levels, it did not become a top priority
for male athletes except in the community college survey.

These results call for future studies with more detailed questions and
larger, more regionally heterogeneous populations. The question to be
answered from future studies is whether the current gender climate in
sports only discourages female athletes from taking their sport accomplishments
to a high level or merely balances their priorities at an early age.

References

Coakley, Jay J. (2004). Sport in Society: Contemporary Issues. 8th edition.
New York,
N.Y. McGraw-Hill.

Eitzen, D. Stanley and George H. Sage (2003). Sociology of North American
Sport, 7th
edition, New York, N.Y. McGraw-Hill.

National Coalition for Women and Girls in Education (August 2002). Title
IX Athletic
Policies: Issues and Data for Education Decision Makers. Washington, D.C.

United States Sports Academy, Women’s Basketball Pioneer Earns
USSA Media Award,
retrieved March 28, 2006 from http://www.ussa.edu/news/2006/01/13/drysdale.asp

Stats

2016-10-19T09:01:03-05:00March 2nd, 2006|Sports Management, Sports Studies and Sports Psychology, Women and Sports|Comments Off on The Effect of Gender Opportunity in Sports on the Priorities and Aspirations of Young Athletes

The Effect of Gender on Korean Teens’ Athletic Footwear Purchasing

Submitted by Dr. Taeho Yon*1, Mr. Brian Gordon*2, and Mr. Mike Mohr*3.

*1 Southern Illinois University, Carbondale, IL 62901, USA
*2 Southern Illinois University, Carbondale, IL 62901, USA
*3 Southern Illinois University, Carbondale, IL 62901, USA

Dr. Taeho Yon is an assistant professor in the Department of Physical Education at Southern Illinois University. He received a bachelor’s degree from Hongik University in South Korea, a master’s degree in recreation and sport management from Indiana State University and a Ph.D. in Sport Management from Florida State University.

Brian Gordon is a graduate student in sport management at Southern Illinois University. His area of interest includes legal aspects, sport marketing, and administration of intercollegiate athletics.

Mike Mohr is a graduate student in sport management at Southern Illinois University. His area of interest includes sport marketing (consumer behavior) and issues of people with disabilities in sport.

Abstract

The purpose of this study was to investigate factors that influence Korean teens’ athletic footwear purchase. Four hundred and fifty-six teens participated in the study. Throughout the review of related literature and the conduction of a pilot study, seven characteristics were considered; price, color, style, brand name, comfort, quality, and celebrity endorsement. ANOVA procedures indicated that gender played a significant role in the purchasing behavior of Korean teens. Male teens stated that comfort and quality are the most important factors while female teens revealed that style and color are more important factors than any other factor. Marketers and advertising managers of athletic shoes companies should utilize the findings of this study to communicate with teen consumers more effectively.

Key Words: Korean teens, Consumer behavior, Athletic Footwear,

In recent years, the buying power of the teenage Korean market has significantly increased.  According to Park (2002), in 2003, there were approximately 11.3 million (23.9% of total population) teens in Korea, with an estimated 10 billion dollars in buying power. The Korean Institute for Youth Development projected that teen spending will significantly increase over the next ten years.  Lee (2003) also pointed that due to the one child policy, which limits parents to having only one child to curb overpopulation, teens in Korea assume a greater role as consumers in the household and justify where funds are allocated.  According to a report by Korea Institute for Youth Development (2004), Korean teens exert an influence on more than $36 billion in family purchases. The report also stated that most Korean teens make purchases with money that is provided by their family. Further, they ask their parents to buy a variety of products that are not teen products such as food, furniture, electronics, and other household products.  New trends have developed within the Korean teen subculture. As a result, consumer behavior will change (Kim, 2002; Lee, 2003; Lim 2001).  Lee (2003) stated that unlike previous generations, today’s Korean teens have different consumption behavior. They are very concerned about the conspicuousness of the products. In other words, they are very conscious about how they look from others viewpoints or the image they reflect upon others. As a result, they will place a higher value on aesthetics over quality. Woo (2001) also stated that approximately 50% of teens expressed design as the most important factor when they purchase teen-related products. Design and styles are viewed as more relevant characteristics among female teens in Korea. Consequently, parents consider secondary factors such as design and style over quality and comfort.  Today’s teens are easily influenced by various advertising which presents role models such as sport entertainers (Lee, 2003). Lee (2003) found that 80% of teens are somewhat influenced by advertisements and believe the products advertised by celebrities have better conspicuousness than products that were not endorsed by celebrities.  Korean teens are very sensitive to current fashion trends and have impulsive purchasing behavior (Kwon, 2000; Lim, 2002). Lim (2002) found that almost 50% of Korean teens have purchased products impulsively. They place a greater emphasis on the style and color of a product over the quality aspect (Kim 2000). Korean teens identify with certain brand products that help express their identity and characteristics. This consumer behavior is the most important factor that leads to a purchase (Lee, 2003; Lim 2002). Lee (2003) found that 79% of Korean teens care about product brands and have a strong brand loyalty to a certain brand of athletic shoes. Wearing a certain brand of footwear is very important for a teenager because it is a way of fitting in and gaining acceptance by the peer group (Forney & Forney, 1995; Miller, 1994).  Among the teen products, athletic shoes are one of the highest brand loyalty items among Korean teens (Lee, 2003).

Apart from this, the teenage period is the life stage in which an individual’s consumption leverage increases dramatically in terms of financial resources and decision-making discretion (Shim & Gehrt, 1996). Hence, with the strong marketing impact that teens create, marketers and consumer researchers become increasingly interested in exploring the shopping behavior of teens (Kamaruddin & Mokhlis, 2003). Often such teen shopping behaviors are influenced by their demographic background. Among the different demographic variables, gender has been considered as one of the most influential variables due to the following reasons: (1) gender is easily identifiable, (2) gender segments are accessible (since most media provide this information), and (3) gender segments are large enough to be profitable, gender is still a frequently used variable to implement segmentation strategies. (Stevens, Lathrop, & Bradish, 2005; Belk, 2003; Cleveland, Babin, Laroche, Ward, Bergeron, 2003; Darley & Smith, 1995; Meyers-Levy & Sternthal, 1991).   In the sport product segment, some research investigated gender differences on athletic shoes purchasing (Belk, 2003; Lyons & Jackson, 2001). However, previous research showed inconsistent results. Belk’s (2003) study found a gender difference on athletic shoes purchasing, but Lyons & Jackson (2001) found that African-American teens did not show gender differences on athletic shoe selection.  Moreover, although there is the practical importance of gender differences in the field of consumer behavior and a growing interest in the consumer behavior of teens in Korea, a meager amount of research has been conducted to investigate the gender differences on the factors that influence teens purchasing athletic shoes in Korea.

The primary purpose of this study is to investigate the factors that influence Korean teens purchasing athletics shoes with association of gender.

Method:

Participants

Participants for this study were five hundred twenty-five randomly selected teens from 6 schools in a metropolitan area of Korea.  Self-administered surveys were given to participants. Of the 525 returned survey questionnaires, 456 were usable.  Female teens represented 46% (211) and 54% (245) were represented by male teens.

Instrumentation

A survey was developed through literature reviews and discussions with teenagers in Korea. A pretest was conducted for 37 Korean teens and the survey questions were revised to make them more appropriate for the population tested in this study. The survey consisted of two parts with 18 questions. The first part included demographics of gender and age. The second part of the survey consisted of questions about the factors that influence Korean teens to purchase athletic shoes. From the review of relevant literature, seven most important factors were identified: style, price, brand name (recognition), color, quality, comfort, and celebrity endorsement. For this section, a five-point Likert-type scale (5-Strongly agree 1-strongly disagree) was used to rate the agreement of each factor. The following is a sample statement for each information source:

• Style: When I purchase athletic shoes the style of shoes is very important

• Comfort: When it comes to deciding to buy athletic shoes, comfort is the most important factor.

• Quality: I often purchase athletic shoes which are very durable

• Price: I’m very concerned about the price of shoes

• Brand name: I am very concerned about the brand name of shoes

• Color: When purchase athletic shoes, color of the shoes is one of the major concerns

• Celebrity endorsement: I often purchase same athletic shoes that a celebrity whom I admire wore.

The data collection process was completed in five weeks. Data were entered and statistics calculated by SPSS 12.0 for Windows program. Descriptive statistics of mean and standard deviation were acquired to analyze the data. Analysis of Variance procedures were conducted with factor scores, with independent variable of gender. Alpha values were set at 0.05 to determine significant differences between genders.

Results

Descriptive statistics generated from the questionnaire indicated that for male teens comfort of shoes (M = 4.4, SD = 0.72) is the most important factor. The second most important factor is quality (M = 4.2, SD = 0.83). (See Table 1).

For female teens  style (M = 4.4, SD = 0.67) and color (M=4.3, SD=0.75) are two most important factors. (See Table 2).

ANOVA for gender are represented in Table 3.

ANOVA found that there is a significant difference between genders on style (F=24.913, p = 0.001). Style is the most important factor for female teens (M=4.4) while the third most important factor for male teens (M=3.9).  There is a gender difference on the importance of comfort (F=7.421, p= .007). Comfort is more important factor for male teens (M=4.4) than for females (M=4.1).The importance of brand name differs between genders (F=17.279, p= .001).  Brand name of the shoes is more important factor for female teens (M=3.7) than for males (M=3.2). The data revealed that there is no significant difference between genders on quality, price, and endorsement of athletic shoes.

Discussion and Managerial Implications

The results of this study provide empirical evidence regarding factors that influence Korean teens purchasing athletic footwear in relation to demographics.

The influence of factors differs between genders.  This study found that for male teens, the comfort and quality are the two most important factors while female teens ranked the style and color as the most important factors. There were significant differences between genders on style, comfort, and brand name. Interestingly, female teens showed higher scores for some physical factors of the products, style and brand name, than male teens while male teens consider internal factors such as comfort as a more important consideration.  This finding is consistent with a previous study (Park 2002; Solomon & Schopler, 1982; Taylor & Cosenza, 2002).  Females are more sensible about the appearance of the product such as style, design, and brand name while males tend to consider internal factors such as comfort and quality as more important factors. Belk (2003) also found a gender difference on perception toward athletic shoes, with women being more alert to the symbolic implications of shoes than men. Women strongly feel that their footwear is an expansion and expression of themselves. They also feel that shoes affect their perceptions of others and their perceptions of self. Compared to male consumers, female consumers see shoes as highly significant articles of clothing that are regarded as expressing the wearer’s personality.  Furthermore, for adolescents especially females, shoes are a key signifier of their identity (Belk, 2003; Park, 2002). Male consumers, on the other hand, see shoes as a utilitarian thing.  As a consequence, the style that they identify with most is the critical purchase decision-making factor for Korean female teens while comfort is the most important consideration for male teens in Korea.  Some researchers applied socio-cultural perspective to explain the fact that physical appearance is greater for women than for men (Burton & Netemeyer, 1995; Jackson 1992; Kim, 2002; Lee 2003; Striegel-Moore, Silberstein, & Rodin, 1986).  In Korea, women are generally viewed as having less social power than men (Kim, 2002; Lee, 2003).Lee (2003) stated that in Korea, traditional perceptions of the male role have centered on the man as the worker and financial provider, whereas the traditional female role has been outside of the workforce such as raising children. As a consequence, often the physical attractiveness is used as a more important evaluative cue for women because of the less “objective” criteria available for judging their successful role fulfillment.  This perspective is supported from other research (Burton & Netemeyer, 1995; Jackson 1992; Buss & Barnes 1986).  Buss and Barnes (1986) revealed that women select their spouse on the basis of their social power (as a means of elevating social position), whereas men, as the sex with greater social power, choose their spouse more on the basis of beauty and  physical attractiveness. This perspective implies that women use their appearance as a means to enhance social power (Burton & Netemeyer, 1995).  Thus, the women’s concern about their physical appearance is far greater than that of men. Such a perception and orientation certainly impacts on their purchasing behavior (Brownmiller 1984).

This study provides critical information to marketers and advertising directors of athletic shoe companies which target Korean teens.  This study found that Korean male and female students are affected by different factors when they purchased athletic shoes. Male teens seek comfortable and quality shoes while female teens consider the appearance of the product, such as style, color and brand names, as the more important factor. Therefore, marketers and advertising directors should pay emphasis on the comfort and quality for male athletic shoes advertising. For female teens, they should create more the eye-appealing advertisements. The finding of this study should be interpreted in light of some limitations. First, although the sample size was not small, the samples were drawn from schools in a metropolitan area. Therefore, it is recommended for future studies to have samples from a wider geographical distribution to provide more generalized findings.  Second, demographic characteristics other than gender should be considered in future studies. For example, future studies on this topic should examine demographic characteristics such as age, education, race, and socio-economic status. Different demographic characteristics may have a significant impact on consumption behavior.

References

Belk, R.W. (2003). Shoes and Self. Advances in Consumer Research, 30 (1), 27-34.

Brownmiller, S. (1984). Femininity. New York: Simon and Schuster.

Buss, D. M., & Barnes, M. (1986). Preferences in human mate selection. Journal of Personality and Social Psychology, 56, 735-747.

Burton, S., Netemeyer, R. G. (1995). Gender differences for appearance-related attitudes and behaviors: Implications for consumer. Journal of Public Policy & Marketing, 14 (1) 60-76.

Cleveland, M., Babin, B. J., Laroche, M., Ward, P., & Bergeron, J. (2003). Information search patterns for gift purchases: A cross-national examination of gender differences. Journal of Consumer Behavior 3 (1), 20-47.

Darley, W. K., & Smith, R. E. (1995). Gender differences in information processing strategies: An empirical test of the selectivity in advertising response. Journal of Advertising, 24 (1) 41-56.

Forney, J., & Forney, W. (1995). Gangs or fashion: influences on junior high student dress, Journal of Family and Consumer Sciences, Vol. 87, pp.26–32.

Jackson, L. A. (1992). Physical Appearance and Gender: Sociobiological and Sociocultural Perspectives. Albany, NY: State University of New York Press

Kamaruddin, R. A., & Mokhlis. S. (2003). Consumer socialization, social structual factors and decision-making styles: a case study of adolescents in Malaysia. International Journal of Consumer Studies, 27(2),145-157.

Kim , B. J. (2000). A Research on Consumption Behavior Among Youths. Unpublished Masters Thesis, Changwon University, Korea.

Kim, S. S. (2002). Korean Adolescents’ Purchasing Behavior for Hip Hop Clothes. Unpublished Masters Thesis, Yonsei University, Korea.

Korea Institute for Youth Development. (2004). Spending Power of Korean teens. Retrieved August 2, 2005 from http://www.youthnet.re.kr/

Kwon, M. H. (2000). Consumption values and rationality of consumption behavior of adolescent consumers. Unpublished Masters Thesis, Seoul National University, Korea.

Lee, J. K. (2003). A Study on the Adolescent Consumer Behavior and Economy Education Special Program. Unpublished Doctoral Dissertation, DongUi
University, Korea

Lim. H. J. (2002). Study on Adolescent Consumers’ Consumption Consciousness and Consumption Behavior : Focusing on junior high school students in Jeju city. Unpublished Masters Thesis, Jeju University, Korea

Lyons, R., & Jackson, N. (2001). Factors that influence African-American Gen-Xers to purchase Nikes. Sport Marketing Quarterly, 10, 96-101.

Meyers-Levy, J., & Sternthal, B. (1991). Gender differences in the use of message cues and judgments. Journal of Consumer Research, 28, 84-96.

Miller, C. (1994). Phat is where it’s at for today’s teen market. Marketing News, 28, 6–7.

Park, J. M. (2002). A Study on the Variables to Adolescent’s Propensity to Conspicuous consumption. Unpublished Masters Thesis, Ewha University, Korea

Shim, S., & Gehrt, K.C. (1996). Hispanic and Native American adolescents: an exploratory study of their approach to shopping. Journal of Retailing, 72,
307-324

Solomon, M., & Schopler, J. (1982). Self consciousness and clothing. Personality and Social Psychology, 8, 508–514.

Stevens, J., Lathrop, A., & Bradish, C. (2005). Tracking Generation Y: A Contemporary Sport Consumer Profile. Journal of Sport Management,19(3), 254-276.

Striegel-Moore, R. H., Silberstein, L.R., & Rodin, J. (1986). Toward an Understanding of Risk Factors for Bulimia. American Psychologist, 41, 246-63.

Taylor, S. L., & Cosenza R.M. (2002). Profiling later aged female teens: mall shopping behavior and clothing choice. Journal of Consumer Marketing,19 (5), 393-408.


Yon Gordon Mohr Table 1


Yon Gordon Mohr Table 2

Yon Gordon Mohr Table 3

2015-03-19T13:59:38-05:00January 3rd, 2006|Contemporary Sports Issues, General, Women and Sports|Comments Off on The Effect of Gender on Korean Teens’ Athletic Footwear Purchasing

Efficacy of Relaxation Techniques in Increasing Sport Performance in Women Golfers

Submitted by Dr. Linda LaGrange*1 and Ms. Janet Ortiz*2.

1* New Mexico Highlands University, Las Vegas, NM 87701 USA

2* New Mexico Highlands University, Las Vegas, NM 87701 USA

Dr. Linda LaGrange is a professor of psychology, concentration in psychopharmacology and physiological psychology at New Mexico Highlands University. Her research interests range from the biological correlates of sensation seeking to the fetoprotective capacity of bioflavonoids, and finally, the association of alcohol consumption with aggressive behavior.

Janet Ortiz received B.A. in Psychology and M.S. in Clinical Psychology from New Mexico Highlands University. She became interested in the game of golf at the age of four when first introduced to the game by her father. She began competitive golf at the age of six and played in the Sun Country (New Mexico and west Texas) and the American Junior Golf Association (national) junior circuits. In high school, Janet received All-District and All-State honors each year and was a five-time varsity letter winner. She was also a member of state championship team in 1996. Finally, Janet was a student-athlete as a member of the University of Wyoming women’s golf team for two years where she was a varsity letter winner both years.

Abstract

Stress and anxiety can adversely affect athletic performance across all levels of athletic ability and types of sports. The researchers wanted to determine if progressive relaxation techniques (PRT) would improve sports performance in a group of female recreational golfers. The study was conducted over a 3-month period during which the experimental group (n=9) regularly engaged in PRT. Both the experimental group and the control group (n=9) played their regular golf game; recording their scores, putts per round, and number of greens hit in regulation. Preintervention measures were recorded and compared with post intervention measures. Both groups recorded significant improvement on all three measures. The amount of improvement observed for the experimental group was more than that observed for the control group. The between-group differences were not, however, significant.

Introduction

One of the most difficult obstacles to overcome among people who strive to improve their sports performance is that of anxiety.  Anxiety becomes even more of an obstacle to attaining optimal performance in the concentration-intense sports such as golf.  Beyond the competition-induced stress and anxiety, the competitors may find themselves dealing with two other general sources of stress: competition-related issues such as coach/team interactions and stress factors that are completely external to competition, such as sleep deprivation.  Anshel, Kim, Kim, Chang, and Eom (2001) further categorized stress into acute and chronic stress.  Most relaxation techniques are designed to deal directly with acute stress, whereas there are few studies of possible relaxation methods that are designed to alleviate both acute and chronic stress.

Two of the most common general types of relaxation techniques are progressive relaxation and imaginal relaxation. Progressive relaxation is characterized by tensing and relaxing the muscle groups and is typically accompanied by deep breathing exercises. Specifically, it entails tensing a particular muscle group, maintaining the tension briefly, and then releasing the tension.  Typically, the individual begins with the lower extremities, gradually progressing up to the neck and shoulders (Nideffer, 1981; Bernstein & Borkavec, 1993). Imaginal relaxation techniques are driven by cognitive processes and do not involve muscular tension and relaxation (Scogin, Richard, Keith, Wilson, & McElreath, 1992).

Nicholls, Holt, and Polman (2005) interviewed a number of golfers to determine what types of coping strategies they employed when they were in the midst of competition.  The most effective strategies included rationalizing, reappraising, blocking, positive self-talk, following a routine, breathing exercises, physical relaxation, and seeking on-course social support.  In a recent qualitative study (Giacobbi, Foore, & Weinberg (2004), semi-structured interviews were conducted with 11 golfers in which the golfers were asked to identify the most common sources of stress they encountered when playing golf.  They were then asked to describe their coping responses.  Their various coping strategies included cognitive strategies, relaxation techniques, off-course, efforts, golf course strategies, avoidance coping, and emotion-focused coping.  Of the 11, 6 used some form of relaxation, usually as part of their pre-shot routine.  The golfers found relaxation techniques effective both on and off the golf course.  In a study of 51 male varsity golfers, the efficacy of pre-competition imagery use on competition performance was examined.  The researchers found that motivational general mastery imagery was positively associated with golf performance as was elevated personal self-efficacy.  Interestingly, the higher the degree of personal self-efficacy, the more likely the golfers were to engage in general-mastery imagery (Beauchamp, Bray, & Albinson, 2002).  Finally, in a study in which comparisons were made of two coping interventions, cognitive intervention and progressive relaxation, Haney (2004) found that both strategies reduced trait anxiety and increased self-efficacy among a sample of female athletes.  However, the improvements seemed to be longer lasting for the cognitive intervention group.  It was not clear if the progressive relaxation group participants continued their relaxation program.  It seems likely that if the progressive relaxation program were discontinued, its beneficial effects would dissipate over time.

Giacobbi and Foore (2003) have observed that there has been relatively little research conducted on non-elite golfers.  They assert that the potential for sport psychologists to render services to the millions of avocational golfers in the U.S. could be greatly enhanced if more were known about how these golfers deal with sport-related stress.  Thus the current study recruited participants who were not professional athletes, but whose game would, nevertheless, be negatively influenced by anxiety.  We wanted to determine if regularly listening to a 20-minute standard progressive relaxation recording over a 3-month period would positively affect the participants’ golf game.

Hypotheses

It was  hypothesized that the women in the experimental group who listened to the progressive relaxation tape would improve their golf performance relative to the women in the control group as measured by the following three dependent variables:  1) scores per 9-hole round, 2) number of putts per round, and 3) number of greens hit in regulation.

Methods:

Participants

Before participant recruitment and data collection, the research protocol was reviewed and approved by the New Mexico Highlands University IRB committee.  Study participants were recruited from Women’s Golf Associations throughout New Mexico.  Their ages ranged from 19 to 48 years (mean = 33).  All of the participants had current United States Golf Association (USGA) handicaps between 6 and 12.

Materials

Each participant was given a 20-minute standard relaxation cassette tape.  The tape contents were originally developed by Dr. Kathy B. Parker, who, at the time, was a sport psychologist for the University of Wyoming Athletic Department.  Contained in the recording are the instructions for tensing and relaxing specific muscle groups, beginning with the arms, moving up towards the head, and then moving down the shoulders, back, and legs.

Procedures

Recruitment fliers containing project information were posted at golf courses and country clubs throughout the state of New Mexico. Once recruited, the participants were asked to record the number of putts per round of golf (in this case, 9 holes), their scores for each round, as well as the number of greens hit in regulation, for the next four rounds.  These data provided the baseline for post intervention comparison purposes.  Once the baseline data collection was completed, the 18 participants were randomly assigned to one of two groups:  the experimental group, which received the relaxation tape, and the control group, which did not get a relaxation tape.  The participants assigned to the control group were instructed to continue with their normal practice and playing routines for the next three months.  They were provided with logbooks in which they were to record their scores, putts per round, and greens in regulation for each round of golf they played.  The experimental group participants were also given logbooks and instructed to maintain normal practice and playing routines.  In addition, they were told to listen to the relaxation tape five times a week, at bedtime, for the first 30-day period of the study.  At the end of the first month, the participants from both groups were asked to turn in all of their scores.

During the second month of the study, the participants in the experimental group were instructed to reduce the number of times they listened to the relaxation tape from five to three times per week.  Participants from both groups were instructed to continue with their normal practice and playing routines and to also continue keeping a record of their scores in the logbook.  At the end of the second month, the participants again turned in all of their scores.

In the third and final month, the participants in the experimental group were told to listen to the relaxation tape just once a week.  All other activities for both groups remained the same.  Upon completion of the third month the participants played a final 36 holes.  A final tally of the latest scores per 9-hole round, the number of putts per round, and the number of greens hit in regulation was recorded.

Results

Means and standard deviations were computed for the pre and post conditions for both groups.  Pre group values did not vary significantly between groups for all three dependent variables; scores per 9-hole round, putts per round, and number of greens hit in regulation.

Because the participants were recruited in late winter and early spring, it was expected that participants from both groups would improve on all three dependent variables as a consequence of playing more often as the weather improved.  This indeed was the case (see Table 1).  However, we hypothesized that the participants in the experimental group would improve significantly more than their counterparts in the control group.

Figures 1-3 illustrate the improvement trends for both groups for each of the three dependent variables.  Independent groups t-tests were performed to compare the degree of improvement observed for the cassette group with the improvement observed for the no cassette group on each of the three dependent variables.  All effect sizes are reported using Cohen’s d equation.  For the first, in which the comparison was the improvement in scores per round for the cassette group (M = 0.1986, SD = 0.1254) and the no cassette group (M = 0.1143, SD = 0.1395), the difference was not statistically significant, t(16) = -1.299, p >0.05. The effect size was calculated at 0.64.  The second variable was that of number of putts per round.  The improvement by the experimental group (M = 0.0649, SD = 0.0286), although better than that of the control group (M = 0.097, SD = 0.0278), was not statistically significant, t(16 = -1.141, p >0.05.  The effect size was 0.54.  The final variable to be tested was that of the number of greens hit in regulation.  The experimental group (M = 0.2638, SD = 0.1401) again improved more than the control group (M = 0.1812, SD = 0.0792), however the difference in improvement was not statistically significant t(16) = -1.539, p > 0.05.  The effect size was 0.76.

Discussion

As expected, both groups improved over the three-month course of the study.  The question was, however, would the participants in the experimental group demonstrate significantly greater improvement than their counterparts in the control group.  For each of the three dependent variables, the improvement observed in the experimental group exceeded that of the control group.  However, the group differences were not significant.  Yet, the effect sizes, ranging from .54 – .76, were certainly not negligible, indicating that the lack of significance was, in part, a consequence of the small sample size.  The improvement trends illustrated in Figs. 1-3 seem to grow more robust with time.

It would be of interest to determine if improvement leveled off after a specific length of time.  Additionally, would the level of improvement be maintained even if the participant no longer engaged in progressive relaxation?  This question is at least partially addressed by Haney (2004), who noted that many stress management plans for athletes are constructed to be sport-specific as well as task-specific.  In the case of progressive relaxation, the intervention can address sources of anxiety unrelated to sport performance.  However, in her study, the progressive relaxation group experienced a rebound level of anxiety (after significant improvement) from post-experiment levels to the follow up data collection.  This rebound was attributed, at least in part, to a reduction in the number of participants who continued to practice the relaxation regimen.  If we were to replicate our study, it would be useful to continue the sampling period beyond the 3-month period during which the experimental group was actively practicing the relaxation technique.

An observation made by Giacobbi et al. (2004) was that among non-elite golfers there is a great degree of variability in how individuals cope with stress.  It would be of interest to know whether the exposure to the progressive relaxation tape altered the coping responses of the participants or if it reduced the overall level of stress.  Another observation made by Hassmen, Raglin, and Lundqvist (2004) was that there was a strong correlation between Somatic Anxiety scores and golf performance.  In a future study it would be beneficial to determine if the long term practice of progressive relaxation would alter a participant’s scores on the Somatic Anxiety scale.

According to Nideffer (1976) one of the important issues to be considered when dealing with closed-skill sports, as is golf, is that the skills are automatic and thus do not demand a dynamic form of attention.  This frees up attentional processing capacity, which allows the athlete to attend to other stimuli, some of which could be internal feelings of anxiety.  This concept was studied further by Liao and Masters (2002).  They describe how stress can cause athletes to reallocate information-processing resources from athletic performance to irrelevant stimuli, thus impairing performance.  More of this process could be understood if we could determine if progressive relaxation techniques, by reducing anxiety, prevent the reallocation of information-processing resources.  Or, is it possible that the participants who engaged in the relaxation program simply increased their attentional processing capacity?

In summary, PRT seemed to enhance the improvement in golf performance observed in a group of female recreational golfers.  The dependent variables included scores per 9-hole round, number of putts per round, and number of greens hit in regulation.  The members of the control group also improved their golf game, but not to the degree experienced by the experimental group.  The effect sizes (Cohen’s d) for the differences in improvement were 0.64 for scores per 9-hole round, 0.54 for number of putts per round, and 0.76 for number of greens hit in regulation.

References

  1. Anshel, M.H., Kim, K-W, Kim, B-H, Chang, K-J, & Eon, J-J (2001).  A model for coping with stressful events in sport :  Theory, application, and future directions.  International Journal of Sports Psychology, 32, 43-75.
  2. Beauchamp, M.R., Bray, S.R., & Albinson, J.G. (2002).  Pre-completion imagery, self-efficacy, and performance in collegiate golfers.  Journal of Sports Sciences, 20, 697-699.
  3. Bernstein, D.A., & Borkovec, T.D. (1973).  Progressive relaxation training.  Champaign, IL:  Research Press.
  4. Giacobbi, P.R., & Weinberg, R.S. (2000).  An examination of coping in sport:  Individual trait anxiety differences and situational consistency.  Sport Psychologist, 14, 42-62.
  5. Giacobbi, P., Jr., Foore, B., & Weinberg, R.S. (2004).  Broken clubs and expletives:  The courses of stress and coping responses of skilled and moderately skilled golfers.  Journal of Applied Sport Psychology, 16, 166-182.
  6. Haney, C.J. (2004).  Stress-management interventions for female athletes:  Relaxation and cognitive restructuring.  International Journal of Sport Psychology, 35, 109-118.
  7. Hassmen, P., Raglin, J.S., & Lundqvist, C. (2004).  Intra-Individual Variability in State Anxiety and Self-Confidence in Elite Golfers.  Journal of Sports Behavior, 27, 277-291.
  8. Liao, C.M. & Masters, R.SW. (2002). Self-focused attention and performance failure under psychological stress.  Journal of Sport & Exercise Psychology, 24, 289-305.
  9. Nicholls, A.R., Holt, N.L., & Polman, R. (2005).  A phenomenological analysis of coping effectiveness in golf.  Sport Psychologist, 19, 111-130.
  10. Nideffer, R.M. (1976).  The Inner Athlete.  New York:  Thomas Crowell.
  11. Scogin, F., Rickard, H.C., Keith, S., Wilson, J., & McElreath (1992).  Progressive and imaginal relaxation training for elderly persons with subjective anxiety.  Psychology and Aging, 7, 419-424.

Ortiz LaGrange Table 1

Ortiz LaGrange Figure 1 Ortiz LaGrange Figure 2 Ortiz LaGrange Figure 3

2015-03-19T13:45:15-05:00January 2nd, 2006|Contemporary Sports Issues, Women and Sports|Comments Off on Efficacy of Relaxation Techniques in Increasing Sport Performance in Women Golfers
Go to Top