Authors: Mitchell T. Woltring, University of South Alabama
Corresponding Author:
Mitchell T. Woltring, Ph.D.
171 Jaguar Drive
HKS 1016
mitchellwoltring@southalabama.edu
251-461-1925
Dr. Mitchell Woltring is an assistant professor of Sport Management at the University of South Alabama. He teaches undergraduate classes in the Leisure Studies program which serves both sport management and therapeutic recreation students. He received his Ph.D. in Human Performance from Middle Tennessee State University, an M.S. in Sport Management from Middle Tennessee State University, and a B.S. in Sport Management from Minnesota State University, Mankato. He has worked in the sport industry with several baseball teams at the MLB, college, and amateur levels, as well as coaching at the high school level.
Attendance Still Matters in MLB: The Relationship with Winning Percentage
ABSTRACT
The relationship between average attendance and winning percentage for Major League Baseball (MLB) teams across a 16-year period, from 1998-2013 was investigated. Attendance in baseball is an important topic because with a schedule at least twice as long as any other major North American league, MLB has the potential to gain a competitive advantage by maximizing attendance.
The relationship between attendance and winning percentage has been researched by looking at how winning percentage affects future attendance (3, 7). However, there is also evidence of a bidirectional relationship between attendance and winning percentage which suggests that attendance could be acting on winning percentage (3, 6). The excitement caused by a capacity crowd has the potential to influence the home team to perform better, which is exhibited by Baade and Tiehen’s postulation that attendance of at least 75% of stadium capacity can, “generate a different sense of excitement” (1).
An innovative method to examine attendance was used; rather than relying on aggregate attendance numbers, average attendance was recorded as a proportion of total stadium capacity. MLB stadiums range in capacity from 34,078 to 56,000, so aggregate numbers do not accurately reflect the potential differences in attendance between teams.
Four different statistical analyses were run which controlled for year, stadium capacity, and team payroll to determine the relationship between average attendance measured as a proportion of stadium capacity and winning percentage. Analyses of crosstabs, ANOVA, regression, and logistic regression all found a significant relationship between average attendance as a proportion of stadium capacity and winning percentage. Based on the research question, regression analysis proved to be the most applicable of the results. Regression results showed that average attendance as a proportion of stadium capacity was positively related to winning percentage, R2 = .242, p <.001.
The results indicate that attendance has the potential to increase winning percentage, which should be of interest to any MLB team. It should especially be of interest considering that over the course of the present study, MLB stadiums were only filled to 67% capacity.
Keywords: Attendance, Winning Percentage, Competitive Advantage, Major League Baseball
INTRODUCTION
The nature of professional sport affords the opportunity for teams to win both on the field and economically. In absolute terms, only one team in a league will truly ‘win’ in a given year, so promoting economic success is paramount. As broadcast rights continue to be the dominant revenue driver for professional sport leagues, Major League Baseball still holds a potential advantage over its counterparts: they play many more games. Playing twice as many as the NBA and NHL and ten times as many as the NFL, MLB has the chance to accumulate more game-related revenue from categories such as ticket sales, concessions, and parking. Within the league itself individual teams hold advantages based on the ability to accommodate more fans per game. MLB stadiums range in seating capacity from just over 34,000 to 56,000. Therefore, measuring team performance based solely on total attendance does not tell the entire story as a sellout for one team may only equate to three-quarters capacity for another. In order to assess a team’s attendance effectiveness relative to its competition, attendance must be looked at as a proportion rather than an aggregate.
Winning percentage is a popular dependent variable in baseball studies. Two types of independent variables exist to determine their relationship to winning percentage. The first are variables which are a direct product of what happens on the field of play, such as hitting, fielding, and pitching statistics. The second are variables that do not directly affect the product on the field, such as payroll, attendance, and market size. The present study focuses on the latter of the two, as it investigates the relationship between attendance and winning percentage. Additionally, payroll and stadium capacity are controlled for due to their documented importance and inherent influence on attendance numbers.
The relationship between attendance and winning percentage has been examined, but such studies often look at winning percentage as causation for attendance. Davis and Horowitz both found that attendance and winning percentage were related (3. 6). Horowitz concluded a bidirectional relationship between the two, while Davis suggested that causation runs from winning percentage to attendance. In a following study, Davis found winning percentage as a significant determinant of attendance for 12 National League teams; though the study did not establish causation both ways (4). Lemke, Leonard, and Tlhowane found attendance increases as home team win probability increases. There is evidence that causation may run from attendance to winning percentage, but the bulk of the literature has been researched the other way (7).
The present study controls for payroll and stadium capacity as both have been shown to affect attendance. Wiseman and Chaterjee found team payroll was positively correlated to team winning percentage (9). Additionally, they found that this relationship has grown stronger since the late 1990’s. Hall, Szymanski, and Zimbalist did not find causality evidence from payroll to team winning percentage in their entire dataset, but they did note an increased correlation in the 1990’s (5). Additionally, they stated that an MLB team with a payroll of at least 150% of the league average could expect a winning percentage of at least .550. This is an important finding, because Vrooman identified .550 as a benchmark winning percentage for qualifying as a playoff team (8).
Stadium capacity certainly affects attendance since a larger stadium can invariably lead to higher aggregate attendance numbers. While studies have investigated the relationship between attendance and winning percentage, few have used seating capacity alone as a predictor. Clapp and Hakes determined newly constructed stadiums increased attendance by 32-37%, with the effect lasting as long as 6-10 years (2). Such a spike could have effects on winning percentage based on its relationship with attendance. However, stark differences in stadium capacity across MLB make it necessary to include it as a control variable.
The present study aims to fill a gap in the existing literature for the relationship between attendance and winning percentage. Evidence suggests there may be a causal relationship running from attendance to winning percentage, but existing literature has looked at the relationship mainly from the other direction. Payroll is an important control variable that has been shown to be a significant predictor of winning percentage and could logically have an impact on attendance. Stadium capacity also warrants inclusion as a variable in order to control spikes in attendance as a result of new venues and the disparity in capacity between stadiums. Therefore, the present study seeks to investigate the effect of attendance on winning percentage when controlling for payroll, year and stadium capacity.
Research Question
Viewing a team’s attendance as a percent of stadium capacity provides a more detailed description of how well a team is drawing comparative to their stadium situation. The ability to show a relationship between attendance and winning percentage would strengthen the argument for teams to be proactive in their approaches to filling their empty seats. With that in mind, the research question for the present study is: When controlling for year, stadium capacity, and team payroll, what effect does the average attendance as a proportion of stadium capacity have on a Major League Baseball team’s winning percentage?
Hypotheses
Based on the research question and literature review, four hypotheses were developed:
- When controlling for year, stadium capacity, and team payroll, Major League Baseball teams with an average attendance equal to or over 75% of stadium capacity are more likely to have a winning percentage over .550 than Major League Baseball teams that have an average attendance under 75% of stadium capacity.
- When controlling for year, stadium capacity, and team payroll, a Major League Baseball team with an average attendance greater than or equal to 75% of stadium capacity has a higher winning percentage than a Major League Baseball team with an average attendance under 75% of stadium capacity.
- When controlling for year, stadium capacity, and team payroll, the average attendance as a percentage of stadium capacity of a Major League Baseball team is positively related to winning percentage.
- When controlling for year, stadium capacity, and team payroll, the higher average attendance based on percentage of stadium capacity of a Major League Baseball team, the more likely it is that they will have a winning percentage over .550.
METHODS
For the present study, data was analyzed over a 16-year period of Major League Baseball, from the 1998-2013 seasons. The dataset was obtained from the database at Baseball-Reference. The dataset can be downloaded at http://www.baseball-reference.com/.
The dependent variable for the present study is Major League Baseball team winning percentage expressed as a proportion. In order to answer the hypotheses, winning percentage is presented as both a continuous and categorical variable. Continuously, winning percentage is on a scale from 0-1, with 0 representing winning no games and 1 representing winning all games. As a categorical variable, winning percentage was split at .550. Vrooman identified a regular season winning percentage of .550 for Major League Baseball teams as the “magic number” for building a championship team (8).
The independent variable is average attendance as a percentage of stadium capacity. There are seasons where average attendance for particular teams was over 1 due to the sales of standing room only tickets, which are not counted towards stadium capacity. The parameters of this variable were extended beyond 1 to account for, and not diminish such examples. Average attendance as a percentage of stadium capacity was also recoded into a categorical variable for the analysis of the present study. As a categorical variable, average attendance was split at .75. Determining this was difficult due to an apparent lack of research related to this relationship. In their work on baseball attendance, Baade and Tiehen found no correlation between stadium size and attendance, but they did posit that a three-quarters (75%) full stadium could “generate a different sense of excitement”, which in turn generates positive fan impressions (1). They added that positive fan impressions equate to positive implications for future attendance.
As earlier noted, stadium capacity and payroll are controlled for, as well as the year. Payroll is measured both continuously, since MLB does not have a salary floor or salary cap, so teams can spend as much as they want; and categorically at 150% of the league average for a given year to meet the parameters based on the work of Hall et al. and Vrooman (5, 8). Stadium capacity and year are both measured continuously.
Analyses were performed with several methods in order to present the most accurate picture of the results and answer each of the hypotheses. Analyses presented include crosstabs, ANOVA, regression, and logistic regression in order to answer hypotheses with various combinations of categorical and continuous variables.
RESULTS AND DISCUSSION
Table 1 displays the descriptive statistics for the present study. The first noteworthy result is that average attendance as a percent of stadium capacity across all of MLB is 67%, so one-third of all seats go unfilled in ballparks each year. Based on the literature we would expect similar numbers of teams to fall into both the ≥ 55% winning percentage category and the ≥ 150% payroll category, but 27.8% of teams fall into the former while only 9.58% fall into the latter. Perhaps the most telling result is the similarity of the percentage breakdowns of teams falling into the ≥ 55% winning percentage category and teams falling into the 75% – 150% average attendance as a percent of stadium capacity category.
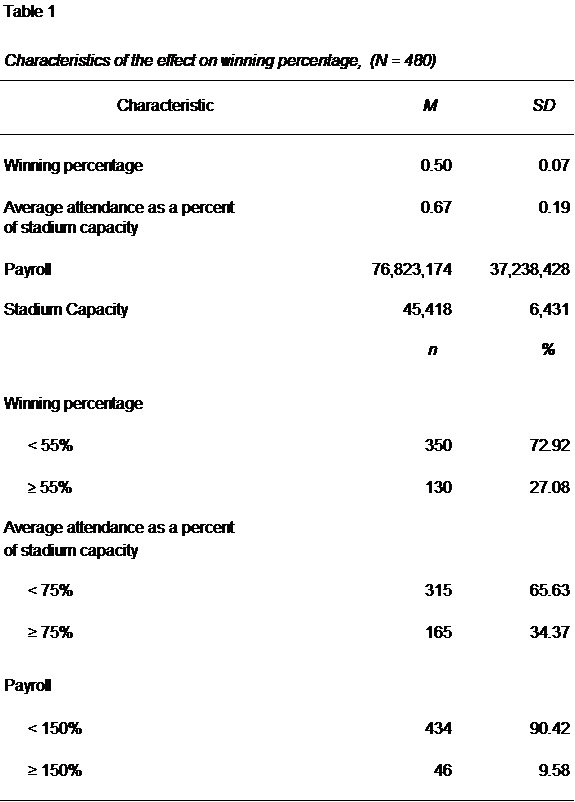
Table 2 displays the crosstabs for the present study and relates to hypothesis one. The results from the crosstabs analysis confirm that when controlling for year, stadium capacity, and team payroll, Major League Baseball teams with an average attendance equal to or over 75% of stadium capacity are more likely to have a winning percentage over .550 than Major League Baseball teams that have an average attendance under 75% of stadium capacity.
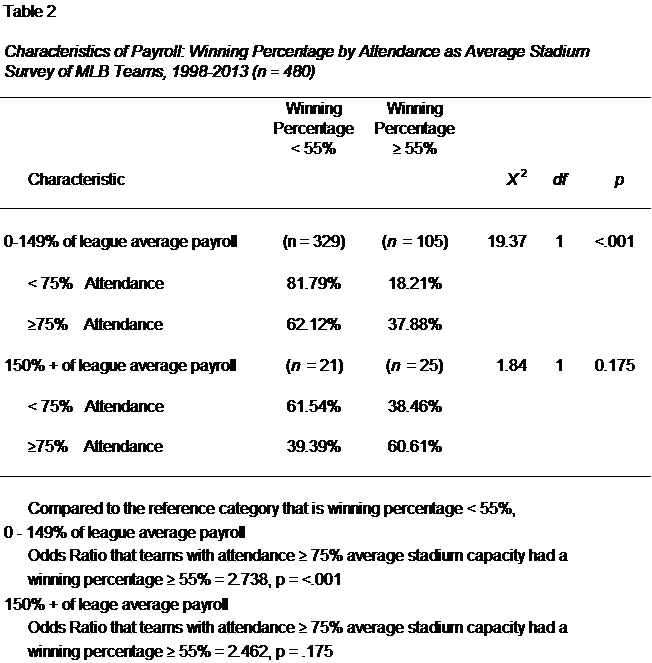
Table 3 displays the ANOVA results for the present study and relates to hypothesis two. Table 3 shows the main effects model for the ANOVA analysis, as there were no significant interaction terms. Interaction terms were initially tested with all combinations of independent variables. In repeated analyses, each interaction was removed one by one at the discretion of the researcher until the final interaction model was run with only one interaction, the interaction between attendance and payroll. When that analysis still yielded no significant interaction result, the main effects model was used. The main effects model contained average attendance, payroll, year, and stadium capacity. Average attendance was a categorical variable split at 75% of stadium capacity and was a significant predictor of winning percentage. Winning percentage is higher for MLB teams who have attendance ≥ 75% of stadium capacity. Average payroll was also a categorical variable, at 150% of the league average payroll. Payroll was a significant predictor of winning percentage – winning percentage is higher for MLB teams who have a payroll ≥150% of the league average. Stadium capacity was a continuous variable and was also a significant predictor of winning percentage – the stadium capacity for an MLB team is positively related to winning percentage. The final variable in the model was year. Year was a continuous variable and was not a significant predictor of winning percentage. The overall fit of the model was significant, leading the researcher to accept hypothesis two.
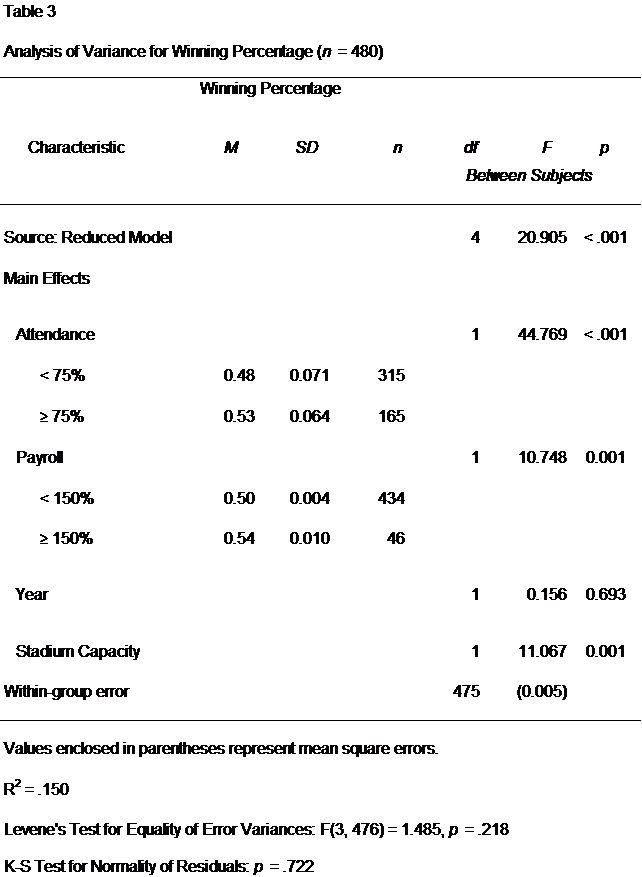
Table 4 displays the Regression analysis results for the present study and relates to hypothesis three. Table 4 shows the main effects model for the regression analysis, as there were no significant interactions. Interaction terms were initially tested with all combinations of independent variables present in the analysis. In repeated analyses, each interaction was removed one by one at the discretion of the researcher and when the final interaction analysis yielded no significant interaction result, the main effects model was used. The main effects model contained average attendance, payroll, year, and stadium capacity. Average attendance was a continuous variable and was a significant predictor of winning percentage. Average attendance as a proportion of stadium capacity is positively related to winning percentage. Payroll, stadium capacity and year were all continuous variables and were also positively significant predictors of winning percentage. The overall fit of the regression model was significant, leading the researcher to accept hypothesis three.
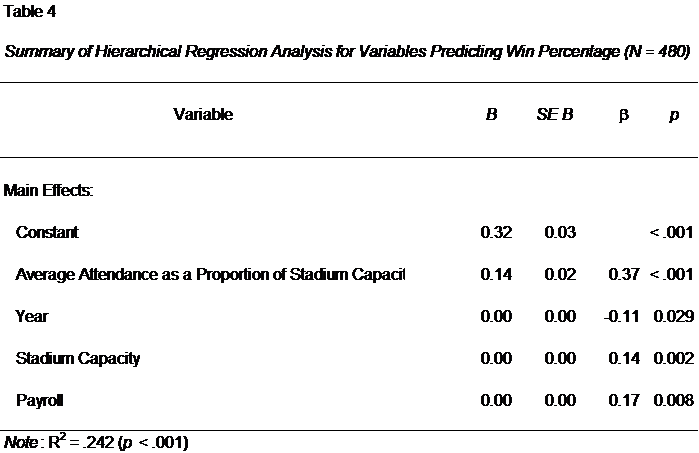
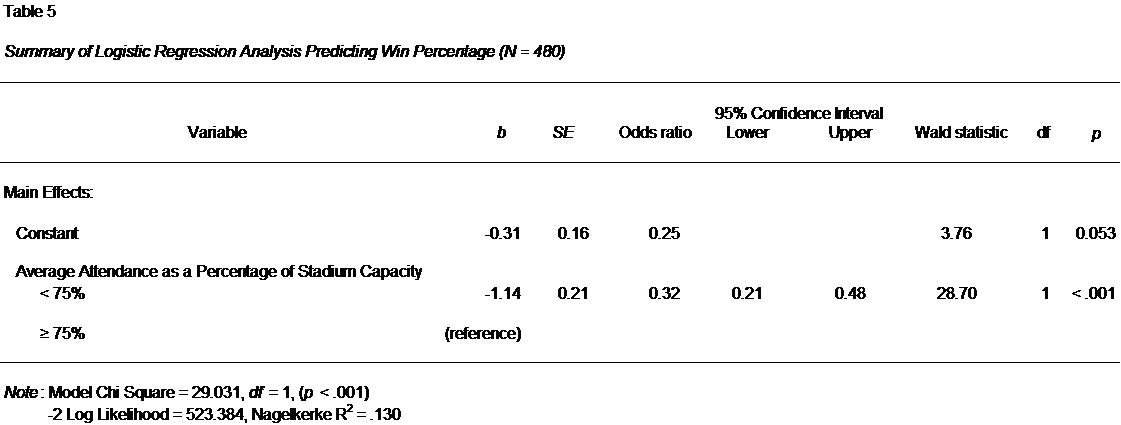
Table 5 displays the Logistic Regression analysis results for the present study and related to hypothesis four. Table 5 shows the main effects model for the Logistic Regression analysis, as there were no significant interactions. Interaction terms were initially tested with all combinations of independent variables present in the analysis. In repeated analyses, each interaction was removed one by one at the discretion of the researcher and when the final interaction analysis yielded no significant interaction result, the main effects model was used. Additionally, the Logistic Regression final model contains only average attendance as a proportion of stadium capacity as all other independent variables were subsequently removed because they were not significant. The overall fit of the logistic regression model was significant, leading the researcher to accept hypothesis four.
Based on the analyses run, average attendance as a proportion of stadium capacity is positively related to winning percentage. Analyses of crosstabs, ANOVA, regression, and logistic regression all found a significant relationship between average attendance as a proportion of stadium capacity and winning percentage. The homogeneity of results, regardless of the analysis run leads the researcher to believe in the positive relationship between average attendance as a proportion of stadium capacity and winning percentage. Because of the relative sameness in results, it is important to decipher the differences between them in order to determine which is the best for the regarding the research question and the aim of the study.
The first way to delineate between the analyses is to look at how the dependent variable, winning percentage, is set up. The crosstabs and logistic regression have the dependent variable set up categorically, while the ANOVA and regression results have the dependent variable set up continuously. Since the split at .550 for winning percentage was chosen due to its relationship to building a championship team, results from crosstabs and logistic regression could be implied to predict post-season chances. The aim of the present study was not necessarily to garner an understanding of the relationship between attendance and making the playoffs, it was rather to investigate its relationship to winning percentage in general; so while the crosstabs and logistic regression results help to answer hypotheses and provide supporting evidence, they do not truly answer the research question.
The key determinant in answering the research is question is whether to represent attendance as a continuous or categorical value. In ANOVA it is represented categorically. While this could serve a purpose of helping to determine the relative loyalty of fan bases, the research on this topic is scarce and requires further examination. The present study, then, would be best served with attendance represented as a continuous variable, so regression provides the best results from which to base the conclusions of this study.
The design of this study shows that teams would do well to observe attendance as a percentage of stadium capacity, rather than an aggregate amount. These results could have implications for MLB teams as they devise attendance-increasing strategies. MLB as a whole should look to ways to address the fact that one-third of all of their seats went unoccupied during the last 16 years. MLB enjoys a potentially significant competitive advantage over other professional leagues when it comes to attendance due to the sheer amount of games that are played during the season.
CONCLUSIONS
From an individual franchise perspective, even if a team plays in a stadium with a smaller maximum capacity than its counterparts, their ability to fill as many seats as possible may contribute to their team’s on-field performance. With such a large portion of revenues emanating from broadcast rights, the model of succeeding economically by filling the stadium is not nearly as relevant today. But, the model for improving team performance may still be influenced by fans in the stands. Future studies should investigate the relationship between attendance and winning percentage on smaller scales. The present study looked at an entire season, but there may be valuable results found in smaller portions of seasons, even all the way down to a game-by-game examination. In all, average attendance is an issue that should be at the forefront of each franchise, as well as MLB as a whole.
APPLICATIONS IN SPORT
Findings of the present study could be of value to quite a diverse audience. Coaches and athletes may be interested from the psychological implications of performing in front of a robust crowd, especially as it relates to potentially increased performance and playoff appearances. However, team and league executives who are devising and executing strategies centered on drawing fans are most likely to see the practical applications of the results. Attendance may not be as important of an economic factor as it once was, but it is not being argued as wholly unimportant by any means. Beyond the ticket sales additional revenues that any given attending fan generates, the results imply the ability to utilize current attendance as an influential factor on future attendance.
If teams see an increase in winning, due in part to an increase in attendance and the atmosphere that it creates, then an increased emphasis on boosting attendance early on plays a role in increasing attendance as the season goes on, since we tend to see attendance increases as a team is more successful. It may turn out to be more advantageous, then, to emphasize more inexpensive ticket pricing earlier in the season. This may run counterintuitively with established ticketing strategies which tend to assume that fans are more energized at the beginning of the season and are more likely to come to a game, and thus ticketing promotions/strategies are more heavily utilized as the season goes on.
This is why it is especially important to consider this research question on a smaller-scale rather than in an entire season setting. Monitoring and measuring changes based on team performance and attendance at various times during the season may result in more accurate representation of how these factors interact with one another. Other factors such as day/night games, weekday/weekend games, current winning/losing streak, and a host of other factors may be involved in such measurements as well. This is all information that would be readily available to any decision-maker for a franchise or the league, but framing it in a way that seeks to look at the impact of attendance on winning, and thus future attendance, may be of importance.
ACKNOWLEDGMENTS
The author would like to thank Dr. Norman Weatherby for helping to frame this study.
There is no funding to declare in this research study.
There are no financial or non-financial conflicts of interest in this research study.
REFERENCES
1. Baade, R. A., & Tiehen, L. J. (1990). An analysis of major league baseball attendance, 1969-1987. Journal of Sport & Social Issues, 14(1), 14-32.
2. Clapp, M.C., & Hakes, J.K. (2005). How long a honeymoon? The effect of new stadiums on attendance in Major League Baseball. Journal of Sports Economics, 6(3), 237-263.
3. Davis, M. C. (2008). The interaction between baseball attendance and winning percentage: A VAR analysis. International Journal of Sport Finance, 3(1), 58-73.
4. Davis, M. C. (2009). Analyzing the relationship between team success and MLB attendance with GARCH effects. Journal of Sports Economics, 10(1), 44-58.
5. Hall, S., Szymanski, S., & Zimbalist, A.S. (2002). Testing causality between team performance and payroll: The cases of Major League Baseball and English soccer. Journal of Sports Economics, 3(2), 149-168.
6. Horowitz, I. (2007). If you play well they will come-and vice versa: Bidirectional causality in major-league baseball. Managerial & Decision Economics, 28(2), 93-105.
7. Lemke, R. J., Leonard, M., & Tlhokwane, K. (2010). Estimating attendance at Major League Baseball games for the 2007 season. Journal of Sports Economics, 11(3), 316-348.
8. Vrooman, J. (2012). Theory of the big dance: The playoff payoff in pro sports leagues. In Kahane, L.H. & Shmanske, S. (Eds), The Oxford Handbook of Sports Economics 51-76. New York, NY: Oxford University Press
9. Wiseman, F., & Chatterjee, S. (2003). Team payroll and team performance in major league baseball: 1985-2002. Economics Bulletin, 1(2), 1-10.

