Authors: Kevin Sigler and William Compton
Corresponding Author:
Kevin Sigler, PhD
601 College Road
Department of Economics and Finance
Cameron School of Business
UNC Wilmington
Wilmingtomn, NC 28403
siglerk@uncw.edu
910-200-2076
Kevin Sigler is Professor of Finance in the Cameron School of Business, UNC Wilmington
William Compton is Professor of Finance in the Cameron School of Business, UNC Wilmington
NBA Players’ Pay and Performance: What Counts?
ABSTRACT
The stars in the National Basketball Association (NBA) are paid handsomely. In the 2017-18 season Stephen Curry received over $34.7 million and LeBron James made over $33.3 million on the court. Prior studies show that players are paid for points scored, rebounds, experience, assists, blocks, field goal percentage and fouls. But the NBA is evolving. Teams over the years have gone from seldom shooting the 3-point shot to making it the focus of their offense. Analytics that first received much attention in baseball with the money ball phenomenon are now in all sports as well. This study accounts for the change in the game by not only including significant variables from prior studies but by also incorporating the 3-point shot and the Hollinger player efficiency rating (PER) in analyzing what counts in determining NBA players’ pay. The researchers find that points, player experience (years in the league), assists, rebounds and fouls are statistically significant factors when it comes to paying NBA players but we also discover that 3-point shots made and Hollinger’s PER are insignificant. In addition, the researchers perform a backward stepwise regression eliminating insignificant independent variables one at a time (least significant each time) until the model includes only significant variables. Again, the same variables are statistically significant although the statistics for the stepwise model improve over the original model.
Keywords: National Basketball Association, player pay, salary cap
INTRODUCTION
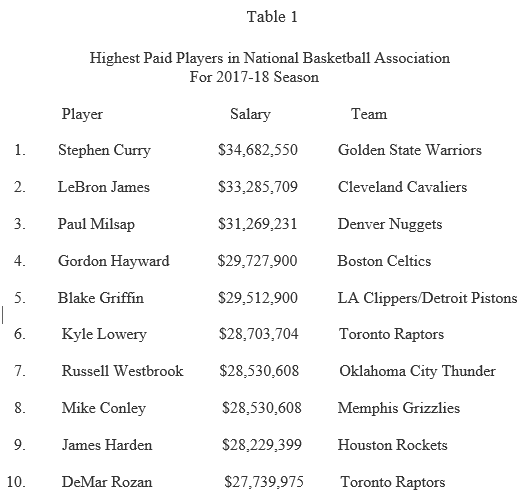
The stars in the National Basketball Association (NBA) are paid handsomely. In the 2017-18 season Stephen Curry surpassed LeBron James as the highest paid player with Curry receiving $34.7 million and LeBron close behind at $33.3 million (Table 1). In all 27 players made at least $23 million for the season. This study analyzes the statistics that matter when determining how much to pay players.
The NBA has a salary cap that places a limit on the total money that teams can spend on salaries for their players. This limit is dependent on the NBA’s total income as a league. The NBA salary cap is very flexible, however. It is termed a soft cap in that there are a number of exceptions that allow teams to go over the cap limit without penalty.
The salary cap is part of the NBA Collective Bargaining Agreement (CBA) between players and owners. The amount allowed by teams to spend on player salaries changes year to year based on the base revenue produced by the teams in the league over the season. The salary cap for the 2015-16 season was $70 million with the luxury tax applied above $84 million. For the 2016-17 season the cap was $94.14 with a luxury tax limit of $113.29 million. The cap for 2017-18 was $99 million and $119 million for the luxury tax. The luxury tax forces teams to pay a penalty to the league when they exceed the cap. The cap at which the luxury tax penalty applies is higher than the actual salary cap because the salary exceptions are included in this limit. Here are some of the exceptions (1).
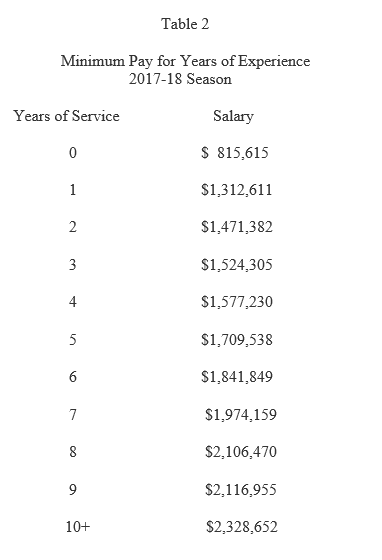
Every team can tag one of their rookies to receive a designated player extension allowing the team to offer the player a 5-year extension instead of the usual four. They can also sign their rookies to minimum scale contracts (Table 2) and it will not affect them exceeding the cap. The mid-level exception allows a team without cap room but below the luxury tax threshold to pay a player up to $8.406 million. Another exception is Bird Rights. Named for Larry Bird because he was the first player to be re-signed this way. The Bird Exception allows teams to re-sign players currently on their roster even if they exceed the cap limit in doing so. Players who qualify for Bird Rights can sign for any amount up to the maximum salary (2).
The maximum amount of salary a player can receive is based on the number of years played in the NBA and the amount of the salary cap. For example, the maximum salary of a player with six or fewer years of experience is either $25,500,000 or 25 percent of the total salary cap for 2017–18, whichever is greater. For a player with 7–9 years of experience, the maximum increases to $30,600,000 or 30 percent of the cap, and for a player with 10+ years of experience, the maximum goes to $35,700,000 or 35 percent of the cap. There is also an exception to maximum salary in that a player can sign a contract for 105 percent of his previous contract, even if the new contract is higher than the league limit (3). Teams are also allowed to re-sign their own players to supermax deals, exceeding the maximum salary. Steph Curry’s 5-year supermax contract was $70 million above the maximum.
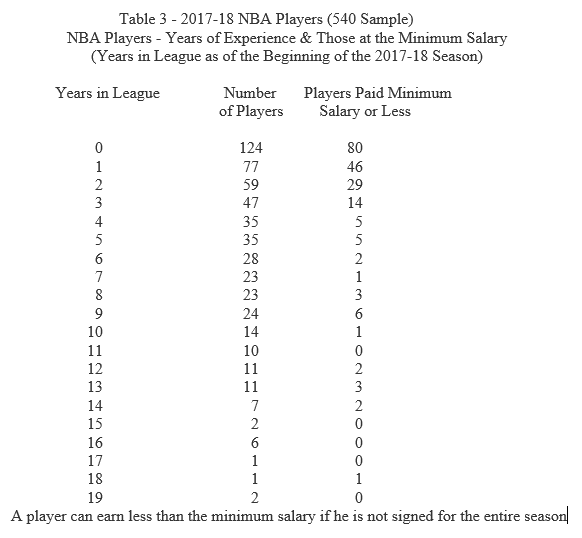
The Minimum Salary Exception allows teams to sign players for the league minimum salary for up to two years even if they are already over the cap limit. This exception also allows minimum salary players to be acquired by trade without effecting the cap. Table 2 details the league minimum salary. The rookie minimum in 2017-18 was $815,615 and increases with each year of experience. It was over $2 million for players who have been in the league for eight or more years. Table 3 breaks down the number of players in the league receiving the minimum salary by years of experience. Of the 124 rookies who received playing time and generated statistics in the 2017-18 season, 80 of them received the minimum salary or less (4). Players can make less than the minimum salary if they are not signed to contracts for the entire season. For instance, players in the G-League (the minor league for the NBA) can sign contracts for part of the season with an NBA team and receive pay for just the games or portion of the season they are on the team. Of the entire sample of 540 players, 200 of them received the minimum salary or less for the 2017-18 season.
Data and Methodology
This study investigates which statistics are significant in deciding how much of the salary cap is given to each player on the team. Lyons et al (2015) did a study for the 2013-14 season that found points per game, rebounds, personal fouls and field goal percentage are statistically significant in determining NBA players’ compensation (5). Simmons and Berri (2011) found that salaries for NBA players are driven by points scored, rebounds, blocks, and assists (6). Xu Li (2011) discovered that points and the experience of the player are significant in explaining player pay using a sample spanning from 2003-2010 (7).
In the current study, the researchers include the variables found statistically significant in prior studies and introduce two other variables that may be important in today’s NBA: 3-point shots made and Hollinger’s player efficiency rating (PER). To test the relationship of NBA salaries and player performance, the researchers collected salary and statistical information from the ESPN NBA statistics website (8). The statistics examined were points per game, rebounds per game, experience or years in the NBA, blocks per game, field goal percentage and assists per game. Each of these variables were statistically significant in explaining player salary in prior studies (5,6,7). The researchers of the current study also include 3-point attempts made per game and Hollinger’s player efficiency rating (PER) to take into account how the game has changed over the past few years.
The 3-point shot debuted in the NBA in the 1979-80 season. The idea came from the now disbanded American Basketball Association (ABA) that featured the 3-point shot. But the 3-point shot was not well accepted in the NBA at first. The New York Times’s Season Preview that year called the shot a gimmick and coaches were not fans of the shot either (9). So the 3-pointer was not heavily utilized for many years after its introduction. Teams average 0.5 3-point attempts in the 1980-81 season and the San Diego Clippers shot the most averaging 1.6. Ten years later average 3-point attempts per game in the NBA increased to 6.6 with the Cleveland Cavaliers averaging 10.6 per game. By the 2000-01 season teams were averaging 13.7 3-pointers and the Knicks led the way averaging 20.2. During the 2010-11 season the team average for 3-point attempts increased to 18.1 and the Knicks shot the most averaging 26.2.
By the 2014-15 season the 3-point shot became very popular when Golden State, featuring Steph Curry and his sharp shooting splash brother, Klay Thompson, dominated the NBA news with their 3-point shooting prowess. Golden State won the NBA Championship that year and Curry was selected Most Valuable Player (MVP) of the league (and was selected MVP the following year as well). Golden State won a record 73 regular season games in the next season (2015-16) with this same style. By the 2017-18 season, the average for 3-pointers was 27.3 per game, and Houston averaged the most with 40.3 per game (10). Five other NBA teams averaged over 30 in that season. Therefore, to account for the importance of 3-point shooting for today’s teams, the researchers include 3-point shots made per game as a variable in determining player pay.
Analytics have become such a major part of every sport, and it is true in the NBA as well. In this study, the researchers include a variable, Hollinger’s player efficiency rating (PER) statistic, which reflects such analytics. PER, created by John Hollinger, is an all in one basketball rating that attempts to account for all of a player’s contributions into one number. Using a detailed formula, Hollinger developed a system that rates every player’s statistical performance while adjusting for pace (11).
PER takes into account statistics such as field goals, free throws, 3-pointers, assists, rebounds, blocks and steals, as well as negative results, such as missed shots, turnovers and personal fouls. The formula adds positive statistics and subtracts negative ones through a statistical value system. The rating for each player is then adjusted to a per-minute basis and is also adjusted for the team’s pace or number of possessions per game. The researchers include the PER statistic as a variable to explain player pay since it is a metric that measures a player’s overall contribution to a team.
To test which statistics are significant in determining an NBA player’s salary, the researchers set up a multiple regression with player salary as the dependent variable. Salary is the compensation paid by the teams in the NBA to each player for 2017-18 season. The independent variables mentioned above include: points per game, rebounds per game, Hollinger’s PER, experience (years in the league), field goal percentage, 3-pointers made per game, assists per game, blocks per game and fouls per game for the 2017-18 season.
The researchers also perform a backward stepwise regression on the independent variables eliminating statistically insignificant variables one at a time. The variable with the highest p or most insignificant is eliminated each time until only statistically significant variables remain.
Discussion and Results
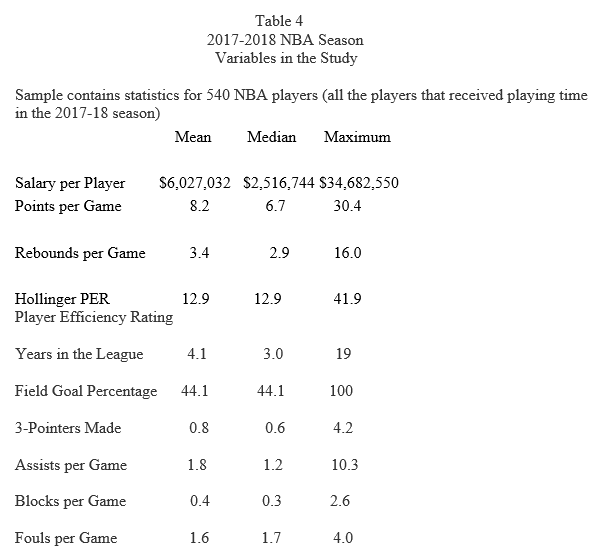
Table 4 has the summary statistics for the variables used in the study. The median salary for the sample of 540 players in 2017-18 was $2,516,744 with Steph Curry receiving the highest salary at $34,682,550. Curry also led in 3-point field goals made with an average of 4.2 per game. James Harden led the league in scoring at 30.4 points per game while Andre Drummond of the Detroit Pistons led the NBA in rebounds with an average of 16 per game. Russell Westbrook led in assists with 10.3 per game and was the only player since Oscar Robertson to average a triple double in points, assists and rebounds for a season. Russell Westbrook accomplished this for both the 2016-17 and 2017-18 seasons. There is no surprise that the very talented Anthony Davis led the NBA in blocks in 2017-18 with 2.6 per game. The average years a player was in the NBA is 4.1 years among the 540 player sample. This number is skewed since the sample is heavily weighted with young players – 124 of the 540 players in the sample are rookies and another 77 are first year players. Dirk Nowitzki and Vince Carter have the most years in the NBA at 19. The leaders in the other categories of field goal percentage, foul committed per game and the Hollinger player efficiency rating are players who saw very limited playing time.
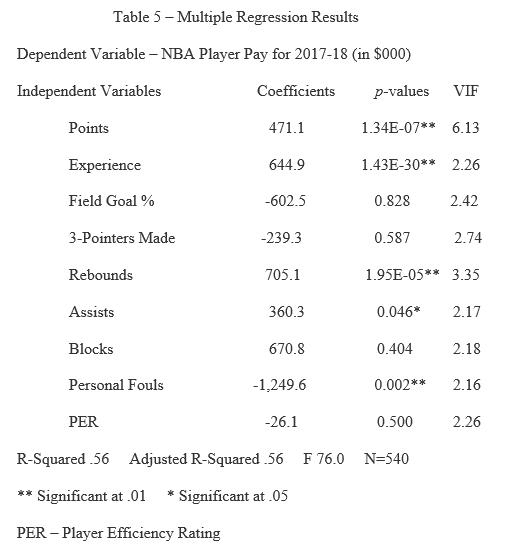
Table 5 contains multiple regression results. The analysis is conducted to determine which player statistics count when explaining pay for NBA players. The researchers screened the independent variables for multicollinearity with the variance inflation factor (VIF) test. The study assumed a VIF greater than 10 is interpreted as displaying multicollinearity (12). All variables had a VIF less than 10. The adjusted R-squared for the model was .56 and the F test statistic was 76, meaning that at least one of the independent variables was significant in explaining player compensation.
There are four variables significant at the .01 level: experience (p=1.43E-30), points (p=1.34E-07), rebounds (p=1.95E-05) and personal fouls (p=.002). Assists per game (p=.046) was significant at a .05 level. Field goal percentage, 3-pointers made, blocks and Hollinger’s player efficiency rating (PER) are insignificant in our model. Experience is the most significant variable and was similar to the findings of Xu Li (7). This result is as expected since the players who stay in the league for a long period of time are the more skilled players and, therefore, would demand a higher salary. In addition, Table 3 shows that many players make the minimum salary (200 players of the 540 in the sample) and the league minimum increases with each player’s number of years in the league. Therefore, experience, having a significant and positive relationship with player salary, is in line with expectations. The results for points are similar to the studies of Xu Li (2011), Simmons and Berry (2010) and Lyons et al (2015) showing a strong positive relationship between point scoring and the salary the player receives (7,6,5). Rebounds and assists are also positive and significant indicators of player pay just as in the studies of Simmons and Berry (2010) and Lyons et al (2015) (6,5). Fouls have a negative yet significant relationship to player compensation and is similar to the Lyons et al (2015) results (5). One explanation for this outcome is that players making less pay are possibly the less talented players on the team so are asked to foul to extend a game when a team is trailing. They may be also assigned to foul a poor foul shooter on the other team to gain an advantage. The more talented and higher paid players can then save their fouls and have the opportunity to play more minutes (players are limited to 6 fouls). In addition, the players making less salary are not concerned with fouling out since many times they are not playing the amount of extended minutes that the higher paid stars on the team are playing.
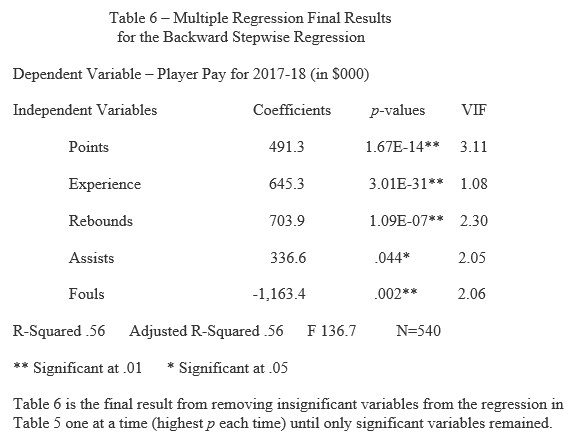
Table 6 displays the final results of a backward stepwise regression using the multiple regression from Table 5. The researchers removed one statistically insignificant variable at a time, eliminating the variable with the highest p value each time (least significant). The same five variables of points, experience, assists, rebounds and fouls are significant when using the stepwise regression approach. Each variable in Table 6, however, has a higher level of significance and the F statistic is higher as well when compared to the results of Table 5 (13).
CONCLUSIONS
Prior studies for determining significant statistics in explaining the salary for NBA players show that players are paid for points scored, rebounds, experience, assists, blocks, fouls and field goal percentage (5,6,7), but NBA basketball is evolving. Teams over the years have gone from seldom shooting 3-point shots to making it the focus of their offense. Analytics that first received much attention in baseball with the money ball phenomenon, are now in all sports as well. This study accounts for these changes in the game by not only including the significant variables from prior studies but by also incorporating the 3-point shot and Hollinger’s player efficiency rating (PER) in analyzing what counts in determining player pay. The researchers found that points, player experience (years in the league), assists, rebounds and fouls are statistically significant factors when it comes to paying NBA players but 3-point shots made and Hollinger’s PER are insignificant. In addition, the researchers perform a backward stepwise regression eliminating insignificant independent variables one at a time (least significant each time) until the model includes only significant variables. Again, the same variables: points, experience, assists, rebounds and fouls are statistically significant although the statistics for the stepwise model were superior over the original model.
APPLICATIONS IN SPORT
NBA players appear to receive salaries from their NBA teams based on their years in the league, scoring points, rebounds, and assists while fouls committed is a negative factor. Surprisingly, 3-point shooting and a more sophisticated metric for measuring performance, Hollinger’s player efficiency rating, are not found significant in explaining NBA players’ compensation for the 2017-18 season.
ACKNOWLEDGEMENTS
None
REFERENCES
1. NBA Collective Bargaining Agreement, January 19, 2017.
2. LeRoux, Danny, CBA Encyclopedia, October 2015, https://basketball.realgm.com/article/239564/CBA-Encyclopedia-Bird-Rights.
3. Han, Lucas, NBA Off-Season 2017: New Rules for Maximum Contracts, June 2017, https://www.clipsnation.com/2017/6/1/15710268/nba-la-clippers-off-season-2017-new-rules-for-maximum-contracts-options-chris-paul-and-blake-griffin.
4. 2017 CBA Minimum Annual Salary Scale, https://basketball.realgm.com/nba/info/minimum_scale.
5. Lyons, R., Jackson, E., and Livingston, A, Determinants of NBA Player Salaries, Contemporary Sports Issues, May 28, 2015, p. 1-9.
6. Simmons, R., and Berri, D., Mixing the Prince and the Paupers: Pay and Performance in the National Basketball Association, Labour Economics, Issue 3, June 2011, p. 381-388.
7. Xu Li, Is NBA Basketball Player Performance Indicative of Their Salary? Prezi.com, 2011.
8. NBA Statistics, 2017-18 Season, http://www.espn.com/nba/statistics
9. Mather, Victor, How the 3-point Shot Went from Gimmick to Game Changer, New York Times, May 1, 2016, https://www.nytimes.com/2016/01/21/sports/basketball/how-the-nba-3-point-shot-went-from-gimmick-to-game-changer.html.
10. NBA Team Statistics, https://stats.nba.com/teams/traditional/?sort=W_PCT&dir=-1&Season=2017-18&SeasonType=Regular%20Season.
11. Hollinger’s PER Formula, htpps://www.basketball-reference.com/about/per.html.
12. Mertler, C. R. and Vannetta, R. A., Advanced and Multivariate Statistical Methods: Practical Application and Interpretation, 3rd Edition, Glendale, CA: Pyrczak Publishing.
13. Mundry, R. and Nunn, C. Stepwise Model Fitting and Statistical Inference: Turning Noise into Signal Pollution, The American Naturalist, March 2008.

