Authors: Anthony Randles
Corresponding Author:
Anthony Randles, Ph.D., MPH
Education and Arts Bldg. 2239
1002 South Esther Street, P.O. Box 7111
South Bend, IN 46334-7111
Randlest@iusb.edu
574-520-4693
Anthony Randles is a Lecturer at Indiana University South Bend, School of Education, Health, Physical Education and Recreation Program
Dietary Behaviors & Perceived Nutrition Availability of Small College Student-Athletes: a Pilot Project
ABSTRACT
Purpose: The objective of this project was to investigate dietary behaviors and perceived food availability for small college student athletes.
Methods: Two-hundred seventy-two student athletes from a Midwestern urban city participated in this study. Students-athletes received an electronic consent form and a dietary survey containing question about demographics, food frequency, perceived nutrition environment and food security.
Results: The project indicated that athletes reported eating limited fruit and vegetables. Athletes also reported that fruit was available to them mostly as either “always” (41.9%) or “often” (25%) and responded that vegetables were available “always” (45.2%) or “often” (27.2%). Chi-Square indicated that there were significant differences between male and female athletes when reporting specific items.
Conclusion: There is a need for continued nutritional tracking to understand dietary habits of small-college athletes, and whether they have the available food needed for athletic and academic success. In addition, effective nutrition interventions are needed to improve dietary intake: not only for performance, but also for health.
Application in Sport: Understanding nutritional behaviors, motivators, and knowledge are essential for coaches and administrators. Tracking of dietary behaviors should allow key personnel to develop interventions for a team or identify problematic issues such as eating disorders, and injury recovery.
Keywords: Small College, Student-Athlete, Dietary Behaviors, Perceived Nutrition Availability
INTRODUCTION
One of the many challenges that college athletes experience is eating properly (1-6). The demands of daily training, along with classroom work, among student-athletes results in having higher food and fluid needs than the average college students (7-8). Eating the right food at the right time is vital for enabling student-athletes to train, compete, recover, and heal, as well as to think and learn. Nevertheless, for many student-athletes, quality of nutrition and meeting nutritional demands is not a high priority (9). Schedules are packed with class, team commitments; homework and leaves student-athletes with limited time for getting the nutrition they require. Overextended daily schedules could lead to bad dietary choices: such as choosing to eat “fast-foods” or skipping meals (8-10). Other factors, such as living situation (on or off campus), availability of healthy food and access to grocery stores could have a factor in food behaviors.
In 1991, the NCAA issued nutrition guidelines that allowed schools to feed their athletes only one training table meal per day, five days each week. In the 27 years since this rule went into effect, knowledge of sports nutrition has grown exponentially, including studies showing that college athletes have a difficult time meeting nutritional needs (1-3, 11). A 2013 study of 52 Division 1 female athletes found that 74% did not meet the minimum recommendations for carbohydrate intake, and half were not eating sufficient protein (9). Due poor nutrition among student-athletes, NCAA changed the rule in 2014 allowing student-athletes to receive unlimited meals and snacks in conjunction with their athletic participation.
The evidence is growing that collegiate athletes practice poor nutrition behaviors (4-5, 9); however, the majority of these studies were conducted in large university setting or NCAA DI schools (1-6, 9, 11). There is limited information for small college (≤5,000 enrolled student or ≤ 500 student living on campus) program athletes. The National Association of Intercollegiate Athletics (NAIA) is a governing body of 250 small athletics programs with about 65,000 intercollegiate athletes (12). Sufficient nutrient intake is essential for not only maintaining good health and nutritional status of these young people but also for maximizing their athletic potential (9, 13). Even though NAIA athletes tend not to be recruited at professional levels, they are still similar to NCAA athletes: balance practice times with class and social engagements and may be vulnerable to nutrition related issues, more so amongst women (9, 14, 15). Despite these similarities, little is known about the dietary behaviors of smaller college student-athlete.
Student athletes, no matter which level of competition, with poor diets could be at high risk of injury (16). The continued development of muscles, bones, and brain are all strongly influenced by nutrition (17). To understand dietary behaviors of small college athletes further, the investigator sought to investigate the nutritional behaviors and perceived nutritional barriers of small college student-athletes. By administering a dietary questionnaire, the study examined dietary behaviors and perceived nutrition availability of NAIA student athletes. The following research objectives were used to guide the project:
[RO 1] To assess dietary behavior among of a cohort of NAIA male and female collegiate athletes.
[RO 2] To assess perceived access to nutritional resources within the cohort.
[RO 3] Examine gender differences in dietary behaviors and perceived access to nutritional resources.
[RO 4] Identify groups of athletes at risk for food insecurity. (This objective is reported elsewhere).
METHODS
Recruitment and procedures
This study utilized a sample of college athletes from two NAIA universities in a Midwestern state of the United States. Athletic Directors were directly contacted to explain the nature and details of the study. Athletic directors assisted with recruitment of participants from their athletic teams from February 2017 to April 2017. Athletes received three email invitations during the data collection period. The first email was to introduce and recruit participants and the subsequent two other emails were for follow-up and further recruitment. After the athlete consented electronically, they were directed to an electronic questionnaire. The inclusion criteria for the study included being a member of a university varsity team and 18 years or older. Both university athletic departments and institutional review boards reviewed and approved study protocols before student contact and data collection began.
Research instrument
A 45-item nutritional survey was compiled from two national survey instruments. Dietary behaviors and perceived nutrition availability were assessed using elements of the FLASHE adolescent dietary survey instrument, a web-based survey that has demonstrated validity in adolescents age 12-17 (18). Modification of questions took place to accommodate the study population. To maintain the face and content validity of the specific questions, two-research dietitians reviewed the modified questions. The survey included questions over a variety of nutritional practices such as food frequency (“during past 7 days, how many times did you drink”), dining out (“frequency per week” and “type of restaurant”), availability of foods, (i.e., “how often are the following foods and drinks available in your home or campus food service area?”), if student-athletes were able to afford the food they needed, (i.e. “The food I bought just didn’t last and I didn’t have money to get more?”), demographic characterisitics and height and weight. Calculation of BMI was completed from self-reported height (inches) and weight (lbs.).
The presence of hunger continues to be a challenge for U.S. health, nutrition, and social policy. Often overlooked are the material conditions of college students lives, especially when it comes to nutrition (21). A study by Broton and Goldrick-Rab (2017), reported that data from more than 30,000 two- and 4-year college student indicated that half are food insecure, “limited or uncertain availability of nutritionally adequate and safe foods or limited or uncertain ability to acquire acceptable foods in socially acceptable ways’’(19). To begin to understanding food security among student-athletes, a 6-item (short form) 12-month Food Security Scale developed at the National Center for Health Statistics were included in the research instrument (reported elsewhere) (20).
STATISTICAL ANALYSIS
The investigator used means, standard deviations, and frequencies to describe the characteristics of the sample. Evaluation of survey questions were conducted by running a descriptive analysis and using χ2 statistic to test for differences between male and female student athletes. All statistical analyses were conducted using SPSS v. 24 (IBM, Armonk, New York, USA), with the level of the significants set at p < .05 unless otherwise noted. Question about perceived food security and availability will be reported elsewhere.
RESULTS
Student Athlete characteristics
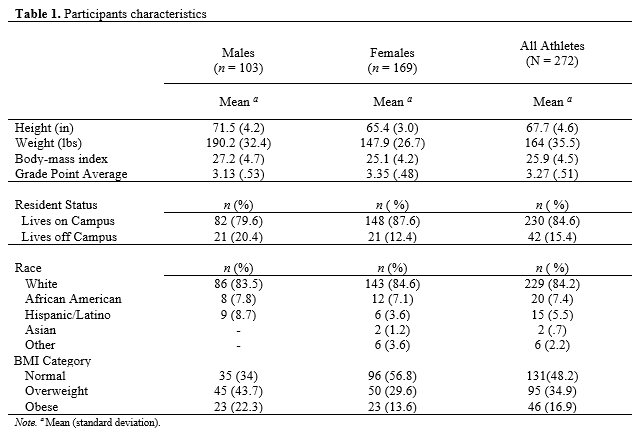
One hundred sixty-nine females athletes (62.1%) and 103 (37.8%), male athletes completed the survey with a total of 272 student athletes completing the survey. Twenty-one participants being excluded from the final analyses because of technical issues with the electronic survey. The demographic characteristics of the sample are presented in Table 1. The sample consisted of indoor/outdoor track and field athletes and cross-country runners (22.8%), basketball players (16.2%), softball players (10.3%), lacrosse players (10.3%), baseball players (8.8%), rugby players (5.5%), volleyball players (5.1%), golfers (4.8%), tennis players (3.7%), and competitive cheer and dance (2.2%). The majority of participants reported as Caucasians (84.2%); Black or African-American (7.4%); Hispanic or Latino (5.5%); other (2.2%) or Asian (.7). The mean BMI for all athletes was 25.9 (SD=4.5), making the average student athlete in this study overweight. Male athletes were more likely to be categorized as overweight (43.7%) or obese (22.3%).
Fruit and vegetable question responses
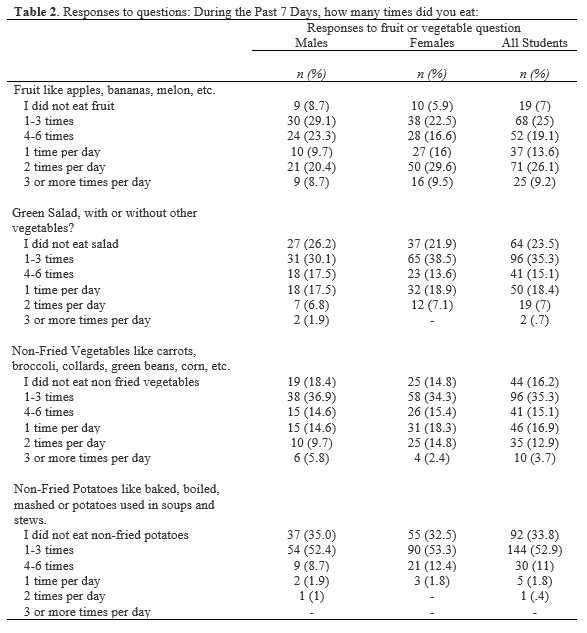
Among all athletes surveyed, 9% reported eating any fruit 3 or more times per day during past 7 days for male-athletes (29.1%) and 2-times per day during the past 7 days for female-athletes (29.6%). About four percent of participants reported eating non-fried vegetables and less than one percent reported eating green salad, with or without other vegetables three or more times per day during the past seven days. The most common response for both male (30.1%) and female (38.5%) athletes were reporting eating green salad 1-3 time per week, the same for non-fried vegetable (male-athletes 36.9% vs. female-athletes 34.3%). Table 2 shows response categories among all participants and men vs. women for fruit and vegetable related questions.
Protein and fat question responses
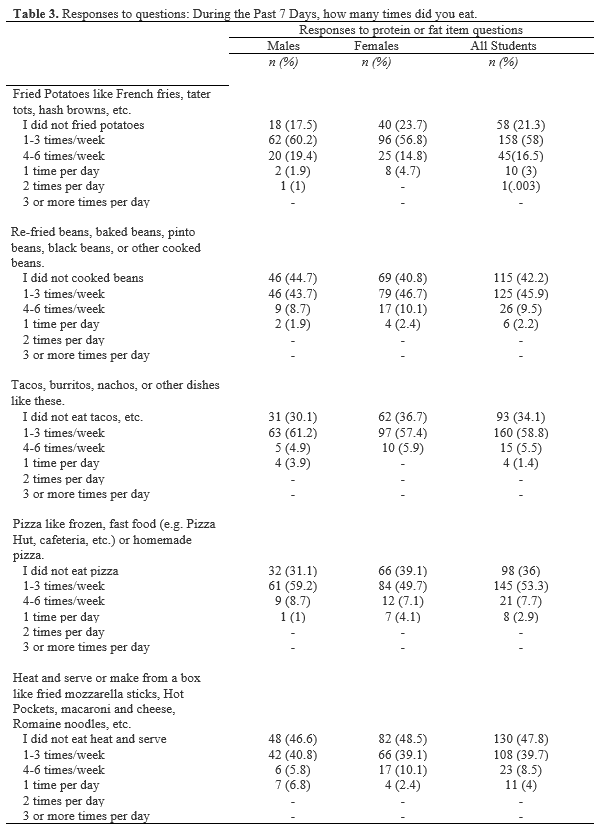
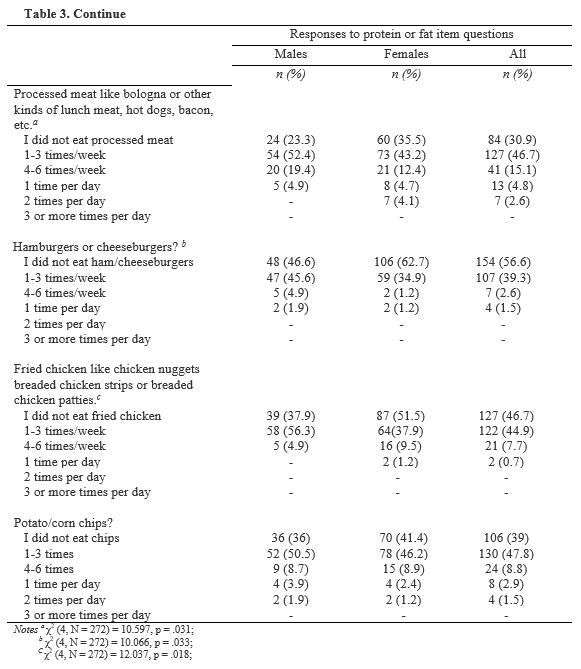
When comparing male vs. female responses about proteins and fats questions (Table 3), there were significant differences in how athletes responded to questions. About Forty-five percent of all athletes reported eating fried chicken items 1-3 times per week with 56.3% of male-athletes reported eating fried chicken like items 1-3 time per week compared to only 34.9% for female athletes, χ2 (4) = 10.066, p = .033. Processed meats also had similar responses, 46.7% of student-athletes reported eating processed meats 1-3 time per week. Fifty-two percent of male-athletes reported eating processed meats 1-3 time per week vs. 43.2% for female-athletes: χ2 (4) = 10.597, p = .031. Finally, 39.3% of student-athletes reported eating hamburgers/cheeseburgers 1-3 times per week during the last seven days. Forty-five percent of male-athletes reported eating hamburgers/cheeseburgers 1-3 times per week vs. 34.9% of female-athletes, χ2 (4) = 10.066, p = .033. As a whole, tacos, burritos, nachos, or other like dishes (58.8%), and fried potatoes (58%) were the most commonly reported food eaten at 1-3 days per week during a 7-day period.
Sweets and candy question responses
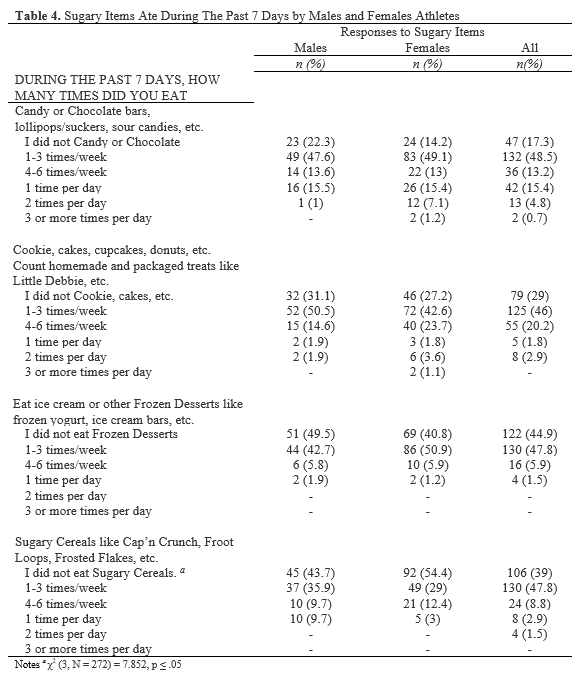
Student-athletes reported limited consumption of sweets and candies, data reported in Table 4. Forty-eight percent of athletes reported eating Candy or Chocolate bars, lollipops/suckers, etc. 1-3 time per week. Cookies, cakes, cupcakes, donuts were similar, with 46% reporting eating these items “1-3 times per week” in the last seven days. Frozen desserts like ice cream were most reported (47.8%) at “1-3 time per week” in the last seven days (note: the survey took place during the coldest months of winter in Northern Indiana, which may affect response category.)
Out of the four questions that pertained to sweet food items, Sugary Cereals (i.e., Cap n” Crunch, Froot Loops, Frosted Flakes), was the only question to reject the null hypothesis between genders, χ2 (3) = 7.852, p ≤ .05. Thirty-five percent of male athletes reported eating sugary cereal 1-3 times per week, while 29% of female athletes reported eating sugary cereal 1-3 times per week.
Beverage question responses
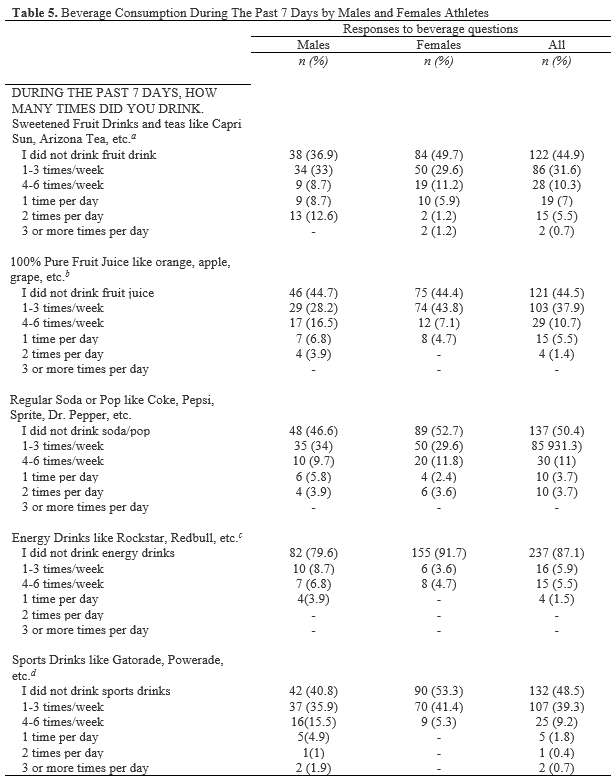
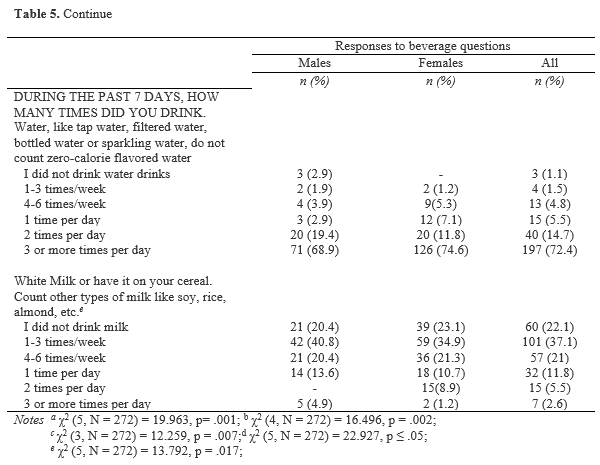
Responses to question about beverages consumption are presented in Table 5. The most common beverage consumed among the cohort was water. Over 70% of student athletes reported that in the last 7-days they drank water “3 or more times a day”. Energy drinks were the least consumed, reported by 87.1% of athletes, “I did not drink energy drinks” during the past seven days. However, there were differences between male and female athletes on how they answered the question, χ2 (3) = 12.259, p = .007. The beverage category had the most significant differences between male and female athletes: sweetened fruit drinks, and teas (χ2 (5) = 19.963, p = .001), 100% pure fruit juice (χ2 (4) = 16.496, p = .002), sports drinks like Gatorade (χ2 (5) = 22.927, p ≤ .05), and white milk (χ2 (5) = 13.792, p = .017).
Perceived Food Availability
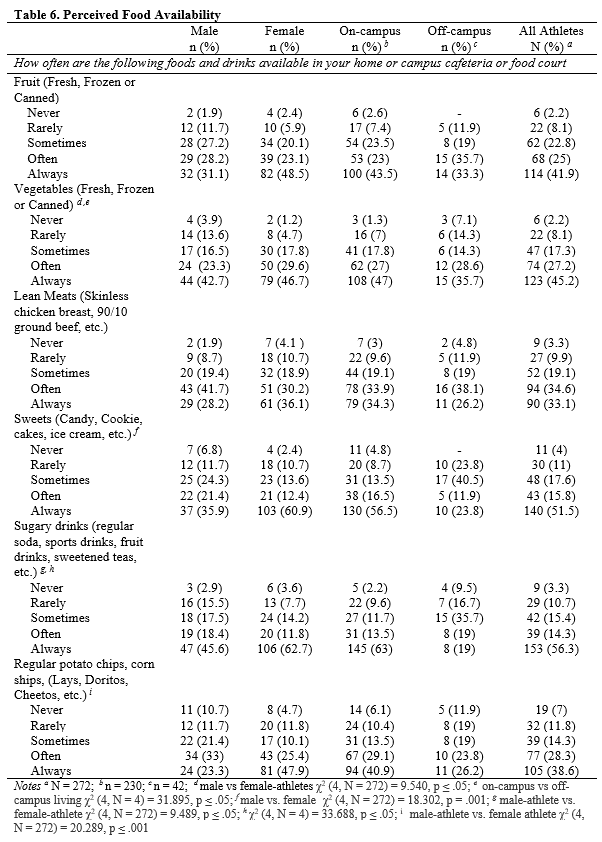
Many factors affect food selection, one of which is availability (19). The setting where athletes acquire food, such as campus dining halls, food courts, etc., could influence behavior. The perceived food environment could influence the types of food and beverage athletes select and any other barrier or opportunities for consumptions of a healthy diet (19). Student-athletes were asked six question over the perceived availability of foods, Table 7. The first item, fruit (fresh, frozen or canned) was reported to be always available by 41.9% of all student-athletes. Vegetables (fresh, frozen or canned) were reported always available by 45.2% of student-athletes. Lean meats (skinless chicken breast, 90/10 ground beef, other lean cuts of beef, pork or lamb) were reported as often available by 34.6% of all student-athletes. Sweets (candy, cookies, cakes, ice cream, etc.) were reported as always available by 51.5% of student-athletes. Sugary drinks (regular soda, sports drinks, fruit drinks, sweetened teas, iced coffee, etc.) were reported as always available by 56.3% of student-athletes. Finally, regular potato chips, corn ships, or cheese puffs (Lays, Doritos, Cheetos, etc.) were reported by 38.6% of student-athletes.
The investigator conducted a Chi-Square test to look for a difference of response between male vs. female-athletes and on-campus vs. off-campus housed athletes as it pertained to perceived availability of food items, Table 6. Male- and female-athletes reported differences in perceived vegetable availability. Forty-two percent of male-athletes reported that vegetables were always available compared to 46.7% of female-athletes, χ2 (4, N = 272) = 9.540, p ≤ .05. For fruit, even though there was not a significant difference, 31.1% of male students reported ‘always’ available vs. 48.5% of female athletes.
Off-campus housing student-athletes reported that fruit was always available 33.3% compared to 43.5% of on-campus housing student-athletes. There was a significant difference in the responses to the availability of vegetables between the two groups. Thirty-five percent of off-campus housing student-athletes reported the vegetables were always available vs. 47% of on-campus housing students, χ2 (4, N = 4) = 31.895, p ≤ .05.
There was also a significant difference in reporting the availability sugary drinks (regular soda pop, sports drinks, fruit drinks, sweetened teas, etc.) between on and off-campus housing athletes. Nineteen percent of off-campus housing athletes reported sugary drink always available vs. 63% of on-campus athletes, χ2 (4, N = 4) = 33.688, p ≤ .05.
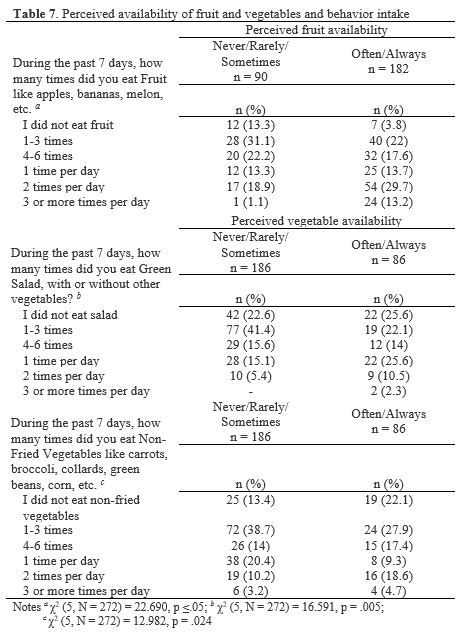
The investigator final analysis was to conduct a chi-square test to look for differences in fruit and vegetable behavioral responses based on categorical answers to perceived availability of fruit and vegetables, reported in Table 7. Categorical responses to fruit and vegetable availability were grouped to form two groups: Group 1-Never/Rarely/Somethings (n = 90) and Group 2-Often/Always (n = 182). Based on these groupings, the investigator conducted the chi-square test over how the groups answered the following questions:
- During the past 7 days, how many times did you eat fruit like apples, bananas, melon, etc.?
- During the past 7 days, how many times did you eat green salad, with or without other vegetables?
- During the past 7 days, how many times did you eat non-fried vegetables like carrots, broccoli, collards, green beans, corn, etc.?
The most common response to ‘During the past 7 days, how many times did you eat Fruit like apples, bananas, melon, etc.?´ for Group 1 was 29.7% reported “4-6 times per week” vs Group 2, 29.7% reporting “2-time per day”, χ2 (5, N = 272) = 22.690, p ≤ .05. For question 2, ‘During the past 7 days, how many times did you eat Green Salad, with or without other vegetables?’ Group 1’s most commonly report answer was 1”-3 times per week” at 41.4% vs. Groups 2’s most commonly reported answer of “1 time per day” at 25.6%: χ2 (5, N = 272) = 16.591, p = .005. Finally, for question 3, ’ During the past 7 days, how many times did you eat Non-Fried Vegetables like carrots, broccoli, collards, green beans, corn, etc.?´ 38.7% of Group 1 responded “1-3 time per week” vs. 27.9% of Group 2’s most common response of “2 times per day” during the past 7 days:18.6%: χ2 (5, N = 272) = 12.982, p = .024.
LIMITATIONS
With a dietary questionnaire, the current study identified important nutritional behavior trends in a sample of NAIA student athletes. However, limitations need noting. First, this study only utilized a questionnaire. The use of a dietary recall method in conjunction with the survey could have helped capture detailed information about all foods and beverages consumed and frequency of meals by the respondents. Second, the study is limited by the use of a relatively small sample of athletes. The process of recruitment could have contributed to this factor. Recruitment of student-athletes was by email only, and other methods of recruitment could have improved participation. Although statically significant, the differences between male and female athletes could have been influenced by a variety of factors. Third, given the nature of the sample, it is possible that the student athletes that participated in this study had an interest in nutrition and health. Thus, the findings may not represent dietary behaviors of others and cannot be generalized to NAIA study-athletes. Therefore, it is warranted that further research utilizing multiple methods or a larger population of NAIA student athletes is needed to explore dietary behaviors further.
CONCLUSION
The results of this study shows the importance of evaluating dietary habits of small college athletes. The athletes in the study reported limited fruit and vegetable intake. When comparing responses between genders proportionally, female athletes appear to respond more favorably to questions. However, based on overall food frequency responses, the athletes in this study do not appear to be consuming adequate nutrition to benefit athletic performance, recovery and overall health. Coaches, athletic trainers, and university/college wellness personnel should be aware of these diet related problems. Poor dietary practices can hinder the quality of training, recovery and the overall health of the athlete.
The study provided empirical evidence that availability of specific food items could affect consumption. This study shows that those students who perceived their availability of fruit and vegetables as ‘always’ or ‘often’ available reported consuming fruits and vegetables more often. Although a pilot investigation, the study findings are similar to like studies that investigated the availability of fruit and vegetable within the home environment (20-25). When fruits and vegetables are readily available, it is likely to influence dietary behaviors (26).
Student athletes dietary studies conducted on NCAA D1 campuses may not be appropriate to represent smaller college student athletes. Although the NCAA allows for unlimited meals and snacks for D1 students, smaller colleges may not have the budget to provide unlimited meals for their athletes; therefore, understanding not only dietary behaviors and availability is important in among this group.
APPLICATIONS IN SPORT
Maintaining a healthy and balanced diet is critical for all student athletes. Diet can not only reduce the risk of disease but increase health gains and improve performance. Understanding nutritional behaviors, motivators, and knowledge are essential for coaches and administrators to consider. Tracking of dietary behaviors should allow key personal to develop intervention for a team or identify problematic issues such as eating disorders. We should not assume that evaluation from one level of competition is representative of all; resources vary from university to university. A more comprehensive study among small college athletes is warranted. Understanding the dietary behaviors of this population will help colleges and universities identify where they can improve their services not only for student athletes but also for all students. It will also help other athletic organization develop intervention that are more suited for their universities and colleges, whom they have a direct relationship.
ACKNOWLEDGMENTS
None
REFERENCES
1. Burns, R. D., Schiller, M. R., Merrick, M. A., & Wolf, K. N. (2004). Intercollegiate
student-athlete use of nutritional supplements and the role of athletic trainers and dietitians in nutrition counseling. Journal of the American Dietetic Association, 104(2), 246-249.
2. Clark, M., Reed, D. B., Crouse, S. F., & Armstrong, R. B. (2003). Pre-and post-season dietary intake, body composition, and performance indices of NCAA Division I female soccer players. International journal of sports nutrition and exercise metabolism, 13(3), 303-319.
3. Cole, C. R., Salvaterra, G. F., Davis Jr, J. E., & Borja, M. E. (2005). Evaluation of dietary practices of National Collegiate Athletic Association Division I football players. Journal of Strength and Conditioning Research, 19(3), 490.
4. Hinton, P. S., Sanford, T. C., Davidson, M. M., Yakushko, O. F., & Beck, N. C. (2004). Nutrient intakes and dietary behaviors of male and female collegiate athletes. International Journal of Sports Nutrition and Exercise Metabolism, 14(4), 389-405.
5. Hoogenboom, B. J., Morris, J., Morris, C., & Schaefer, K. (2009). Nutritional knowledge and eating behaviors of female, collegiate swimmers. North American journal of sports physical therapy: NAJSPT, 4(3), 139.
6. Jacobson, B. H., Sobonya, C., & Ransone, J. (2001). Nutrition practices and knowledge of college varsity athletes: a follow-up. The Journal of Strength & Conditioning Research, 15(1), 63-68.
7. American College of Sports Medicine, & American Dietetic Association. (2000). Joint Position Statement: nutrition and athletic performance. American College of Sports Medicine, American Dietetic Association, and Dietitians of Canada. Medicine and Science in Sports and Exercise, 32(12), 2130.
8. Oh, A, Davis, T, Dwyer, L, Hennessy, E, Li, T, Yaroch, A, & Neneling, L (2017). Recruitment, enrollment, and response of parent-adolescent dyads in the FLASHE study. American Journal of Preventive Medicine, 52(6), 849-855.
9. Shriver, L. H., Betts, N. M., & Wollenberg, G. (2013). Dietary intakes and eating habits of college athletes: are female college athletes following the current sports nutrition standards?. Journal of American College Health, 61(1), 10-16.
10. Zawila, L. G., Steib, C. S. M., & Hoogenboom, B. (2003). The female collegiate cross-country runner: nutritional knowledge and attitudes. Journal of athletic training, 38(1), 67.
11. Rash, C. L., Malinauskas, B. M., Duffrin, M. W., Barber-Heidal, K., & Overton, R. F. (2008). Nutrition-related knowledge, attitude, and dietary intake of college track athletes. Sports J, 11(1), 48-55.
12. National Association of Intercollegiate Athletics (2017). About the NAIA. Retrieved on 10/18/2017 from http://www.naia.org/ViewArticle.dbml?DB_OEM_ID=27900&ATCLID=205323019
13. Garcin, M., Doussot, L., Mille-Hamard, L., & Billat, V. (2009). Athletes’ dietary intake was closer to French RDA’s than those of young sedentary counterparts. Nutrition research, 29(10), 736-742.
14. Aerenhouts, D., Hebbelinck, M., Poortmans, J. R., & Clarys, P. (2008). Nutritional habits of Flemish adolescent sprint athletes. International Journal of Sports Nutrition and Exercise Metabolism, 18(5), 509-523.
15. Burke, L. M., Kiens, B., & Ivy, J. L. (2004). Carbohydrates and fat for training and recovery. Journal of sports sciences, 22(1), 15-30.
16. Tipton, K. D. (2015). Nutritional support for exercise-induced injuries. Sports Medicine, 45(1), 93-104.
17. Meeusen, R (2014). Exercise, nutrition, and the brain. Sports Medicine, 44(1), 47-56.
18. Nebeling, L. C., Hennessy, E., Oh, A. Y., Dwyer, L. A., Patrick, H., Blanck, H. M., & Yaroch, A. L. (2017). The FLASHE study: survey development, dyadic perspectives, and participant characteristics. American journal of preventive medicine, 52(6), 839-848.
19. Franklin, B., Jones, A., Love, D., Puckett, S., Macklin, J., & White-Means, S. (2012). Exploring mediators of food insecurity and obesity: a review of recent literature. Journal of community health, 37(1), 253-264.
20. Broton, K. M., & Goldrick-Rab, S. (2017). Going Without: An Exploration of Food and Housing Insecurity Among Undergraduates. Educational Researcher, 0013189X17741303.
21. Hamilton W & Briefel R (1999). The effectiveness of a short form of the household food security scale. American Journal of Public Health, vol. 89, pp. 1231-34.
22. Pearson, N., Biddle, S. J., & Gorely, T. (2009). Family correlates of fruit and vegetable consumption in children and adolescents: a systematic review. Public health nutrition, 12(2), 267-283.
23. Van Der Horst, K., Oenema, A., Ferreira, I., Wendel-Vos, W., Giskes, K., van Lenthe, F., & Brug, J. (2006). A systematic review of environmental correlates of obesity-related dietary behaviors in youth. Health education research, 22(2), 203-226.
24. Rasmussen, M., Krølner, R., Klepp, K. I., Lytle, L., Brug, J., Bere, E., & Due, P. (2006). Determinants of fruit and vegetable consumption among children and adolescents: a review of the literature. Part I: quantitative studies. International Journal of Behavioral Nutrition and Physical Activity, 3(1), 22.
25. Ziegler, P. J., Jonnalagadda, S. S., Nelson, J. A., Lawrence, C., & Baciak, B. (2002). Contribution of meals and snacks to nutrient intake of male and female elite figure skaters during peak competitive season. Journal of the American College of Nutrition, 21(2), 114-119.
26. Campbell, K. J., Crawford, D. A., & Hesketh, K. D. (2006). Australian parents’ views on their 5–6-year-old children’s food choices. Health promotion international, 22(1), 11-18.

