Authors: Thomas T. Byrnes (1) and Joseph Anthony Farinella, Ph.D.*(2)
(1) Thomas Byrnes is a graduate from the Honors College at the University of North Carolina Wilmington. Mr. Byrnes is currently working as a financial advisor.
(2) Joseph Farinella is an Associate Professor of Finance at the University of North Carolina Wilmington. Dr. Farinella is also a Chartered Financial Analyst and consultant.
*Corresponding Author:
Joseph Anthony Farinella, Ph.D.
University of North Carolina Wilmington
Department of Economics and Finance
601 South College Road
Wilmington, NC 28409
farinellaj@uncw.edu
ABSTRACT
The notion of “momentum” and its effect on the outcome of sports games has been a point of contention for decades. This paper tests if a simple betting strategy based on momentum can be used to generate a consistent profit. The momentum strategy is applied to the National Basketball Association; we examine 30 teams spanning the 2001-2013 seasons. The results show that the momentum strategy generates a significant profit over this period. The momentum strategy is often referred to as the hot hand strategy. The strategy requires betting on teams to win that are already on a hot streak of at least four games, while betting on teams to lose that are already on a cold streak of at least four games. The results show that the momentum betting strategy yields an average overall winning percentage of 56.5%, which is significantly above the 52.4% required to break-even.
KEYWORDS: Sports wagering, Market efficiency, Momentum
INTRODUCTION
According to the 1999 National Gambling Impact Study Commission’s report, there is a total of $80 billion – $380 billion wagered on sports each year. This figure includes legal and illegal wagering. The large range is due to the difficulty of measuring the size of the illegal wagering market. The fact remains that wagering on sports is a huge market. The commissioner of the NBA, (Mr. Adam Silver) has advocated for the legalization of sports gambling in America.
In general, it is very difficult to find a betting strategy that is profitable. However, there may be a few strategies that can generate a profitable return. The existence of momentum and its effect on sports games has been examined in the popular press and academia over the past three decades. While there is a general consensus amongst scholars that momentum has no impact on the outcome of games, fans, players and coaches are still heavily influenced by the perception of player or team momentum. Coaches frequently make personnel decisions, players distribute the ball, and fans make betting decisions based on which team is hot.
This paper sets out to explore the relationship between the perception of the hot team, its influence on the point spread betting lines of NBA basketball games, and the possible market inefficiency created by either an overreaction or under reaction to a hot or cold streak. Are there consistent, significant, profitable returns to be made betting with the hot hand? We find evidence supporting momentum in the NBA, specifically, betting with the hot team, and against the cold team generates a statistically significant profit.
This study examines the National Basketball Association as the context for its research into the public’s reaction to a perceived momentum effect for two main reasons. The NBA encompasses 29 basketball franchises (30 after the Charlotte Bobcats – who later became the Hornets – were added in 2004 as an expansion team) that play 82 games a season. We examine data from 13 NBA seasons (2001-2013) for each team which results in a total of 32,000 data points. A log likelihood function is employed to test the statistical significance of the results.
Along with the available data, the National Basketball Association point spread betting market is also ideal for this study due to the schedule of games. NBA franchises typically play three games per week, over the course of the season. It is a common sentiment of the believers in momentum’s existence that the closer in time proximity with which the events occur, the more likely previous success is to breed success and previous failure is to breed failure. The NBA schedule fosters this concept of recency, and is the ideal breeding ground for a “hot” or “cold” streak. Furthermore, NBA teams typically start the same lineup every game and substitute the same players much unlike baseball, where a pitchers work on a rotation and players are substituted on a day by day basis.
THE POINT SPREAD BETTING MARKET
Understanding the point spread betting market is quite simple. Assume that the betting line on an upcoming divisional game between the Miami Heat and the Washington Wizards is Washington minus 5. This means that the Wizards are favored to win by five points, and a bet on the Wizards pays out if the Wizards win by more than 5 points. Conversely, a bet on the Heat pays out if the Heat win OR if the Heat lose by less than 5 points. If the Wizards win by exactly 5 points, the game is considered a “push,” and money bet on the line is refunded.

Point spread betting is traditionally wagered 11 for 10, meaning that a bettor must wager 11 dollars to make ten; that is, someone who bets $110 and wins will walk home with $210: the $110 he or she wagered plus the $100 in winnings. Therefore, bettors must win 52.4 percent of their bets to break-even . The eleven for ten bet is designed to provide the bookmakers with a 10 percent commission on each bet placed, frequently referred to as the vigorish or juice.
Once a betting line is posted, betting begins in Las Vegas and across the country on Nevada-based gambling websites. As bets begin to roll in, the betting line may move. New information, such as player injuries will also change the betting line leading up to the start of the game. Irrational betting trends also will affect the line after it has been announced, as bettors react to movements in the betting line rather than information about the matchup. Once the game begins all betting is stopped and the current spread is known as the closed line.
EXISTING LITERATURE
Gilovich, Vallone and Tversky (1985) were the first to study the belief that a series of made shots increases a player’s chance of making his or her next shot. This concept known as the hot hand would become the starting point for a myriad of research into the effect of perceived momentum on sports games and eventually, sports betting. The author’s survey unequivocally revealed that fans believe in streak shooting: over ninety percent believed that a player “has a better chance of making a shot after just having made his last two or three shots than he does after having just missed his last two or three shots.” The results do not support the existence of a hot hand. They showed that both field goal and free throw attempts were largely independent of the outcome of the previous attempt, and that while the basketball world perceives the existence of the hot hand, it does not have any effect on the outcome of games or on player performance.
Gandar etc. (1988) examines the momentum (hot hand) strategy applied to the National Football League’s (NFL) point spread betting market from 1980 – 1985. The statistical tests show that no significant bias is found in the opening or closing betting lines. During this period, there are no opportunities for consistent positive returns by implementing a momentum betting strategy in on NFL teams.
Camerer (1989) studies the results of NBA games from 1983 – 1986. The author finds that the point spread line is impacted by momentum but the outcome of the game is not. Accordingly, betting against teams on winning streaks would be a profitable strategy. The results show that teams on “winning streaks” were somewhat overvalued and teams on “losing streaks” were somewhat undervalued. However, the market’s error is too small to be profitably exploited.
Brown and Sauer (1993) provide an extension of the Camerer study and utilize a different methodology. The authors find that both the point spread market and the outcome of the game respond to momentum. They could not reject the impact that momentum has on the betting line and outcome of the game.
Paul and Weinbach (2005) examine potential over betting on large favorites and the hot hand. The authors examine the NBA point spread gambling market from 1995 – 2002. They find evidence supporting the over betting of large favorites. Accordingly, a strategy of betting large underdogs is profitable. The authors also find that betting against winning streaks is profitable. The authors define a winning streak in two ways: if the team wins two or more games and if the team wins four or more games. The results do not support the momentum betting strategy. In fact, they find that betting against momentum is profitable
Arkes and Martinez (2011) examine NBA data over three seasons from 2007 – 2009 to determine if momentum exists. They create a model that controls for team and opponent strength, home vs. away games and days rested. The authors find that momentum exists in the NBA. After controlling for strength, location and days rested; the authors find that a team on a winning streak has a higher probability of winning the next game. Likewise, poor play over the past few games leads to a lower probability of winning the next game. Many streaks can and should still be attributed to randomness, however some periods of strong performance are partly due to a momentum effect – a result of confidence, belief, etc. that an expected outcome will happen.
In a separate study, Arkes (2011) finds evidence that there is a momentum effect, as success in the previous games has a positive, statistically significant effect on the team’s performance. Gamblers overstate the importance of momentum which creates a mis-pricing in the point spread market. However, the mis-pricing is not large enough to generate a profit opportunity.

Notes: The log likelihood test statistic have a chi-square distribution with one degree of freedom. Critical Values are 2.706 (for an α = 0.10), 3.841 (for α = 0.05), and 6.635 (for α = 0.01). * indicates a significance at the 10 percent level of confidence, ** indicates significance at the 5 percent level and *** indicates significance at the 1 percent level.
METHODS
The data for this study is collected from Covers (www.covers.com), a sports betting site that provides historical information on all 29 NBA teams (30 after the Charlotte Bobcats were added as an expansion team in 2004) from all the seasons spanning 2001-2013. Statistics such as the date, opponent, outcome, spread, and outcome against the spread were collected. The next step is to isolate all the runs that occurred within the time period, whether they are winning or losing streaks. A streak is considered as such if a team had won (lost) four or more games. Our betting strategy would begin with the 5th game in the streak, under the assumption that the better cannot know a streak will occur until the subject team has won (lost) their 4th game, thus they will begin betting on the 5th game in the run. Four games is selected because it is a long enough run to attribute success or failure to a potential momentum effect, rather than randomness.
The momentum betting strategy is followed until the streak ceases, including the game after the winning (losing) streak had ended. Again, this decision was made assuming the bettor is gambling in real time, and has no idea when the streak might end, and thus he will bet on the game at which the run comes to a stop.
Bets were given a “1” and considered a “win” in our data sheet if a team on a winning streak won against the spread while they were on a winning streak, or lost against the spread while they were on a losing streak. In the event of a push at a betting house, the money is returned to the bettors; neither the gambler nor the betting house have a lost or gain. For this reason, all pushes are nonevents, and were considered neither a win nor a loss.
RESULTS
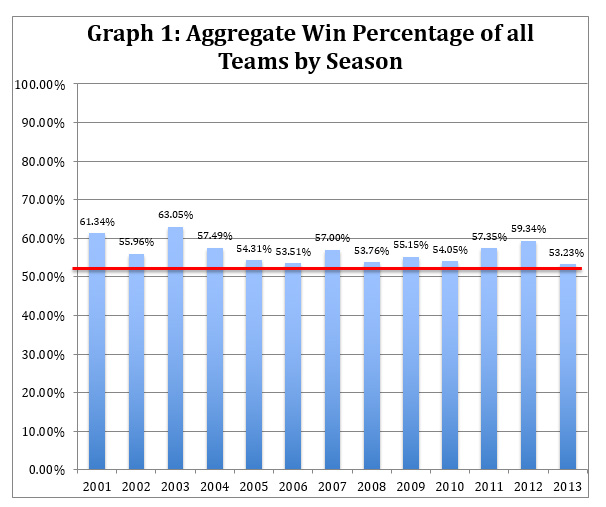
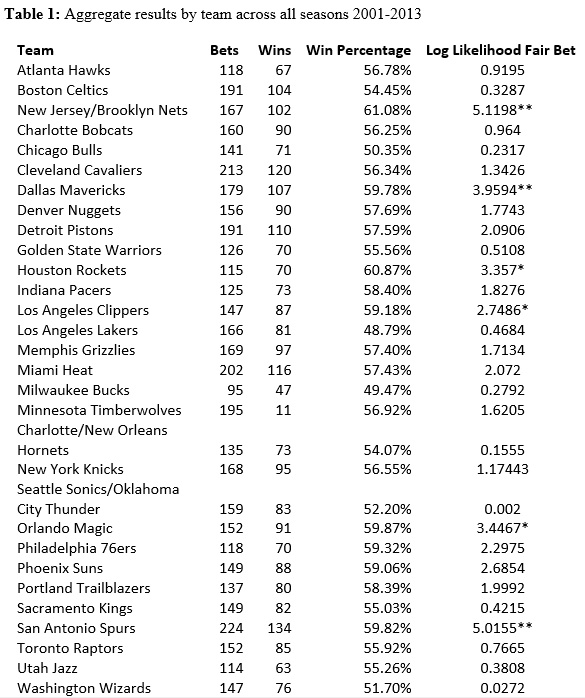
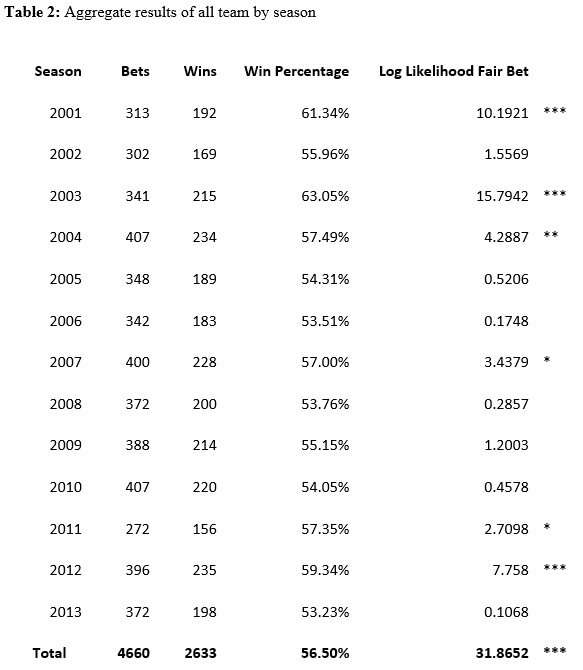
Our results show that applying the momentum strategy to the NBA is profitable. Specifically, by betting on a winning team to beat the spread and a losing team to lose against the spread, the bettor will win 56.5% of the time – a profitable winning percentage. Furthermore, every single season studied produced a winning percentage greater than 50%, with the most impressive being the 2003 at a 63.05% winning percentage (see Graph 1). Even more significant is that every season produced a winning percentage over the 52.4% threshold, the amount of wins needed to break even considering the vigorish. Team winning percentages followed suit, with only a handful of outlier teams failing to break the 52.4% threshold. The team results can be found in Table 1, and season results are provided in Table 2.

Notes: The log likelihood test statistic have a chi-square distribution with one degree of freedom. Critical Values are 2.706 (for an α = 0.10), 3.841 (for α = 0.05), and 6.635 (for α = 0.01). * indicates a significance at the 10 percent level of confidence, ** indicates significance at the 5 percent level and *** indicates significance at the 1 percent level.
Consistent with prior studies, a log likelihood function is applied to the data to test if the results are statistically significant. The results show that following the momentum betting strategy is profitable and statistically significant at the one percent level of confidence. Several different season and team aggregates also demonstrated successful critical values at varying levels of confidence.
The results indicate that the public does not appreciate the phenomenon known as momentum enough, whether it is real or simply perceived, and in response the betting houses do not sufficiently inflate (deflate) betting lines for a winning (losing) team. It is consistently profitable to bet with the momentum a team is experiencing, either in the positive or negative direction, winning on average 56.5% of the time. Furthermore, it is highly likely, based on the results of the log likelihood function that this statistic is accurate and not the result of randomness. There is a notable inefficiency in the NBA point spread betting market that will continue to exist until betting houses begin to set lines more appropriately.
CONCLUSIONS
Momentum exists in the NBA and a momentum betting strategy can be followed to generate a profit. The betting public does not properly respond to teams hot and cold streaks over the course of a season. Consequently, the betting lines do not inflate appropriately for a winning team, nor do they deflate appropriately for a losing team. It is consistently profitable over the course of a season to bet for the teams on a winning streak to cover the spread, and to bet for teams on a losing streak to fail to cover the spread.
APPLICATIONS IN SPORTS
The sports betting market is huge and a big part of sports for many Americans. Accordingly to the 1999 National Gambling Impact Study Commission’s report, 86% of Americans have gambled. One of the most popular forms of gambling is wagering on sports. As noted, approximately $80 billion – $380 billion is wagered on sports each year. It is very difficult to identify profitable wagering strategies. However, from 2001 – 2013 following a momentum betting strategy on NBA teams was profitable. It is important to realize that the fact that this strategy has been profitable in the past is not a guarantee that it will be profitable in the future. In fact, if the market is efficient then the point spreads should adjust until the strategy is no longer profitable.
ACKNOWLEDGEMENTSWe would like to thank the Cameron School of Business and the Honors College at the University of North Carolina Wilmington for supporting this research.
REFERENCES
1. Arkes, J. (2011). Do Gamblers Correctly Price Momentum in NBA Betting Markets? Journal of Prediction Markets, 5(1), 31-50.
2. Arkes, J. and Martinez, J. (2011). Finally, Evidence for a Momentum Effect in the NBA. Journal of Quantitative Analysis in Sports, 7(3), Article 13.
3. Brown, William O., and Raymond D. Sauer. (1993) Does the basketball market believe in the hot hand? Comment. The American Economic Review, 83(5), 1377-1386.
4. Camerer, C. (1989). Does the Basketball Market Believe in the Hot Hand? American Economic Review, 79(5), 1377-1386.
5. Gandar, J., Zuber, R., O’brien, T., & Russo, B. (1988). Testing rationality in the point spread betting market. The Journal of Finance, 43(4), 995-1008.
6. Gilovich, T., Vallone, R., & Tversky, A. (1985). The hot hand in basketball: On the misperception of random sequences. Cognitive psychology, 17(3), 295-314.
7. Paul, Rodney J., and Andrew P. Weinbach (2005). Bettor Misperceptions in the NBA The Overbetting of Large Favorites and the “Hot Hand”. Journal of Sports Economics, 6(4), 390-400.

