ABSTRACT
Accurate kinematic analysis of human movement is a significant factor for the improvement of movement performance and for the reduction of injuries. A polynomial method for 3-D analysis was implemented to determine the knee kinematic parameters during level and 9% downhill grade running. The knee kinematic parameters for the level and downhill running were: 20.9 o and 17 o degrees for the flexion angle in foot strike, 36.2 o and 43.1 o for the peak flexion angle in stance phase, and 7.1 rad.sec -1 and 7.4 rad.sec -1 the peak flexion angular velocity respectively. The knee kinematic characteristics, determined using a polynomial method, were within the range of the respective values reported in previous studies, indicating that the polynomial method used is adequate for accurate 3-D kinematic analysis. The results indicate that the knee extensor muscle group is worked over a greater range during downhill running than in level running and furthermore, during the footstrike, the knee flexion angle, in level running is higher than in downhill running, which probably could be affected to the magnitude of the compression forces applied to knee during downhill running.
INTRODUCTION
The biomechanical aspects of running are significant factors for the identification of optimal running mechanics in order to improve the athlete’s performance and to identify the mechanical strategies that can be applied to reduce mechanical overloading of the locomotor system and thus prevent injuries (Nigg, 1985; Subotnick, 1985; Brown and Yavorsky, 1987; Armstrong, 1990; Gross and Napoli, 1993, Herrington, L. 2000 ). The stance phase of gait (walking and running) is a closed chain lower extremity activity that requires coordinated movement between the proximal and distal joints. The lower limb performs many essential dynamic functions ( Ross et al . , 2 004) ., during the stance phase, that enable the body to be propelled forward during gait. In running, as the velocity increases (compared with waking) and the stance phase decreases, there is a double unsupported phase or flight phase and the double support limb phase vanishes (Enoka, 1988). This seems to reflect to the higher proportion of eccentric and concentric muscle work performed in running (specifically, during downhill running). The kinematics and kinetics of the ankle have been extensively documented in previous studies (Kaelin et al., 1985; McKenzie et al., 1985; Soutas-Little et al., 1987; Nigg and Morlock, 1987; Engsberg and Andrews, 1987; Nigg et al., 1988; Kepple et al., 1990). Although the contribution of the knee angle in human locomotion is important and the knee is susceptible to injuries (over 25% of all running injuries reported by Hamill et al. (1992)), there are few previous studies in this field (i.e. Andriacchi, 1990). Cipriani et al. (1995) was determined the kinematic parameters of hip, knee and ankle and evaluated the muscle adaptations in the gait cycle produced by walking backward on a treadmill at 0, 5, and 10 percent inclination. This is a common tool for lower extremity rehabilitation in the clinical setting. There are a few studies investigating the different kinematic characteristics of the knee angle, in order to identify the causes of muscle damage during level and downhill running (Hamill et al., 1984; Buczek and Cavanagh, 1990). Kinematic adaptations during downhill, uphill and level running were measured by Hamill et al. (1984), using a high speed cine camera. In this study, the reported values for the knee flexion angles at heal strike were 15.27 o and 20.06 o degrees for 9% gradient downhill and level running respectively. Similar values for knee flexion angles were reported by Buczec and Cavanagh (1990), using a similar gradient (8.3%).
The main purpose of this study was to apply a polynomial method (Pigos and Baltzopoulos, 1993) for the measurement of knee joint kinematics during
level and downhill running.
METHOD
Instrumentation
A motorized treadmill (Woodway), capable of operating at different speeds and gradients, was used. Treadmills have been frequently used for kinematic analysis in previous studies (Soutas-Little et al., 1987; Nigg and Morlock, 1987; Hamill et al., 1984; Buczek and Cavanagh, 1990; Hamill et al., 1992; Iversen and McMahon, 1992) and there is no significant difference to overground running, when the speed is less than 5 m.s -1 (Williams, 1985; Williams et al., 1991). The speed of the treadmill belt (length 3.6 m) was approximately 3 m .s -1 for both the level and downhill running. The selection of this speed was based on speeds used in previous studies (Hamill et al., 1984; Buczek and Cavanagh, 1990; Iversen and McMahon, 1992; van Woensel and Cavanagh, 1992) and was used to facilitate the comparison of the results. During downhill running, the treadmill was elevated up using an iron structure, in order to provide a gradient of 9% similar to those used by Hamill et. al (1984) and Buczek and Cavanagh (1990) (Fig. 1).
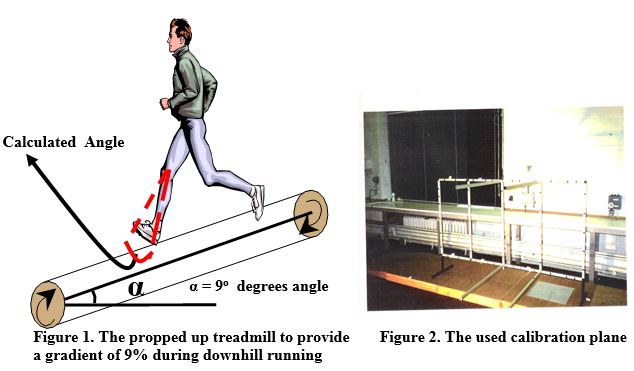
A calibration procedure was performed before both run protocols, using a calibration plane with dimensions 2.1 m wide X 1.1 m high formed by aluminum square tubes (Fig 2). Forty seven markers were mounted on the square tubes throughout the calibration plane. The position of every marker was precisely measured from the lower left marker (origin) of the calibration plane (measurement error 0.5 mm). Four additional square tubes (0.5 m length) were positioned perpendicularly on the calibration plane. The edge points of the square tubes were used to determine the 3-D camera position (camera determination points).
The calibration plane was formed by a prefabricated structure using aluminum square tubes. Forty-seven markers were mounted on the square tubes throughout the calibration plane, but only t hirty calibration points was used for this study . The position of every marker was precisely measured from the lower left marker (origin) of the calibration plane (measurement error £ 0.5 mm). Two additional square tubes (0.5 m length) were positioned perpendicularly on the calibration plane (Fig 2). The edge points of these square tubes were used to determine the 3-D camera position (camera determination points).
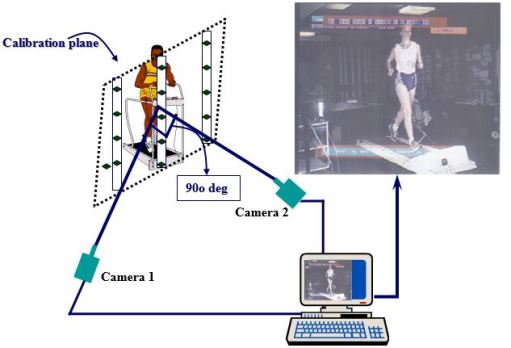
The calibration plane was placed between the camera positions and the athlete, so that the athlete was within the calibrated volume throughout the level and downhill running (Fig. 3).
Figure 3. The experimental set up for the level and downhill running.
The calibration plane and subsequently the athlete’s movements were recorded using two S-VHS Panasonic F-15 cameras fitted with WV-LZ14/15E lenses. Once the calibration plane was recorded it was then removed and no additional calibration procedure was performed between the level and downhill running. The cameras were mounted on tripods with no panning possibility and were positioned as illustrated in figure 3.
The angle between the two camera optical axes was approximately 90 0. The synchronization of the shutter in both cameras was achieved using a gen-lock system (WV-AD 36E Panasonic gen-lock adaptor). The speed of the shutters was fixed at 1/500 sec in order to eliminate any blurring and improve image quality.
Two S-VHS Panasonic AG-7330-B video recorders recorded the movement with a frequency of 50 field of view per frame. The same S-VHS recorder, an Intel 82386 based-computer and a developed coded Pascal (version 6) based on the algorithm described by Pigos and Baltzopoulos (1993) (see below in “ Polynomial method and digitizing procedure”), were used to review and analyze the recorded data.
Subject
One 21 year old female runner (height 1.73 m and body mass 65 Kg), performed the level and downhill running. Explanation of the experimental procedure was given and anthropometric measures (body mass and height) of the subject were taken before running. Skin markers were not attached to the subject. This was based on the results of a previous study by Ronsky and Nigg (1991), who concluded that relative movement can occur between markers attached to the skin, if the base for the marker is not rigid. Moreover, because of relative movement between the skin and the bone, the markers attached to the skin may not precisely describe the movement of the underlying bone and consequently the marker cannot represent accurately the center of rotation of the joint, which must be digitized, throughout the entire movement.
The subject was allowed to familiarize herself with the treadmill and warm up for 2 min before the level and 1 min before the downhill running. Once the subject had achieved the test speed (approximately 3 m.s -1) 30 seconds of the level and downhill running was recorded.
Polynomial method and digitizing procedure
The determination of the 3-D coordinates of the athlete was estimated using the polynomial procedure (Pigos and Baltzopoulos, 1993). The 3-D coordinates of any point are determined as the intersection of the lines formed by the positions of (at least) two cameras and the projections of the point on the calibration plane from the two camera views. The formulation of a first degree polynomial model consists of the following equations:
X p = a 1+a 2x+a 3y (1)
Y p = b 1+b 2x+b 3y (2)
where X p, Y p are the coordinates of the projection of any digitized point on the calibration plane mapped from the 2-dimensional x, y camera image coordinates.
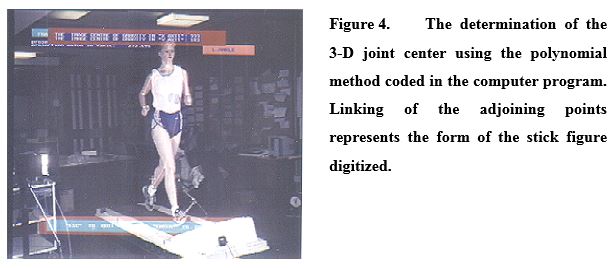
Consequently, three or more calibration points with known X, Y coordinates are required, in order to evaluate the polynomial coefficients a 1..a 3 and b 1..b 3 using the first degree polynomial. Thirty calibration points and two camera determination points (see fig 3) were used, for the estimation of the coordinates of the digitized points. This procedure was performed for each camera. Once the calibration points were digitized (in the video reference system) and stored, the polynomial coefficients in equations (1) and (2) were determined using the closest calibration points of every digitized point. Two complete cycles, one from level and one from downhill running, were digitized. In addition, ten frames before the first footstrike and ten after the last toe-off of the gait cycle, were also digitized to provide a buffer for filtering (Fig 4).
In the analysis procedure, only the kinematic characteristics of the left knee in the stance phase were extensively analyzed, although the entire body was reconstructed. This analysis of the knee was performed to facilitate comparison of the results, using the polynomial method described in Chapter 3, with other published studies (Hamill et al., 1984; Buczek and Cavanagh, 1990; Williams et al., 1991; Hamill, 1992; Iversen and McMahon, 1992; van Woensel and Cavanagh, 1992).
Data analysis – Smoothing procedure
Before the estimation of the kinematic parameters, a filtering procedure was applied to smooth the data and minimize the signal noise (Miller and Nelson 1976; Winter, 1979; Wood, 1982). Different smoothing methods have been reported and implemented in previous studies for the reduction of noise from the raw displacement data (Reinsch, 1967; Reinsch, 1971; Zernicke et al., 1976; McLaughlin et al., 1977; Pezzack et al., 1977; Hatze, 1981; Lanshammar, 1982; Vaughan, 1982; Niinomi et al., 1983; Garhammer and Whiting, 1989). Digital filters are frequently used in kinematic analysis achieving effective reduction of the noise. More specifically, Pezzack et al. (1977) compared angular acceleration signals from an accelerometer with those obtained from synchronized film and concluded that the digital filters reduced effectively the signal noise, reflecting the accurate estimation of the kinematic parameters. Vaughan (1982) assessed the displacement data of a falling ball, using cine cameras and different smoothing methods: Cubic spline, quintic spline and digital filter. In this study the results indicated that although the quintic spline was superior to the other methods, digital filters could produce accurate results. Garhammer and Whiting (1989) compared the five-point moving arc, spline and digital filter methods and concluded that there was no significant difference in the estimation of kinematic parameters, using the above smoothing methods.
The use of digital filters in running applications
Williams and Cavanagh (1983), in a study for the calculation of mechanical power during distance running, used digital filtering with a cutoff frequency of 5 Hz to smooth the 3-D coordinates. Winter (1983) used a digital filter with a cutoff frequency of 8 Hz to smooth the 2-D raw data obtained during running. A digital filter with a cutoff frequency of 7.5 Hz was also used by Buczec and Cavanagh (1990) to filter the digitized data collected from the level and downhill running. Hamill et al. (1992) in the study for the determination of the relationship between the subtalar and knee joint actions, during the support phase of level treadmill running, used digital filters with cutoff frequencies ranging from 8 Hz to 18 Hz. Digital filters and an arbitrary cutoff frequency of 12 Hz were used by Woensal and Cavanagh (1992), to smooth the 3-D reconstructed coordinate of running subjects, using optoelectronics cameras. It is evident that the application of low pass digital filters (Butterworth filters) is an adequate smoothing method for kinematic analysis, extensively implemented in previous running studies. However, the selection of the optimum cutoff frequency remains a significant factor for accurate measurements (Winter, 1979). Winter (1974) reported that for the knee angle (in walking) there are no significant harmonics higher than the 6th (6 Hz). Williams (1993) highlighted that digital filtering frequencies for running kinematic data are typically in the range of 2 to 10 Hz (when a 100 Hz sampling rate is used).
Smoothing procedure
In this study digital filters were used to smooth the raw data. The format of the second order Butterworth digital filter used is the following:
F i = a 0R i + a 1R i-1 + a 2R i-2 + b 1F i-1 + b 2F i-2
where a 0, a 1, a 2 and b 1, b 2 are the filter coefficients which are constant and determined by the ratio of the sampling frequency to cutoff frequency, R i and F i the raw and the filtered data respectively. The algebraic sum of the filter coefficients must be 1 in order to give a response of unity over the pass band. The filtering of data for the second time, but in the reverse direction of time, results in the creation of a fourth-order, zero phase shift filter.
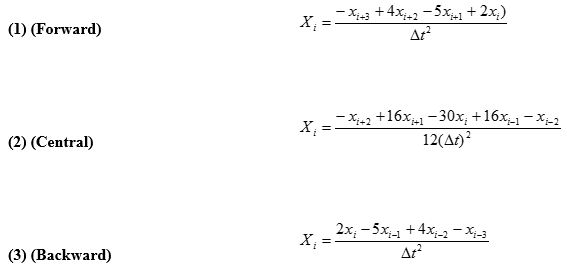
The digital filter was coded in the developed Pascal program and tested using the raw data reported in a previous study (Vaughan, 1982). The criterion for the efficacy of the coded smoothing method was the accurate estimation of the second derivative (acceleration), where the error due to signal noise is high. The cutoff frequency (6 Hz) was that recommended by Vaughan (1982). The second derivative (acceleration) of the movement, with respect to time, was calculated using the mathematical expressions proposed by Miller and Nelson (1976). Forward, central and backward difference formulae were implemented for second derivative of displacement (raw) data using two points on either side of the point to be smoothed:
where: X i the acceleration at point x i.
the point x i+1 : the x coordinate of the point one frame before
x i+2 : the x coordinate of the point two frames before
x i-1 : the x coordinate of the point one frame after
x i-2 : the x coordinate of the point two frames after
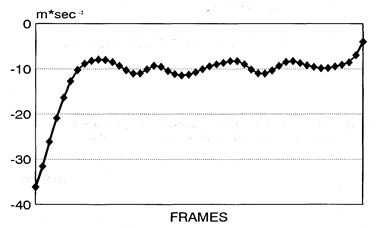
The results (Fig. 5) indicate that the digital filter is an adequate smoothing method for kinematic data and consequently implemented in the present study.
Figure 5. Determination of a falling ball’s acceleration (Vaughan 1982), using digital filter.
The optimal cutoff frequency of the filter was determined by filtering the data using different cutoff frequencies until the difference between the variance in the raw and the filtered data was minimal (Pezzack et al., 1977). The selected optimal cutoff frequency was 4 Hz.
Kinematic parameters
The angles between the segments were calculated using simple geometric expressions consisting of the direction vectors of the two lines formed by (at least) three non collinear points (Bowyer and Woodwark, 1983)):
(4)
where f 1, f 2, g 1, g 2 are the directions of the two lines formed by (at least) three non collinear points (see Chapter 5) and the angle between the two lines.
The first angular derivative (angular velocity) was calculated using the formulae proposed by Miller and Nelson (1976). The mathematical expressions for the forward, central and backward formulae of angular velocity, using two points on either side of the point to be smoothed, are:
where: X i the angular velocity of the x i point.
the point x i+1 : the angle one frame before
x i+2 : the angle two frames before
x i-1 : the angle one frame after
x i-2 : the angle two frames after
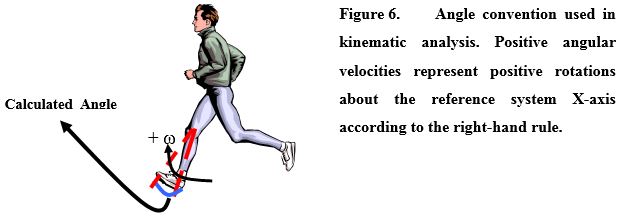
Figure 6 illustrates the conventions used for the knee angles and angular velocities ( ω ).
RESULTS
In order to facilitate comparisons, the values of the angles in the stance phase
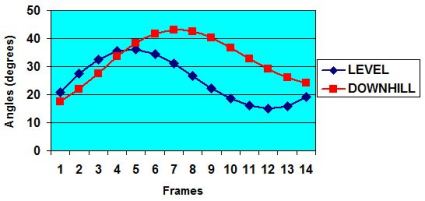
are expressed in degrees, whereas the angular velocities are expressed in rad.sec -1 according to the format of the results in the study by Buczek and Cavanagh (1990). The flexion knee angle (stance phase) in the foot strike (FA) was 20.9 o degrees for the level running and 17.4 o for the downhill running (Table 1). The peak knee flexion angle during the stance phase (PFA) was 36.2 o and 43.1 o for the level and downhill running respectively. The time of the peak flexion (TPFA), expressed as a percentage of the total time of the stance phase, was 35.7 % and 50.0 %. The peak flexion angular velocity (PFAV) was 7.1 rad.s -1 and 7.4 rad.s -1 for the level and downhill running respectively. The time of the peak angular velocity (TPFAV) was 14.2 % and 21.4 % of stance phase for the level and downhill running respectively. The knee angle throughout the stance phase is illustrated in figure 7. The difference between the flexion angle during foot strike and the peak flexion angle (ROM) was 15.3 o and 25 o for the level and downhill running respectively.
| Level Running | Downhill running | |
| Flexion angle in foot strike (degrees) | 20.9 o | 17.4 o |
| Peak flexion angle (degrees) | 36.2 o | 43.1 o |
| Time of the peak flexion angle (percentage of total stance phase) | 35.7 % | 50 % |
| Peak flexion angular velocity (rad.s -1) | 7.1 | 7.4 |
| Time of the peak angular velocity | 14.2 % | 21.4 % |
| Difference between the flexion angle during foot strike and the peak flexion angle (degrees) | 15.3 o | 25 o |
Table 1. Summary of kinematic analysis during stance phase
Figure 7. The knee angle throughout the stance phase .
Reliability
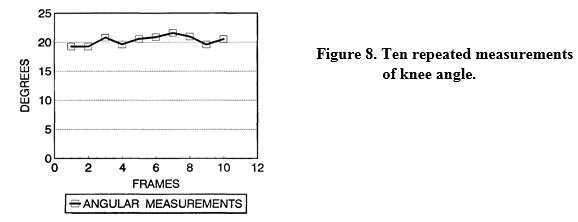
Although the reliability of the polynomial method implemented in the reconstruction of 3-D coordinates has been examined (Pigos and Baltzopoulos, 1993) using spatial coordinates, a different reliability analysis using angular measurements (FA in footstrike) was also performed. In this examining procedure, ten repeated digitization of a single frame (footstrike) from every camera view were used when the subject performed level running. The low value of the standard deviation (0.89 o) and the coefficient of variation (4.40%) of the angular measurements, indicate that the polynomial method is reliable for the 3-D body segment reconstruction (Fig 8).
DISCUSSION
In this study the knee kinematic parameters during level and downhill running were calculated using the reconstructed 3-D coordinate of the runner joints applying the polynomial method described in Chapter 3. Two and three dimensional studies have examined lower extremity kinematic adaption during level and downhill running. Newham et al. (1988) concluded that the knee extensor muscle group is worked over a greater range during downhill running than in level running. The kinematic analysis of the knee in level and downhill running in previous studies highlighted that FA in level running is higher than in downhill running, with a difference ranging from 3.3 o to 7.6 o (Hamill et al., 1984; Buczek and Cavanagh, 1990). Hamill et al (1984) reported a direct relationship between knee angle at footstrike and the gradient in downhill running. Buczek and Cavanagh (1990) demonstrated that the PFA is higher in downhill running with a difference of 4 o from level running. The PFAV is higher overall, according to previous studies in downhill running, and the difference ranged from 0.6 rad.s -1 to 2.3 rad.s -1 (Hamill et al., 1984; Buczek and Cavanagh, 1990).
The results of the present study indicate that the values of the kinematic parameters determined using the polynomial method, were within the range of the respective values reported in previous studies.
More specifically, the FA at footstrike in level running was similar with the FA of 20.08 o reported by Hamill et al. (1984), higher than 11.2 o reported by Hamill et al. (1991) and lower than 24.6 o reported by Buczek and Cavanagh (1990), whereas the FA in downhill running in the present study was higher than Hamill et al. (1984) (15.3 o) and similar to Buczek and Cavanagh (17.0 o). Based on the results of the present study and previous (Hamill et al. 1984) regarding the higher flexion angle estimated in level running is than in downhill running, could probably be affected to the magnitude of the compression forces applied to knee during downhill running and it one of the issue should be considered from the trainers.
The PFA for level running was similar with the respective values of 35.4 o reported by van Woensel and Cavanagh (1992), but lower than those reported by Buczek and Cavanagh (1990), Williams et al. (1991), Hamill et al. (1991), and Hamill et al. (1992) (43.9 o, 44.5 o, 43.8 and 44.1 o respectively). The PFA for the downhill running was lower than Buczek and Cavanagh (47.9 o). The PFAV was similar with the respective values reported by Hamill et al. (1992), but less than those of Hamill et al. (1984), Buczek and Cavanagh (1990), Williams et al. (1991). The difference between the FA and the PFA (ROM) was similar with the respective ROM in the Buczek and Cavanagh (1990) study. The difference between the FA and the PFA, indicates that the knee extensor muscle group is worked over a greater range during downhill running than in level running and should be considered from the trainers.
A summary of measurement values of left knee kinematic parameters and comparison with other published studies (Hamill et al., 1984; Buczek and Cavanagh, 1990; Williams et al., 1991; Hamill et al., 1991; Hamill et al., 1992; van Woensel and Cavanagh, 1992) are presented in Table 7.1. Motorized treadmills have been used in previous studies.
The variability of kinematic parameters reported in different studies can not provide a criterion for the accurate estimation of the methods. However, the above comparison of the kinematic parameters was considered sufficient to estimate the validity of the polynomial method implemented.
The difference between the kinematic parameters reported in different studies, is due to the variability in the individual running style (Williams, 1993) and body mass between the subjects used (McKenzie et al., 1985), kinematic asymmetries of lower limbs (Holden et al., 1985; Vagenas and Hoshizaki, 1992), different recording (type of cameras and set up) and analysis procedures (two or three dimensional analysis, filtering, cutoff frequency, differentiating expressions and algebraically manipulation of the data).
Table 7.1.Summary of knee joint kinematic during stance phase of the present and previous studies. (1: Hamill et al., 1984, 2: Buczek and Cavanagh, 1990, 3: Williams et al., 1991, 4: Hamill et al., 1991, 5: Hamill et al., 1992, 6: van Woensel and Cavanagh, 1992.)
| Studies | grad% | speed m.s -1 | FA degrees (±SD) | PFA (±SD) degrees | TPFA % stance (±SD) | PFAV rad.s -1 (±SD) | TPFAV % stance (±SD) | ROM FA-PFA |
| Present study | 0 | 3 | 20.9 | 36.2 | 32.1 | 7.1 | 14.2 | 15.3 |
| – 9 | 3 | 17.4 | 43.1 | 50.0 | 7.4 | 21.4 | 25.7 | |
| 1 | 0 | 3.8 | 20.1 | – | – | 10.1 | – | – |
| – 9 | 3.8 | 15.3 | – | – | 12.4 | – | – | |
| 2 | 0 | 4.5 | 24.6 (3.0) | 43.9 (3.6) | 33.6 (2.4) | 7.97 (1.2) | 4.3 (1.9) | 19.3 |
| – 8.3 | 4.5 | 17.0 (4.2) | 47.9 (3.3) | 40.7 (1.9) | 8.57 (0.38) | 15.0 (0.0) | 30.9 | |
| 3 | 0 | 5.5 | – | 44.5 | – | – | – | – |
| – | – | – | – | – | – | – | – | |
| 4 | 0 | 2.9 | 11.2 (6.9) | 43.8 (5.1) | 184 (55) * | – | – | 32.6 |
| – | – | – | – | – | – | – | – | |
| 5 | 0 | ** | – | 43.4 | 44.7 | 7.1 | 21.5 | – |
| – | – | – | – | – | – | – | – | |
| 6 | 0 | 3.8 | – | 35.4 (4.1) | 90.0 (7.1) * | 7.82 (1.46) | 30.6 (6.4) * | |
| – | – | – | – | – | – | – | – |
* The time in these studies was reported in milliseconds and not as % of stance phase. For comparison purposes, the TPFA of the present study was 70 ms for the level and 120 ms for downhill running. The TPFAV was 30 ms and 40 ms respectively.
** The running speed of this study has not been reported.
The results of Cipriani et al. (1995) were not included, because referred to walking procedure and not to running.
In previous studies there is no specification of the analyzed lower limb (left or right). Furthermore, the gradient in downhill running is also reflected in the variability of the kinematic parameters between the studies. The coded developed program for the kinematic analysis of the movement enables the facility for rotation of the movement and view of the image in three different pairs of axes: X – Y, Y – Z and X – Z, with varying interval times between the frames. Thus, a better observation of the image movement can be accomplished. It is important to note that the design of the recording procedure (cameras view point and set up) has not focused in the knee joint, as has been reported in previous studies. Thus, the polynomial method presented is accurate and adequate for the kinematic parameters estimation of any body segment and consequently for the 3-D analysis of the movements.
CONCLUSION
A polynomial method was applied in the 3-D kinematic analysis of the level and downhill running. The comparison of the results, in knee kinematics with previous studies, indicates that the polynomial method is an adequate method for the analysis of the movement. The simplicity and the efficiency of the method in the calibration procedure, compared with previous calibrated methods and the accuracy in the determination of spatial points and angles, render the method suitable for 3-D analysis of movement.
The results indicate that the knee extensor muscle group is worked over a greater range during downhill running than in level running and furthermore, during the foot strike, t he knee flexion angle, in level running is higher than in downhill running, which probably could be affected to the magnitude of the compression forces applied to knee during downhill running
Dr. George Pigos is a graduate of the Physical Education and Sports Science department of the University of Athens, Greece with a specialization in swimming trtaining. He holds a Ph. D in Biomechanics/Kinisiology from the University of Liverpool in England. He is a research assistant at the University of Athens and has worked as a lecturer for seven years at Northumbira University in Newcastle, England. He is a member of the Board of Directors of the International “Sport for All” Federation and was the director of sector timeing, scoring and results for the Athens Organizing Committee for the 2004 Summer Olympic Games.
REFERENCES
- Andriacchi, T. P. (1990). Dynamics of pathological motion: applied to the anterior cruciate deficient knee. Journal of Biomechanics, 23, 99-105.
- Armstrong, R. B. (1990). Initial events in exercise induced muscular injury. Medicine and Science in Sports Exercise, 22, 429-435.
- Bowyer, A., Woodwark, J. (1983). A programmer’s geometry, Butterworts.
- Brown, L. P., Yavorsky, P. (1987). Locomotor biomechanics and pathomechanics: a review. The Journal of Orthopedic and Sports Physical Therapy, 9, 3-10.
- Buczek, F. L., Cavanagh, P. R. (1990). Stance phase knee and ankle kinematics and kinetics during level and downhill running. Medicine and Science in Sports and Exercise, 22, 669-677.
- Cipriani, D. J, Armstrong, C. W, Gaul, S. (1995). Backward walking at three levels of treadmill inclination: an electromyographic and kinematic analysis. The Journal of orthopaedic & sports physical therapy, 22, 95-102.
- Engsberg, J. R., Andrews, J. G. (1987). Kinematic analysis of the talocalcaneal/talocrural joint during running support. Medicine and Science in Sports and Exercise, 19, 275-284.
- Garhammer, J., Whiting, W. C. (1989). Comparison of three data smoothing techniques for determining weight lifting kinematics. Scandinavian Journal of Sports Sciences, 11, 97-104.
- Gross, M. L., Napoli, R. C. (1993). Treatment of lower extremity injuries with orthotic shoe inserts. Sports Medicine, 15, 66-70.
- Hamill, C. L., Clarke, T. E., Frederick, E. C., Goodyear, L. J., Howley, E. T. (1984). Effects of grade running on kinematics and impact force. Medicine and Science in Sports and Exercise, 16, 185.
- Hamill, J., Bates, B. T., Holt, K. G. (1992). Timing of lower extremity joints actions during treadmill running. Medicine and Science in Sports and Exercise, 24, 807-813.
- Hamill, J., Freedson, P. S., Clarkson, P. M., Braun, B. (1991). Muscle soreness during running: biomechanical and physiological considerations. International Journal of Sport Biomechanics, 7, 125-137.
- Hatze, H. (1981). The use of optimally regularized fourier series for estimating higher-order derivatives of noisy biomechanical data. Journal of Biomechanics, 14, 13-18.
- Herrington, L. (2000) Diagnosis and management of anterior knee pain. SportEX medicine. (Wimbledon,-England), 6, 26-29
- Holden, J. P., Cavanagh, P. R., Williams, K. R., Bednarski, K. N. (1985). Foot angles during walking and running. In Biomechanics IX-A (Edited by Winter, D. A., Norman, R. W., Wells, R. P., Hayes, K. C. and Patla, A.E.) pp. 451-456. Human Kinetic Publishers, Champaign, Illinois.
- Iversen, J. R., McMahon, T. A. (1992). Running on an incline. Journal of Biomechanical engineering, 114, 435-441.
- Kaelin, X., Unold, E., Stussi, E., Stacoff, A. (1985). Interindividual and intraindividual variabilities in running. In Biomechanics X-B (Edited by Winter, D. A., Norman, R. W., Wells, R. P., Hayes, K. C., and Palta, A. E.) pp. 356-360. Human Kinetic Publishers, Champaign, Illinois.
- Kepple, T. M., Stanhope, S. J., Lohmann, K. N., Roman, N. L. (1990). A video-based technique for measuring ankle-subtalar motion during stance. Journal of Biomedical Engineering, 12, 273-280.
- Lanshammar, H. (1982). On practical evaluation of differentiation techniques for human gait analysis. Journal of Biomechanics, 15, 99-105.
- McKenzie, D. C., Clement, D. B., Taunton, J. E. (1985). Running shoes, orthotics and injuries. Sports Medicine, 2, 334-347.
- McLaughlin, T. M., Dillman, J. C., Lardner, T. J. (1977). Biomechanical analysis with cubic spline functions. Research Quarterly, 48, 568-581.
- Nigg, B. M. (1985). Biomechanics, load analysis and sports injuries in the lower extremities. Sports Medicine, 2, 367-379.
- Nigg, B. M., Herzog, W., Read, L. J. (1988). Effect of viscoelastic shoe insoles on vertical forces in heel-toe running. The American Journal of Sports Medicine, 16, 70-76.
- Nigg, B. M., Morlock, M. (1987). The influence of lateral heel flare of running shoes on pronation and impact forces. Medicine and Science in Sports and Exercise, 19, 294-302.
- Niinomi, S., Suzuki, Y., Tsuchiya, K. (1983). A data smoothing method using spline functions and its application in motion analysis. In Matsui H. & K. Kobayashi (Ed.), Proceedings of the eighth international congress of Biomechanics, 4B (pp. 1215-1222). Nagoya, Japan. Human Kinetic Publishers.
- Pezzack, J. C., Norman, R. W., Winter, D. A. (1977). An assessment of derivative determining techniques used for motion analysis. Journal of Biomechanics, 10, 377-382.
- Pigos, G., Baltzopoulos V. (1993). A polynomial method for image distortion correction and three dimensional kinematic analysis using video systems. Journal of Biomechanics, 27, pp.765.
- Reinsch, C. H. (1967). Smoothing by spline functions. Numerische Mathematik, 10, 177-183.
- Reinsch, C. H. (1971). Smoothing by spline functions. Numerische Mathematic, 16, 451-454.
- Ronsky, J. L, Nigg B.M. (1991). Error in kinematic data due to marker attachment methods. In Proceedings of XIII International Congress on Biomechanichs (Edited by Marshall, R. N., Wood, G. A., Elliot, B. C., Ackland, T. R. and Mc Nair, P. J.), pp. 350-351. University of Western Australia, Perth, Australia.
- Ross, S., Guskiewicz, K., Prentice W., Schneider R., Yu B. (2004). Comparison of biomechanical factors between the kicking and stance limbs. Journal of Sport Rehabilitation , 13 , 135-50 .
- Soutas-Little, R. W., Beavis, G. C., Verstraete, M. C., Marcus, T.L. (1987). Analysis of foot motion during running using a joint co-ordinate system. Medicine and Science in Sports and Exercise, 19, 285-293.
- Subotnick, S. I. (1985). The biomechanics of running. Implications for the prevention of foot injuries. Sports Medicine, 2, 144-153.
- Vagenas, G., Hoshizaki, B. (1992). A multivariate analysis of lower extremity kinematic asymmetry in running. International Journal of Sports Biomechanics., 8, 11-29.
- Vaughan, C. L. (1982). Smoothing and differentiation of displacement-time data: an application of splines and digital filtering. International Journal of Bio-Medical Computing, 13, 375-386.
- van Woensel, W., Cavanagh, P. R. (1992). A perturbation study of lower extremity motion during running. International Journal of Sport Biomechanics, 8, 30-47.
- Williams, K. R. (1985). Biomechanics of running. Exercise and Sport Sciences Reviews, 13, 389-441.
- Williams, K. R., Snow, R., Agruss, C. (1991). Changes in distance running kinematics with fatigue. International Journal of Sport Biomechanics, 7, 138-162.
- Williams, K. R. (1993). Biomechanics of Distance Running. In Current Issues in Biomechanics (Edited by M. D. Grabiner), (pp. 3-31). Human Kinetic Publishers.
- Winter, D.A (1979). Biomechanics of Human Movement. (Edited by Wiley J. and Sons), New York.
- Wood, G.A. (1982). Data smoothing and differentiation procedures in biomechanics. Exercise and Sport Science Reviews, 10, 308-362.
- Yeadon, M. R., Challis, J. H. (1994). The future of performance- related sports biomechanics research. Journal of Sports Sciences, 12, 3-32.
- Zernicke, R. F. ,Caldwell, G., Roberts, E. M. (1976). Fitting biomechanical data with cubic spline functions. Research Quarterly, 47, 9-19.

