Non-Economic Societal Impacts of Intercollegiate Athletics

Abstract:

Intercollegiate athletics impact society in numerous positive ways. A number of studies have been done seeking to establish the effects of these sports programs on athletes, their institutions, and society at large. This paper is a synthesis of the literature concerning the non-economic impacts of sports. The findings largely support the notion that athletics are beneficial, not only to athletes, but to society in general. Many important lessons and virtues are derived from athletics. Among the many benefits to higher education institutions are the concepts of attracting more admissions applications and enhancing institutional name recognition and visibility.

Introduction:

Athletics provide entertainment, physical development, social interaction, and business (Cigliano, 2006). They create platforms for individual recognition and institutional visibility. There are many positive externalities associated with athletic activities. Attaching monetary value to these effects is difficult, as the value is based on societal satisfaction measures that are hard to measure.

Athletics Mould Virtues

Athletics help shape the social character of participants (Rudd and Stoll, 2004). A sample of 595 students from several universities was used in a causal-comparative study in which athletes and non athletes were compared concerning social and moral character. There were significant differences between athletes and non athletes. The main conclusion was that sport helps build character in terms of teamwork, loyalty, and self-sacrifice. There is no evidence to support the idea that athletics help build moral character, though neither is it proven that they do not do so.

Yiannakis, Douvis, and Murdy (2003) studied the perceived economic and non-economic impacts of sports. The findings are based on a survey of 702 residents and students of Connecticut attending two universities. They measured the perceived impacts of sports in terms of job creation, infrastructure, image promotion, economic impacts, environmental impacts, crime, and deviancy, among others. The authors conjectured that conflicts, issues, ideologies, pain, success, and tragedy are all blended in sports. People identify with these and are able to better handle the challenges of life as they see teams fighting on the field of play.

Athletes learn the principles of self discipline, teamwork, winning and losing, hard work, and self confidence. They have their self esteem boosted (National Federation of High Schools, 2003). One athletics director at a community college within the Tennessee Board of Regents (TBR) said, “Athletics fulfill major commitments of our mission statement to educate the whole person, to develop teamwork and leaders, and to contribute to the personal health and well-being of our students” (Cigliano, 2006, p45).

Yiannakis et al. (2003) established that the perceptions of people regarding the positive impacts of sport differed based on whether one was a fan or not. Non fans tend to regard sports as a nuisance that causes traffic jams and pollution. Enthusiasts savor the joy brought by the victories of their teams. A relationship may exist between the degree of interest and the extent to which sports are perceived to be beneficial.

Cigliano’s (2006) qualitative study was done at two community colleges in the TBR to examine the economic, institutional, and human impacts of athletic programs. The participants from each college included the president, the athletics director, two coaches, and four student-athletes. Coaches from the colleges said they viewed athletics as vehicles that help some students stay in school. The discipline and structure in athletic programs help motivate student-athletes to take advantage of educational opportunities. The coaches spoke of employing discipline, monitoring class and study hall attendance, and using encouragement to motivate student-athletes to achieve academic goals and become academically successful. Indirectly, the study addressed the apparent conflict of goals between academic interests and athletics. As long as there is a good relationship between the sports departments and academics, goal conflict exists only as an abstract concept.

Student-athletes participating in Cigliano’s (2006) study stated the following as virtues they received: recognition, patience, becoming better persons, self-discipline, maturity, motivation, teamwork, knowing people better, working hard, perseverance, working together, self-confidence, and leadership. The presidents, athletic directors, and coaches identified leadership development, a sense of civic responsibility, loyalty, punctuality, team work, cooperation, winning and losing with class and dignity, being competitive, developing individual strengths and skills, getting along with people, obedience, discipline, learning to make independent decisions, adjusting to being on their own, and maturity as virtues learned from athletics.

In the words of one athlete:

As much as we have to be physically in shape…we definitely also need an attitude which enhances our performance. This…(is)…an inner attitude of confidence in your ability, determination to see what you can do, and delight in what may be possible. The positive vibes that surround a person with an attitude like this can spread (Depew1 , 1999).

The NFHS (2003) reported that sport promotes citizenship and sportsmanship by instilling a sense of pride in community, teaching lessons of teamwork and self-discipline, and facilitating the physical and emotional development of participants.

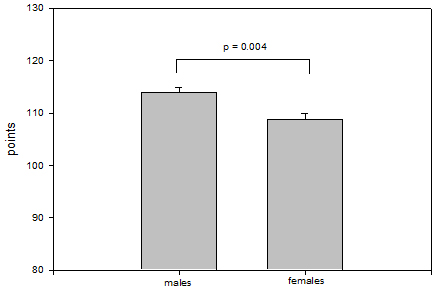
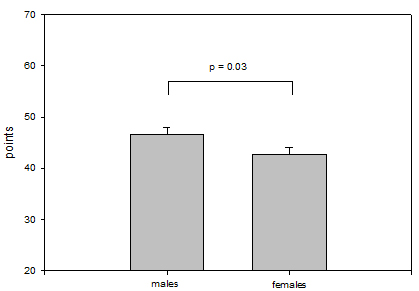
Bailey, Moulton, and Moulton (1999) compared athletes and non-athletes concerning levels of self-esteem and approval motivation. A sample of 492 university undergraduates participated in this study; ninety-four were athletes. The study used a multivariate analysis of variance to determine whether there was a significant difference between athletes and non-athletes on the variables of self-esteem and approval motivation. Athletes had significantly higher levels of self-esteem than non-athletes. There was also a statistically significant difference on approval motivation. Thus, athletes are “more likely to view themselves positively…and are less likely to engage in approval seeking behavior than non-athletes” (Bailey, Moulton, & Moulton, 1999).

The ability of physical exercise to eliminate anxiety in university youth was investigated by Akandere and Tekin (2002). The sample was comprised of 311 students from Konya Selcuk University of Turkey who had never been involved in physical exercise. A sub-sample of sixty students who had the highest anxiety scores was split in half, so that thirty became the experimental group (which participated in organized physical activity) and the other thirty became the control group. Participation in physical exercise and physical activities decreased the anxiety level of both sexes.

Basking in Reflected Glory

Athletic activities relax the mind and “function as psychological and spiritual havens where disorder and moral ambiguities are resolved and managed through communal sport ritual practices and traditions” (Yiannakis et al., 2003, p.5). One of the perceived impacts lies in a concept called ‘Basking in Reflected Glory’ (BIRG). In Yiannakis et al.’s study, a majority of the respondents reported feeling ‘really good’ when their teams won and feeling ‘really bad’ when their teams lost. However, the relationship between sport-induced mood states, social identity, empowerment, and pro-social behavior is not fully understood and may require further inquiry.

One of the most popular studies on ‘BIRG’ was done by Cialdini et al. (1976)2. College students were found to be more likely to use the pronoun ‘we’ and to wear clothing that identified with their schools after a successful athletic weekend than during times when they had drawn or lost. Cialdini posited that people had a predisposition to associate with positive outcomes and make them their own. When one is ‘BIRG’, the person on the receiving end would not have done anything to bring the team’s success. Theirs is just to bask in unearned grandeur. When one’s team does well, it results in feelings of happiness, well-being, and collective euphoria. It has also been suggested that ‘BIRG’ improves mood in both individuals and communities.

On the flip side of the concept of ‘BIRG’ is ‘Cutting-Off Reflected Failure’ (CORF). The main ‘CORF’ strategy is to minimize the association between oneself and the losing team via several means, including by refusing to attend the teams’ matches’ and using terms such as ‘they’ rather than ‘we’. ‘CORF’ can be said to have somewhat positive results. The pessimism that precedes crucial matches can have the positive impact of uniting fans in the face of the possibility that it can all go wrong. Such an acceptance of a possible negative outcome can have the effect of protecting fans against disappointment as a result of failure. Having a shared moan can be a way of bonding3.

Reputation and Institutional Image

The reputation of an academic institution is closely tied to its sports programs (Cigliano, 2006; Pulsinelli et al, 1989). Thrilling performances by teams score points for the institution. High ranking sporting colleges are also ranked high in the academic arena.

The majority of respondents from Cigliano’s (2006) study mentioned a variety of values of publicity that athletic programs brought to the colleges, including a sense of excitement, activity, focus, free advertising, media coverage, service area communication, recruitment enhancement, and identity for local support to the institutions. The institutional image generated was said to be very positive. Good coverage amounted to free advertising. One of the presidents commented that:

Whether it is right or wrong, many people out in the community do not see anything in your college other than athletics. I mean, you have a certain constituent group out there that will even evaluate your college on how your athletic program is and people read about athletics in the paper. (Cigliano, p62).

In the study, athletic directors noted that visibility of their colleges was due more to athletics than any other department. They pointed out that institutional recognition is a function of the athletics program.

In a 2004 study, Frank mentioned the effect that spending on big time sports has on a university’s name recognition. Because these institutions are constantly making headlines in the public media, their names become more familiar to prospective students than those which are not publicized. This is likely to influence them in the college decision-making process. In such instances, “a big-time athletic program serves much like a national advertising campaign” (Frank, p15).

While athletes are students, they are also considered role models by their fans. People identify with role models on the sports field (Yiannakis et al., 2003). James Sheridan, a cross country athlete at Kenyon College, said, “athletes represent (their institutions) across the country and the type of attitude (they) project reflects on (the) entire learning institution” (Depew, 1999).

Enrollment

Athletics have a positive effect on enrollment. Pulsinelli, Borland, & Goff (1989) postulated that in order for sporting teams to be self financing, athletic teams would have to ‘attract’ a certain number of non-athletic students to the university. Enrollment data for the years 1960 to 1988 were analyzed with winning percentages for football and basketball. Overall, high sporting performance was associated with increased enrollment. This study alluded to the fact that recruiting high profile athletes might increase enrollment because of the indirect ‘attracting influence’ exerted on non-athlete aspiring students. When choosing among schools that offer athletic programs, non athletes prefer schools that have winning records to those that do not.

An impact study of Nichols State University (NSU) by Coats and Cox (2004), found that athletics have an effect on enrollment apart from the economic impact. Nicholls State’s athletic programs directly supported 239 student athletes. It was estimated that these student athletes drew an additional forty-three friends or relatives to NSU. Furthermore, of the 105 members of the marching band, approximately a third would have enrolled elsewhere were it not for the existence of the athletics program. Thus, the NSU athletics and associated programs were directly responsible for attracting 322 students to NSU. These students, in turn, supported approximately fourteen faculty positions.

Toma and Cross (1996) examined undergraduate admissions applications for institutions that won the NCAA Division I-A national football championship and those that won the NCAA men’s basketball tournament for the years 1979 through 1992. Increases were recorded in undergraduate admissions applications in years following a championship season. Fourteen out of sixteen schools that won or shared championships in football recorded increases in the number of applications. In basketball, ten out of thirteen schools recorded increases in applications following the NCAA Tournament championship.

Frank (2004) analyzed the effects of successful athletic programs on soliciting additional applications and donations by alumni and others. He postulated that universities continue to expand expenditures when they may fail to cover direct costs because the athletic programs may generate indirect benefits in other domains of sufficient value to make up the shortfall. The study stated that, “If students are indeed more likely to apply to an institution with a successful athletic program…such schools will be more selective than others on…the average SAT scores of entering freshmen.” McCormick and Tinsley (1987) validated this by asserting that freshmen entering a school would have an average SAT score about thirty-three points higher than it would if it did not have a big-time athletic program. They estimated a multiple regression in which the average SAT score was dependent on several variables, including whether the school had a thriving athletics program. Their data came from about 150 schools for the year 1971, sixty-three of which had big time athletic programs.

The opportunity to participate in athletics is a primary consideration for students (Cigliano, 2006). One community college president stated that the athletic program attracted between eighty to one-hundred students who would not be attending college if the athletic program were not available for them. Another said that sports had a significant impact on enrollment because of the influence athletes had in attracting girlfriends, friends, and peers.

Academic Performance

Student athletes in Colorado were shown to have ‘significantly higher’ grade-point averages than their non-sporting counterparts (NHFS, 2003). Those in Jefferson County high schools were also shown to have higher grade-point averages than their non-sporting peers. The latter school district has matched the academic success of its students with success on the playing field (NHFS, 2003).

Schildnecht (2002) quoted studies by the North Carolina High School Athletic Association, the Colorado Department of Education, and the American College testing services to show that students who participated in sports performed better academically. Student athletes were also found to be more likely to graduate than their non-athletic counterparts.

In one study, which goes against the idea of athletics having a positive relationship with graduation rates, Mangold, Bean, and Adams (2003) explored the impact that athletic programs have on institutional graduation rates. Data on graduation rates for ninety-seven universities competing in NCAA Division IA basketball and football were regressed on several predictors. The results of the study did not support the hypothesis that colleges with successful sports programs would have higher graduation rates for students in general. On smaller campuses, involvement in a successful sports program was suggested to conflict with academic goals. This study provides an example of the post hoc fallacy. There’s probably some third variable that explains this negative relationship.

Lucas and Lovaglia (2002) found that non athletic scholars anticipated higher benefits from academic success than athletes. Their study, for which the sample was 135 students (of which thirty-three were athletes), sought to measure the perceptions of student athletes and non athletes regarding cost, benefit, and motivation towards academic success. They reported that student athletes had a lower motivation to perform academically than non athletes. This does not, however, necessarily support the notion that athletes struggle academically as compared to non athletes, as the authors suggested.

A study was done by Meier, Robinson, Polinard, and Wrinkle (2000) to see if pursuit of athletic goals had a negative impact on academic interests of universities as reflected by scores on the SAT and ACT. The data for the analysis came from Texas school districts for the years 1997-1998. Athletic budgets were found to have no relationship with school attendance. However, the study concluded that athletic budgets had a significant negative relationship with academic performance, although the statistical significance of the variables is unknown. The study acknowledges that there are positive benefits at the individual level. Whatever these impacts may be, it is tempting to suggest that these individual benefits, across the district, could collectively override the negative results of athletics across academic institutions.

Donations

Having reviewed literature pertaining to alumni donations, Frank (2004) concluded that there is evidence that links athletic success to alumni giving. Rhoads and Gerking (2000) also analyzed the role of success in intercollegiate football and basketball in attracting donations to universities from alumni and other sources. Results from regression analysis of panel data from eighty-seven universities showed that, year to year, changes in athletic success had a positive impact on alumni giving. Other donors were not as responsive. Longstanding athletic traditions were shown to attract charitable donations.

Clotfelter cited participation in extracurricular activities and athletics as one of the factors that affected alumni giving (2001). The study utilized a data set of graduates from fourteen private institutions and sought to establish factors associated with alumni donations. The data covered cohorts of individuals who entered the institutions in the fall of 1951, 1976, and 1989. The findings showed that over half of all donations were given by only 1% of all alumni, most of whom contribute annually.

In a 2000 study of 2,822 Vanderbilt University graduates, Dugan, Mullin, and Siegfried investigated alumni giving behavior during the eight years following their graduation. A probit model and a regression were run on the data of givers and non givers. Participation in athletics was found to generate a stronger sense of attachment to the university through group membership, a factor which would have a positive effect on giving. In addition, former athletes receive solicitations from special clubs of former athletes apart from the usual appeal for alumni contributions. For that reason, they are expected to contribute more than other graduates. Students who were members of athletic teams responded more favorably to requests for donations after graduation.

A Chance to Continue in Sport and Education

The awarding of scholarships to athletes affords the chance to further academic interests (Schildnecht, 2002). Athletic directors in Cigliano’s (2006) study expressed that athletics, “provides education for a group of people who might not be able to have an education.” Dropping athletic programs from state universities and community colleges would have the undesirable effect of removing opportunities for many student-athletes to follow their career goals and obtain an education while pursuing future success in athletics. For most, this will be the peak time of their sporting careers. Few venture into professional sports after college.

Negative Effects

A few issues can be raised concerning the negative effects of participation in college sports. Athletics consume time. Often, the athlete has to cope with the stress of attending to sporting obligations while fulfilling academic requirements. They have to submit assignments at the same time as every other student. For those who are not on scholarship, their families have to bear the increased burden of giving them pocket money, since they cannot manage jobs to supplement their incomes.

Stieber (1991) mentions the presence of a black market for athletes. In this situation, a supply and demand for cheaters exists coordinated by national sports bodies. The student athlete is generally discriminated against. The market for athletes is not a free market. It is, in reality, a monopoly. The buying cartel “exploits by eliminating the bidding process among its membership” (Stieber, 1991, p446). The resulting wage is lower for the athlete than what would be obtained in an uncontrolled market. The authors of this paper believe that Stieber’s argument would only hold for the very top tier of institutions, which have major revenue streams associated with football and basketball. For the other non-football and basketball athletes in those institutions and for the athletes in the rest of higher education, a full or partial scholarship may be more than the free market would generate.

Colleges have difficulty recruiting students who are good athletes and academically talented. Cigliano (2006) mentioned an apparent lack of preparation for college work for some of the student-athletes. However, this applied for the rest of the student body as well. Thus, it is not specific to student athletes.

Yiannakis et al. (2003) stated that sports were perceived to increase pollution by 62% of the respondents. Also, crime, gambling, alcohol abuse, and other illegal activities were viewed as increasing by up to 45%. Vandalism, assaults, and drug abuse were also feared to be increasing. There is a need, however, to establish the extent to which particular sports programs have a negative impact on a particular environmental setting.

Conclusions:

Athletics are beneficial to student athletes, to universities, and to society at large. Research points almost incontrovertibly towards the advantages associated with intercollegiate sports. National bodies responsible for sports are generally pleased with the results that athletics yield and would not support plans to reduce support for sports. However, athletes have to work under stressful conditions because of tight schedules and the demanding nature of their work. In some cases, student athletes are exploited by unscrupulous individuals and sports organizations. Ultimately, though, the benefits of athletics outweigh the disadvantages, albeit they are difficult to quantify.

Footnotes:

1 Gelsey Lynn, a cross country runner, as quoted by Depew, R (1999).

2 As cited by Posten, M. (1998).

3 The Mental Health Foundation: Football and Mental Health (n.d)

References:

Akandere, M. and Tekin A. (2002). The effect of physical exercise on anxiety: The Sport Journal Volume 5, Number 2.

Athletic policy manual of Duke University (2003). Retrieved May 18, 2006 from

Click to access Athletic%20Policy%20Manual.pdf

Bailey, K., Moulton, M., & Moulton, P. (1999). Athletics as a predictor of
self-esteem and approval motivation: The Sport Journal Volume 2, Number 2.

Chapin (2002). Identifying the real costs and benefits of sports facilities. Lincoln Institute of Land Policy, Working Paper.

Cigliano, L. M. (2006). A perceptual study of the impact of athletic programs in selected community colleges in the State of Tennessee: PhD Dissertation, East Tennessee State University.

Clotfelter, C. T. (1999). Who are the alumni donors? Giving by two generations of alumni from selective colleges. Nonprofit Management and Leadership. Vol 12(2). Pages 119-138

Coats, R. M., and Cox, K. C., (April 14, 2004). Economic impact of NSU athletics Retrieved May 29, 2006 from http://www.slec.org/uploads/EconomicImpact.pdf

Depew, R. (1999). Kenyon athletes define “Role Models” in their own words. Vol. 1(2). Retrieved June 12, 2006 from http://www2.kenyon.edu/orgs/Ksai/features/features11992.htm#sheridan

Dugan, K. Mullin, C. H. & Siegfried J. J. (2000). Undergraduate financial aid and subsequent giving behavior: Williams Project on the Economics of Higher Education. Discussion Paper No. 57. Retrieved June 15, 2006 from
http://opus.zbw-kiel.de/volltexte/2005/3672/pdf/DP-57.pdf

The Mental Health Foundation: Football and mental health (n.d) Retrieved June 23, 2006 from http://www.mentalhealth.org.uk/page.cfm?pageurl=football.cfm

Frank, R. H. (2004). Challenging the myth: A review of the links among college athletic success, student quality, and donations: Prepared for the Knight Foundation Commission on Intercollegiate Athletics.

Gerking, S., & Rhoads, T. A. (2000). Educational contributions, academic quality, and athletic success. Contemporary Economic Policy, 18, 248-254.

Lucas, J. W. and Lovaglia, M. J. (2002). Athletes’ expectations for success in athletics compared to academic competition: The Sport Journal Volume 5, Number 2.

McCormick, R., & Tinsley, M. (1987). Athletics versus academics? Evidence from SAT scores: Journal of Political Economy, Vol. 95: 1103-1116.

Mangold, William D. (2003). The impact of intercollegiate athletics on graduation rates among major NCAA Division I universities: Implications for college persistence theory and practice. The Journal of Higher Education Vol.74( 5), pp. 540-562. The Ohio State University Press.

Meier, K. J., Robinson, S., Polinard, J. L., & Wrinkle R. D. (2000). A question of priorities: Athletic budgets and academic performance. The Texas Educational Excellence Project.

National Federation of High Schools Association (NFHS), (2003). Survey resources: The case for high school activities. Retrieved September 3, 2005 from http://www.nfhs.org/scriptcontent/Va_custom/vimdisplays/contentpagedisplay.cfm?content_ID=163

Posten, M. (1998). Basking in glory and cutting off failure. Retrieved March 14, 2006 from http://www.units.muohio.edu/psybersite/fans/bc.shtml

Pulsinelli, R.W., Borland, M. V., & Goff, B. L., (1989). Western Kentucky University’s athletic program: Financial burden or boon? Department of Economics, Western Kentucky University.

Rudd, A. & Stoll, S. (2004). What type of character do athletes possess? An empirical examination of college athletes versus college non athletes with the RSBH Value Judgment Inventory: The Sport Journal Volume 7, Number 2.

Schildknecht, J. (2002). Benefits of interscholarstic athletics: schooling in American society. Retrieved September 23, 2005, from
http://filebox.vt.edu/users/jschildk/portfolio/documents/Benefits%20of%20Interscholastic%20Athletics.doc

Stieber, J. (1991). The behavior of the NCAA: a question of ethics. Journal of Business Ethics. Retrieved June 13, 2006 from http://proquest.umi.com/pqdweb?index=5&did=572547&SrchMode=1&sid=1&Fmt=6&VInst=PROD&VType=PQD&RQT=309&VName=PQD&TS=1130169395&clientId=28564

Toma, J. D. & Cross, M. (1996). Intercollegiate athletics and student college choice: understanding the impact of championship seasons on the quantity and quality of undergraduate applicants. ASHE Annual Meeting Paper. http://www.edrs.com

University of North Carolina at Charlotte. Institutional plan 2004 – 2009. Retrieved May 18, 2006 from http://www.provost.uncc.edu/planning/lrp/institutional.pdf

Yiannakis, A., Douvis, J., & Murdy, J. (2003). Perceived impacts of sport: measuring the impacts of sport: Methodological and policy considerations V6. 174.

2017-05-31T13:19:14-05:00March 14th, 2008|Contemporary Sports Issues, Sports Facilities, Sports Management, Sports Studies and Sports Psychology|Comments Off on Non-Economic Societal Impacts of Intercollegiate Athletics

Acclimatization in High-Altitude Sport: Predictive Modeling of Oxygen Saturation as an Expedition Management Tool

Abstract:

A management perspective is taken in developing a predictive model to forecast blood oxygen saturation levels for trekkers and mountaineers ascending to high altitudes. Blood oxygen saturation is an important indicator of risk of acute mountain sickness and other potentially lethal health risks for high-altitude athletes. This model is based on data collected from a seventeen-person expedition to Mt. Everest. The results of the model are compared to actual saturation levels and the model is found to be a good predictor. The practical implication is that an oximeter and the results it produces are useful tools for expedition managers and base camp managers charged with the safety of a multi-person expedition.

(more…)

2018-06-05T09:12:13-05:00March 14th, 2008|Sports Exercise Science|Comments Off on Acclimatization in High-Altitude Sport: Predictive Modeling of Oxygen Saturation as an Expedition Management Tool

Introducing a Risk Assessment Model for Sport Venues

Abstract:

With the ‘unknown certainty’ of terrorist actions and fan behavior, it is impossible to ensure a risk-free environment at America’s sporting venues. Incidents will happen and emergencies will arise. It is a matter of how one prepares, responds, and recovers to mitigate the consequences of emergencies at a sporting venue. Sport venue managers need to be aware of risk assessment methodologies to detect threats, identify vulnerabilities, and reduce consequences. Information gathered through this process is extremely valuable for enhancing security measures. This article discusses risk assessment and analysis, addresses the need for risk assessments at sporting venues, and describes the sport-specific risk assessment model developed while conducting research through a Homeland Security grant.

Introduction:

Sport lost its innocence on September 5, 1972, at the Olympic Games in Munich, Germany (CNN.com, 2002). A Palestinian group known as Black September crept into the Olympic Village and took nine members of the Israeli team hostage. The captors demanded a safe exit out of Germany and the release of Palestinian prisoners held in Israeli jails (2002). Unfortunately, a failed rescue attempt led to the death of all nine Israeli hostages, five terrorists, and one German policeman (2002). “For the first time, world sport had become a victim of terrorism, bringing with it a brutal reminder of the world’s harsher realities” (2). Terrorism struck again in 1996. A ‘domestic terrorist’ was responsible for the Centennial Olympic Park bombing at the Atlanta Games. This incident killed one person and injured more than 100 (CNN.com, 1996). Regardless of the motives for these attacks, terrorists chose to act on a world stage that offered global exposure for their cause. The incident in which an Oklahoma student prematurely detonated a bomb strapped to his body outside a football stadium packed with 84,000 in October 2005 (Hagmann, 2005), and the most recent threat of a dirty bomb attack on several NFL stadiums in October 2006 (CNN.com, 2006), emphasize the fact that sport venues are an attractive target for potentially catastrophic consequences. Besides terrorism, sport venue managers must plan for other incidents or unexpected disasters, such as fan/player violence or natural hazards.

One problem that sports venue manager’s face is determining the potential threat level, “causing leagues, teams and venues to prepare for a range of possible incidents at their facilities and to maintain close contact with federal, state and local law enforcement representatives regarding possible threats” (Hurst, Zoubek, Pratsinakis, n.d., p. 4). The risk assessment process is a way to determine risk and threat levels and identify vulnerabilities. “A good risk management approach includes three primary elements: a threat assessment, a vulnerability assessment, and a criticality assessment.” (Decker, 2001, p. 1). These assessments provide vital information for the protection of critical assets against terrorist attacks and other threats. Sport venue managers are able to identify vulnerabilities and thus harden the facility and improve physical protection systems. This may include implementing access controls, using CCTV security cameras, adding lighting, encouraging background checks, credentialing, checking backpacks, enhancing communication networks, and developing or updating emergency response and evacuation plans.

Understanding Risk

“Risk is the possibility of loss resulting from a threat, security incident, or event” (General Security Risk Assessment Guideline, 2003, p. 5). Risk is inherent in almost all aspects of life. Sport venue managers must continually attempt to minimize risk at their facilities. Risk cannot be totally eliminated from the environment, but with careful planning it can be managed. “Risk management is a systematic and analytical process to consider the likelihood that a threat will endanger an asset, individual, or function and to identify actions to reduce the risk and mitigate the consequences of an attack” (Decker, 2001, p. 1).

Risk is best understood as the product of the consequence of an event and the probability of the event occurring: Risk = Consequence x Probability (“Risk 101”, n.d). Risk increases as the consequences and probability of occurrence increases (n.d.). “In order to manage risk, it must first be identified, measured, and evaluated” (4). The Vulnerability Methodologies Report (2003) issued by the Office for Domestic Preparedness, Department of Homeland Security, identified three types of risk: mission or function risks, asset risks, and security risks. Mission risks prevent an organization from accomplishing a mission. Asset risks may harm an organization’s physical assets. Security risks have the potential to cripple actual data and people (2003).

Sport facility managers identify risks through various means. They can conduct surveys of attendees, conduct inspections of the facility, interview present employees, or ask experts in the field (Ammon, Southall, & Blair, 2004). Sport facility managers must address primary and secondary factors in order to reduce risk (2004). Primary factors are identified in the standard operating procedures. Facility staff is included among these factors (2004). An unsupervised or improperly trained ticket taker, usher, or cashier can become a risk for the facility manager (2004). “A well-trained staff, educated about proper risk management procedures, can help the risk manager to identify potential risks” (p. 108). Secondary factors of risk faced by most sport facilities include weather, type of event, patron demographics, and facility location (2004).

The essence of risk is dependent on the potential of threats. “A threat is a product of intention and capability of an adversary, both manmade and natural, to undertake an action which would be detrimental to an asset” (Vulnerability Assessment Report, 2003, p. 11). Vulnerabilities expose the asset to a threat and eventual loss. The General Security Risk Assessment Guideline (2003) defines vulnerability as “an exploitable capability; an exploitable security weakness or deficiency at a facility, entity, venue, or of a person” (p. 5). A risk analysis evaluating the potential of loss from a threat will determine whether risk should be reduced, re-assigned, transferred, or accepted (Vulnerability Assessment Report, 2003). “An acceptable risk is the risk level that an individual or group considers reasonable for the perceived benefit of an activity” (“Risk 101”, n.d., Acceptable Risk 1). An acceptable level of risk is usually determined by the asset manager or owner (2003). Severe risks that cause a high degree of loss and occur frequently should be avoided (Ammon, Southall, & Blair, 2004). Average frequency and moderate severity risks can be transferred to someone who’s willing to assume the risk. The facility manager may decide to pay an insurance company to cover physical and financial damages (2004). Some facility mangers may decide to keep or retain the risk. In so doing, they become financially responsible (2004). Facility managers can reduce risk through staff training, preventative maintenance, and development of a risk management plan to be included in the standard operating procedure (SOP) (2004). “The SOP is a set of instructions giving detailed directions and appropriate courses of action for given situations. SOP’s should be developed for all risks,” (Farmer, Mulrooney, & Ammon, 1996, p. 81).

In order to determine threats and vulnerabilities, an organization must undergo a risk assessment. The Department of Homeland Security issued a ten-step risk assessment methodology criterion (Vulnerability Assessment Report, 2003):

  • Clearly identify the infrastructure sector being assessed.
  • Specify the type of security discipline addressed, e.g. physical, information, operations.
  • Collect specific data pertaining to each asset.
  • Identify critical/key assets to be protected.
  • Determine the mission impact of the loss or damage of that asset.
  • Conduct a threat analysis and perform assessment for specific assets.
  • Perform a vulnerability analysis and assessment to specific threats.
  • Conduct analytical risk assessment and determine priorities for each asset.
  • Be relatively low cost to train and conduct.
  • Make specific, concrete recommendations concerning countermeasures.

This is general in nature and may be adapted to meet the needs of a specific organization. Several other risk assessment models exist today. For example, Sandia National Laboratories developed the RAM-Chemical to assess chemical facilities in the United States. Sports facilities in the U.S. must embrace risk management processes. Identifying the greatest threats and eliminating or reducing vulnerabilities will help minimize risk at sports events. “A sports arena is always critical as a high value terrorist target because of the potentially high casualty rate” (Durling, Price, & Spero, 2005, p. 8). Whether facing a terrorist attack, natural disaster, or unruly fan behavior, sport venue managers must pursue an effective risk management approach to protect the facility and human lives.

The Sports Event Security Assessment Model (SESAM)

In May, 2005, the Department of Homeland Security, in conjunction with the Mississippi Emergency Management agency, awarded the University of Southern Mississippi a $568,000 research grant to create a research-based model for the security management of university sport venues. Several risk assessment methodologies were reviewed and the DHS risk assessment criterion was customized for the assessment of sport venues. The Sport Event Security Assessment Model (SESAM) was developed through the collaboration of academic and security professionals in a six-hour brainstorming session. Academic professionals with experience in the sport event security area and training in DHS threat/risk assessment participated. Security professionals included former employees of the FBI, CIA, and Secret Service with extensive background in risk assessment methods and vulnerability assessment experience in the security and sport security field. This collaborative group supported the development and field testing of the model. A seven step procedure was created to evaluate sport security operations. An overview of the SESAM is presented in figure 1.

A risk assessment was conducted of the sport operations at seven public universities in Mississippi between May 2005 and February 2006. The following highlights the critical points during each stage of the seven-step process:

1. Step 1 of the process involves the identification of a SESAT team, including all key personnel responsible for game day security. These may include the athletic facility manager, campus police chief, emergency management director, local sheriff, and/or campus physical plant facility manager. Once the SESAT is established, meetings and interviews are scheduled to provide assessment objectives and define the assessed area based on a one mile radius of the sport venue.

2. Characterization of assets and target identification are achieved through in-depth surveys and interviews at each sport facility. Campus and community assets are identified and prioritized. Critical infrastructure and existing physical protection countermeasures are also identified. The target attractiveness is finally evaluated.

3. The threat assessment focuses on potential threat elements on campus and in the surrounding community. Specific factors are taken into consideration, including the existence of a group/individual operating close to the venue, history or past activity of the group/individual, intentions of the potential threat to act, their capability to act, and the ultimate targeting of the sport venue. A threat level is assigned to each critical asset, which is identified during step 2 of the risk assessment process.

Figure 1: Sport Event Security Assessment Model (SESAM). Adapted by Robert Rolen, Walter Cooper, Lou Marciani, and Stacey Hall. The Center for Spectator Sports Security Management.

4. The vulnerability assessment is a key component of the risk assessment model involving the analysis of several key factors about the venue, including:

  1. Level of Visibility: assess the awareness of existence and visibility of the sport venue to the general public.
  2. Criticality of Sport Venue to the Jurisdiction: assess the usefulness of the sport venue to the local population, economy, or government.
  3. Potential Sport Venue Population Capacity: assess the maximum number of people at a site at any given time.
  4. Potential for Collateral Mass Casualties: assess potential mass casualties within a one-mile radius of the sport venue.
  5. Impact Outside of the Venue: assess the loss outside of the sport venue.
  6. Existence of CBRNE Elements: assess the presence of a legal WMD on the site.
  7. Potential Threat Element Access to Sport Venue: assess the availability of the sport venue for ingress and egress by a PTE.

5. The consequence evaluation component analyzes the number of potentially injured people at the sport venue who might require transportation/hospitalization. It also assesses the loss of life, loss of infrastructure, economic and environmental impact, and the potential social trauma.

6. The overall risk level of a sport venue is calculated during this step. The risk assessment evaluates the threat potential (produced during step 3), likelihood of adversary success (produced during step 4), and severity of the consequences of an attack (produced during step 5). A final risk level is determined for the sport venue based on a scale of 0 to 5, with 0 being low and 5 being the greatest. It is the sport manager’s responsibility to determine what level is acceptable for the venue.

7. The final step involves the proposal of

consequence reduction

measures. These recommendations will help sport managers develop and/or enhance security policies and procedures, emergency response capabilities, and physical protection systems and capabilities at the venue. Also, suggestions for appropriate training in security awareness for staff and the sporting public are recommended.

The SESAM is a cyclical model, as assessments must be continuously completed to ensure that adequate plans and security measures are in place and maintained over a period of time. A sport venue’s threat or vulnerability level may change regarding circumstances in the country or even in the surrounding community. Evaluations of potential threats and existing vulnerabilities “are not only used to determine what dangers to prepare for and how to meet them, but also to prioritize preparedness efforts.” (Sauter & Carafano, 2005, p. 338). By determining which threats are the most dangerous, managers are able to decide where they should invest their time and effort in preparing to deal with the consequences of a potential incident (2005). The risk assessment process is also considered by most specialists “to be the most vital task establishing an effective business continuity/disaster recovery plan” (p. 338). Contingency planning will aid sport businesses in recovery efforts and continuation of operations during incidents.

Conclusion:

“On September 11th, it became abundantly clear that stadium and arena operators needed to incorporate security safeguards at America’s sporting venues.” (Pantera et. al, 2003, 1). It is critical that all sport organizations complete a risk assessment of their sport venues in order to identify vulnerabilities and improve security measures. The sport organization should not become complacent or content with their current security practices. Sport programs in America are faced with an ongoing battle to stay alert and be prepared for the ‘unthinkable.’

References:

Ammon, R., Southall, R. & Blair, D. (2004). Sport facility management: Organizing events and mitigating risks. Morgantown, WV: Fitness Information Technology, Inc.

CNN.com. (1996, July 27). Sources: arrest in Olympic bombing could occur within days. Retrieved September 15, 2005, from http://www.cnn.com/US/9607/27/blast.am/index.html

CNN.com. (2002, September 5). When sport lost its innocence. Retrieved September 26, 2005, from http://archives.cnn.com/2002/WORLD/europe/09/05/munich.72/

CNN.com (2006, October 18). Threats against NFL stadiums not credible. Retrieved October 18, 2006, from http://www.cnn.com/2006/US/10/18/football.threats/index.html

Decker, R.J. (2001). Key elements of a risk management approach. United States General Accounting Office. [On-line]. Available: http://www.gao.gov/new.items/d02150t.pdf

Durling, R.L., Price, D.E., & Spero, K.K. (2005). Vulnerability and risk assessment using the Homeland-Defense operational planning system (HOPS). Retrieved October 4, 2005, from http://www.llnl.gov/tid/lof/documents/pdf/315115.pdf

Farmer, P.J., Mulrooney, A.L., & Ammon, R. (1996). Sport facility planning and management. Morgantown, WV: Fitness Information Technology, Inc.

General Security Risk Assessment Guideline. (2003). ASIS International. [On-line]. Available: http://www.asisonline.org/guidelines/guidelinesgsra.pdf

Hagmann, D.J. (2005, October 30). Black hole in America’s heartland. Northeast Intelligence Network. Retrieved July 20, 2006, from http://www.homelandsecurityus.com/site/modules/news/article.php?storyid=16

Hurst, R., Zoubek, P., & Pratsinakis, C. (n.d.). American sports as a target of terrorism: The duty of care after September 11th. [On-Line]. Available: www.mmwr.com/_uploads/UploadDocs/publications/American%20Sports%20As%20A%20Target%20Of%20Terrorism.pdf

Pantera, M.J., et. al. (2003). Best practices for game day security at athletic & sport venues. The Sport Journal, 6 (4). [On-Line]. Available: http://www.thesportjournal.org/2003Journal/Vol6-No4/security.asp

Risk 101. (n.d.). U.S. Coast Guard. Retrieved October 4, 2005, from http://www.uscg.mil/hq/gm/risk/background.htm

Sauter, M. A. & Carafano, J.J. (2005). Homeland Security: A complete guide to understanding, preventing, and surviving terrorism. New York, NY: McGraw Hill.

Vulnerability Assessment Report. (July, 2003). Office of Domestic Preparedness, U.S. Department of Homeland Security. Retrieved May 31, 2005, from http://www.ojp.usdoj.gov/odp/docs/vamreport.pdf

2016-10-12T14:50:00-05:00March 14th, 2008|Contemporary Sports Issues, Sports Facilities, Sports Management|Comments Off on Introducing a Risk Assessment Model for Sport Venues

Gender-specific Aspects of Football Expertise: Implications of Two Prospective Observation Studies

Abstract:

Women and men differ in many aspects of life; among these, their view of sport activities differ considerably. Thus, football (soccer) and the prediction of football results are recurrent sources of stress. Despite this, until now no study has investigated the parameters affecting football expertise in detail. We performed two prospective observation studies in health care employees to investigate whether football expertise, as a parameter combining behavioural, social, and physical aspects of life, is related to gender or anthropometric parameters.

The first study was performed in 2004 during the UEFA European Cup in Portugal. In order to confirm the results of the initial study, a second study was performed during the FIFA World Cup 2006 in Germany. A total of 307 persons were included in the studies. All volunteers had to predict the results of the preliminary round of the respective tournament. An evaluation of the results was done by scores, which were given for correct tendency and correct numbers of goals for each team.

In the first study, a significant difference between male and female participants was found (46.7 ± 1.3 pts, n=41 f: 42.7 ± 1.4 pts, n=42; p = 0.03). This was confirmed in the second study, which had a total of 224 participants. Here, male participants scored significantly higher than female participants (m: 113.9 ± 1.0 pts; f: 108.7 ± 1.3pts; p = 0.004). This difference remained significant in both studies after adjustment for age, profession, and BMI. Despite the fact that the majority of “couch potatoes” are supposed to be outstanding football experts, no relation between BMI and the ability to predict football results was found.

We demonstrated that men perform better in predicting football results than women. This finding was confirmed in a second independent cohort. The consequences of this apparent discrepancy between these gender specific realities on men’s health and the question of whether advertisement and television increasingly favour promoting women as football experts remain to be determined.

Introduction:

Football (soccer) expertise depends on psychological, social, and physiological factors. Despite the apparent impact of this topic on daily life, no study has investigated the parameters affecting football expertise in detail until now. In particular, the question of whether gender is important for individual football expertise is recurrent, due to a lack of valid studies and often irrational debate. Initially, football was dominated on and beside the football field by males. The classical roles were described; the male was the football expert, who rarely played football himself, watched football on TV, and liked to analyse previous games. On the other hand, women tried to avoid watching football games if possible and judged it simply as a sport with twenty-two men running for one ball. Therefore, discussions between males and females about this topic have been often dominated by males.

In recent years, this picture has changed remarkably. Apart from a considerable number of female football players and increasing interest by the media for professional female football, an increasing number of female football supporters have been registered (Member Statistics 2005 German Football Association). This has resulted in changes in the typical behavioural roles in relation to football. Indeed, football discussions often result in quarrels. These discussions are often passionate and lack rational bases. Taking all this together, there is certainly a considerable chauvinism in terms of supposed football expertise. Whether this is justified is completely unclear.

Therefore, we performed the first study to investigate whether football expertise, as a parameter combining behavioural, social, and physical aspects of life, is related to gender. Since men and women are apparently different in aspects potentially influencing football expertise, among them anthropometry and social status, we included these parameters in our multivariate analysis.

Methods:

The first study was performed in 2004 during the UEFA European Cup in Portugal. Participants for this study were recruited by e-mail and personal communication at the Charité-University Medical School Berlin and the German Institute of Human Nutrition. A total of eighty-three volunteers were recruited. Apart from personal information, all participants had to predict the results of the preliminary round. In total, there were twenty-four games.

To confirm the results of the initial study, a second study (study II) was performed during the 2006 FIFA World Cup in Germany. Participants of this study were recruited by Internet and intranet from the Charité-Medical School Berlin. Two hundred and forty-one persons agreed to participate in this study. However, due to missing data, seventeen individuals had to be excluded from final analysis so that a total of 224 persons were ultimately included in this study. All volunteers had to predict the results of the preliminary round of the FIFA World Cup 2006. In total, there were forty-eight games. Baseline characteristics of the volunteers of both studies are presented in Table 1. Additional questions about profession and occupational localization were asked.

Table 1: Baseline characteristics of volunteers in Study I and Study II. P-values for reached points were adjusted for BMI, age, profession, and workplace.

A) Study I: UEFA EC 2004

Males Females p-value
Participants 41 42
Points 46.7 ± 1.3 42.7 ± 1.4 0.03
BMI (kg/m2) 23.3 ± 0.7 22.5 ± 0.5 0.34
Age (y) 32.2 ± 1.2 34.5 ± 1.6 0.25

B) Study II: FIFA WC 2006

Males Females p-value
Participants 132 92
Points 113.9 ± 1.0 108.7 ± 1.3 0.004
BMI (kg/m2) 23.7 ± 0.2 22.2 ± 0.4 0.001
Age (y) 35.0 ± 0.7 36.6 ± 1.0 0.18

A total of 307 persons were included. An evaluation of the results was done by scores given for correct tendency and correct numbers of goals for each team. For correct tendency, three points were given and for correct number of goals for one team, one point was given. In one game, a maximum of five points could be achieved.

Statistics:

Statistical calculations were performed with SPSS 12.0 (SPSS Inc., Chicago, IL, USA). All values are given as mean ± standard error. Unpaired T-test was applied if parameters were normally distributed, otherwise Mann-Whitney-U test was used. Multivariate analysis was performed by General Linear Model procedure. Correlations between variables were investigated by Pearsons coefficient of correlation. An alpha-error below 5% was considered to be statistically significant.

Results:

In Study I during the 2004 EC in Portugal, a significant difference between males and females was found in eighty-three individuals (m: 46.7 ± 1.3 pts, f: 42.7 ± 1.4 pts; p = 0.03). This result was confirmed in Study II, which had a total of 224 participants. Here, male participants scored significantly higher than female participants (m: 113.9 ± 1.0 pts; f: 108.7 ± 1.3 pts; p = 0.004).

We next speculated that differences in anthropometry might affect these results, given that “couch-potatoes” might score differently than lean and fit individuals. However, no significant correlation was found between BMI (2006: r = 0.061; p = 0.391; 2004: r = 0.001; p = 0.991) and football expertise (Figure 1) in either study. Correspondingly, the gender specific difference of football expertise remained significant in both studies after adjustment for age and BMI.

Figure 1: Males show higher football expertise compared to female participants in the studies. Results were adjusted for age, profession, and BMI.

Figure 1:

a) FIFA WC 2006 b) UEFA EC 2004
Figure 1 a Figure 1 b

While no significant differences between physicians and non-physicians could be observed in Study I, physicians had significantly more points than non-physicians in Study II (P: 114.3 ± 1.3 pts, N.P.: 110 ± 1.1 pts; p = 0.007, figure 2). In the WC 2006 study, a more detailed analysis on the influence of profession was performed. The analysis of working areas showed that neurologists and psychiatrists had the highest levels of football expertise, while the lowest results were achieved by the members of the departments of pediatrics (internal medicine: 111.1 ± 1.3 pts, neurology/psychiatry: 115.2 ± 2.6 pts, pediatrics: 109.8 ± 4.4 pts, surgical departments: 112.1 ± 3.2 pts, radiology: 112.1 ± 5.2 pts, others: 109.7 ± 2.3 pts, administration: 111.3 ± 3.2 pts). Although apparently of considerable interest, none of these differences reached statistical significance. We additionally tested whether profession or workplace affected the relation between gender and football expertise. Although profession had a significant influence in Study II (p = 0.03), the gender-specific difference remained significant in both cohorts.

Subsequently, the relation between professional experience and football experience was tested in physicians. Although senior registrars had significantly more points than all other groups, especially the directors of the clinics (directors: 111.5 ± 9.7 pts, senior registrars: 118.6 ± 2.6 pts, SHO: 113.0 ± 1.5 pts, care staff: 109.3 ± 2.3 pts, scientist: 110.6 ± 1.6 pts, administration: 108.8 ± 3.2 pts, technicians: 108.9 ± 3.3 pts, students: 113.8 ± 2.8 pts), these differences were not statistically significant.

Discussion:

We demonstrate that men predict football (soccer) results more accurately than women. Thus, the widespread chauvinism in terms of football expertise appears to be partially justified. However, it is important to note that gender accounts for only about 5% of the variability of football expertise. Thus, additional, not-yet identified factors are apparently predominantly responsible for the individual football expertise.

Differences in health care between genders were recently acknowledged as important neglected points; these are part of the ongoing competition between men and women (1). The gender confrontation can also be found in the field of sports, which is not exclusive to the sport itself but includes parasportive activities (2). Football is among the most discussed topics, especially during globally communicated events like the recent FIFA World Cup (3;4). The classical role, which is also often presented by the media, characterises men as football experts, while women are neglected in that context. In recent years, this picture has changed considerably. Women are increasingly recognised as a potential focus of advertisement in the environment of sport events. Consequently, more and more women are presented as experts, i.e. in television broadcasts, which clearly challanges the classical role of the man being the football expert.

Our results indicate that in the general population, men are still better qualified to predict football results than women. Thus, any overemphasis with respect to women in that context is in contrast to the existing reality. The health consequences of such undeserved discrimination are unclear, but may finally result in inferiority complexes or aggression in men, which remains to be determined. Some points of the study design should be mentioned. The presented data are based on healthcare workers and it is unclear whether they can be transferred to the general population. In addition, the ability to predict football results is unlikely to represent the whole spectrum of football expertise. Another important topic addressed here was the relation between anthropometry and football expertise. Although no direct association with BMI was found, a relation to abdominal obesity cannot be excluded. However, “couch potatoes,” who are likely to perform pretty well in football results prediction, are characterised by abdominal obesity, rather than simply elevated BMI. In addition, only about 20% of the cohorts had a BMI higher than 25 kg/m2. Thus, the study may have been underpowered to address this question sufficiently.

Figure 2: Physicians (P) in Study II (n=224) show a significantly higher football expertise than non-physicians (N.P.). Results are after adjustment for age, sex, and BMI.

Figure 2:

Figure 2

In summary, we demonstrated that men perform better in predicting football results than women. This finding was confirmed in a second independent cohort. The consequences on men’s health due to the apparent discrepancy between gender specific realities and the fact that advertisement and television increasingly favour women as football experts remain to be determined.

References:

Carroll D., S. Ebrahim, K. Tilling, J. Macleod, G.D. Smith. Admissions for myocardial infarction and World Cup football: Database survey. BMJ 2002; 325(7378):1439-1442.

Collin J., R. MacKenzie. The World Cup, sport sponsorship, and health. Lancet 2006; 367(9527):1964-1966.

Doyal L. Sex, gender, and health: The need for a new approach. BMJ 2001; 323(7320):1061-1063.

Tanaka H. The battle of the sexes in sports. Lancet 2002; 360(9326):92.

2016-10-19T10:11:08-05:00March 14th, 2008|Contemporary Sports Issues, Sports Studies and Sports Psychology, Women and Sports|Comments Off on Gender-specific Aspects of Football Expertise: Implications of Two Prospective Observation Studies

African-Americans in College Baseball

Abstract:

The under-representation of African-Americans in college baseball is evident. African-American athletes make up only 4.5% of all National Collegiate Athletic Association (NCAA) baseball players. They are a shrinking percentage of Major League Baseball players. A focus group was established to identify specific sociological issues which were perceived to influence the under-representation of African-Americans in collegiate baseball. Additionally, information from the observation of SEC baseball games during the 2006 season was used to quantify the social pattern. Data from the “traditionally black” Southwestern Athletic Conference (SWAC) and the Mid-Eastern Athletic Conference (MEAC) were also collected during the 2006 season. For the Southeastern Conference (SEC), fan attendance was less than 1% African-American and the player participation rate was 1.91 per team during the 2006 season. Additionally, none of the SEC head or assistant baseball coaches were African-American. The focus group determined that the reasons for the decline in numbers were related to (1) lifestyle factors, (2) competition from other sports and social opportunities, and (3) the absence of African-American role models in baseball. The authors propose that Title IX legislation and the influence of sports media were primary factors in the change.

African-Americans in College Baseball

The under-representation of African-Americans in college baseball is an obvious yet perplexing picture in athletics today. African-American athletes are more than equitably represented among many of the most popular collegiate spectator sports; however, their near absence in college baseball appears to be more than coincidental. Questions arise as to whether the educational system, the social system of athletics, and/or federal legislation have been responsible for the reduction in the number of African-American baseball players in America.

Only 4.5% of all National Collegiate Athletic Association (NCAA) baseball players were African-American during the 2004 season. This includes all divisions, in addition to the historically African-American colleges and universities. On the contrary, 42.0% and 32.3% of NCAA basketball and football players, respectively, were African-American in the 2003-2004 academic year (Bray, 2005).

When specifically examining one of the perennial collegiate conference baseball powers, the Southeastern Conference (SEC), only 4.2% of 2006 roster players were African-American, as noted in Table 1. The twelve universities that make up the SEC represent states with an average African-American population of 20.8%.

Ironically, when examining the historically black Mid-Eastern Athletic Conference (MEAC) and the Southwest Athletic Conference (SWAC), findings surface which again support the difficulty of finding African-Americans in collegiate baseball. African-Americans are the minority on many of the rosters of these teams, as seen in Table 1.

Table 1: African-American Participation and Attendance at SEC Baseball Games

University Number of African American Players State Population (African American) Number of African American Fans Average Attendance Number of African American Coaches
Alabama 1 26.0% 15 4172 0
Auburn 3 26.0% 7 3021 0
Arkansas 1 15.7% 0 7156 0
Florida 3 14.6% 8 2607 0
Georgia 1 28.7% 10 1958 0
Kentucky 1 7.3% 6 1250 0
Louisiana State 3 32.5% 8 7508 0
Mississippi 0 36.3% 2 4363 0
Mississippi St. 0 36.3% 3 6160 0
South Carolina 3 29.5% 22 3424 0
Tennessee 4 16.4% 5 1378 0
Vanderbilt 3 16.4% 3 1484 0
Alabama 1 26.0% 15 4172 0
Source: Attendance statistics from SEC member schools 2006. All observations of fan counts were from weekend games in spring 2005 and spring 2006. State African-American percentages were obtained from the United States Census Bureau.

With approximately 12.8% of the United States population reported to be African-American (United States Census Bureau, 2006), it would appear that African-American collegiate baseball players are under-represented. This is the case in both college and professional baseball.

Ken Williams of the Chicago White Sox, Major League Baseball’s (MLB) only African-American general manager, blamed the small number of collegiate scholarships designated for baseball on the small number of African-American players (Nightengale, 2006). Logan White, the Los Angeles Dodger’s amateur scouting director, noted that in his trips to colleges across the United States, he rarely encounters an African-American baseball player. Not only is the absence of the African-American player obvious at the collegiate level, the population has gone from 27% of Major League Baseball (MLB) players in 1975 to 8% today (Nightengale, 2006). Sociologists have recognized this trend and have proposed several theories to explain it.

Theories

A possible explanation for the diminishment of African-Americans in collegiate and professional baseball could be explained by Giddens’ (1979) “structuration” theory. This theory assumes that certain behaviors are shaped by an array of interconnected structures. These interconnected structures can include norms, accessibility, and facilitators. Norms are the expected behaviors that govern a culture. Facilitators can be individuals or events that increase the likelihood of engaging in a behavior. (The behavior in this case would be baseball.) Accessibility refers to the degree of availability a population has to baseball.

The Negro Leagues of the early part of the 20th century, in particular, provided African-Americans with access to a culture aligned with baseball. Prior to the integration of African-Americans into Major League Baseball (MLB) in 1947 (“African Americans in Sports,” n.d.), an estimated 2,300 African-Americans participated in professional baseball through the Negro Leagues (Lynn, 2006). In the 1920’s, even small African-American communities, such as the town of Buxton, Iowa, touted semiprofessional teams like the Wonders (Beran, 1990). African-American fans often traveled to surrounding states to watch the Wonders play. These games became a routine part of daily life for this community. Beran (1990) further noted that the games served as a gathering place for members of the community. As a result, the Wonders became a major part of the cultural identity of Buxton. Since the retirement of former Negro-League stars who went on to stellar careers in MLB, such as Henry Aaron, the number of both African-American baseball players and spectators has steadily declined in MLB (Early, 2000; Flanagan 1999).

Research by Odgen (2003a) suggested that television images may perpetuate the stereotype that African-Americans are not welcome in baseball venues. This is the basis for Odgen’s ‘Welcome Theory’, which states that certain groups feel a sense of belonging in some leisure activities, but not in others. Odgen found that African-Americans felt most welcome playing basketball and least welcome at country clubs. Feeling unwelcome in some leisure activities is not restricted to the African-American race. All races share a common attitude that activities are suited to some ethnicities more than others (Philipp, 1999). For example, of the 137 crowd shots at a particular televised baseball game, only one of them displayed a group of African-Americans (Odgen, 2003a). Furthermore, Ogden reported that only 3% of the attendance at a game dubbed “African-American Heritage Night” consisted of African Americans.

The Welcome Theory may be partially created by the extensive mass media edification of professional African-American basketball players (Hall, 2002). African-American youth are frequently shown that basketball is the most efficient route to fame and fortune. As a result, almost 80% of basketball players in the National Basketball Association (NBA) are African-American (Boyd, 1997).

Another factor that might explain the absence of African-Americans from baseball is a lack of social support for the game. A primary reason that children select extracurricular activity is for interaction with peers (Watson and Collis, 1982). Children naturally gravitate towards activities endorsed by peers within their social groups. The peers of African-American youth frequently endorse basketball instead of baseball by donning the apparel of their favorite NBA stars (Philipp, 1998; Wilson & Sparks, 1996).

Gravitation towards participation in sports other than baseball may begin at the youth level. Of the 2,000 youth players in select tournaments from 1998-2000, only 3% were African American (Odgen, 2001). Select leagues, also known as traveling teams, are the highest level of play in age-group baseball. These teams may be compiled from competitive tryouts and/or selecting players from other “all star” teams. Select team baseball is characterized by long and arduous seasons that may contain as many as 150 games for youth players (Odgen, 2003b). These teams often play games all across the country, which requires considerable travel expenses. This external demand may validate limited access as an explanation, if one assumes that African-Americans have less access to baseball leagues, select-travel teams, and fields. Baseball diamonds are documented more frequently in the suburbs than in the urban core, where the population of African-Americans is more heavily populated, further supporting the theory of a reduced access that African-American youth have to baseball (Odgen 2003b).

Efforts to Curb Disparity

Recently, several MLB celebrities and players have attempted to curb the lack of interest of African-Americans in the sport of baseball. Initiatives such as Reviving Baseball in Inner Cities (RBI), founded by John Young, a former major league player, have received funding from Major League Baseball (“Major League Baseball,” n.d.). RBI was created to enable inner city youth with reduced accessibility and funds to enjoy baseball. Since its inception in 1989, the RBI program has provided opportunities for youth baseball in more than 200 cities. Major League Baseball also sponsors a program known as the Urban Youth Baseball Academy (“Major League Baseball,” n.d.). Some former participants in this program have remained in baseball and are now professional baseball players. Another project, known as the Urban Initiative for Little League Baseball, plans to expand existing facilities and baseball programs in the inner cities (“Little League Online,” n.d. ). Professional players, such as Torii Hunter, have even spearheaded efforts to raise funds for the creation and maintenance of baseball facilities in low income areas (“The Torii Hunter Project,” n.d.).

After an examination of the literature, it appears that those who are associated with and who study baseball have taken note of the declining African-American population in the sport. The authors of this study attempted to quantify the number of African-Americans playing college baseball in several of the most visible collegiate conferences in America in an attempt to measure the magnitude of the social change.

Methods:

A focus group was established to assist in identifying specific sociological issues perceived to influence the under-representation of African-Americans in collegiate baseball. The focus group consisted of twelve college age, African-American males who were either currently on a NCAA Division II baseball roster or who had played baseball in high school but were no longer playing in college. The group met during the fall of 2006 in three, one-hour sessions over a one month period. The first meeting consisted of an introduction to the topic, followed by the distribution of the outline of this study. This was followed by a period of general brainstorming. The group was asked to investigate the literature related to this study topic before the next meeting. In the second meeting, the group continued brainstorming. Members were allowed to present findings from the previous week of research and to begin extrapolating reasons for the social change in baseball. Common themes among the focus group were identified. In meeting three, the focus group began the process of assembling and ranking its theories for the reduction of African-Americans in collegiate baseball.

In addition to the qualitative, focus group study, the authors gathered data from NCAA data bases and from observation of SEC baseball games during the 2006 season. The authors personally attended and collected SEC baseball attendance data by conducting visual counts of African-American fans and players at select SEC games during the 2006 season.

For point of interest purposes, data from the Southwestern Athletic Conference (SWAC) and the Mid-Eastern Athletic Conference (MEAC) were collected by examining the media publications of each member institution’s athletic website for the 2006 season. The schools in these two conferences are known as historical black colleges and universities (HBCU) with predominantly African-American populations. The authors attempted to secure the numbers of African-American baseball players and coaches from these conferences.

Results:

Examinations of the findings in Table 2 depict an SEC baseball fan attendance base that was 0.2% African-American during the 2006 season. There was an average of seven African-American fans at each weekend SEC baseball game in 2006, out of the average crowd of 3,707. In all cases, the African-American fan count was less than 1% of the attendance.

Table 2: African-American Participation in the Mid-Eastern Atlantic Conference (MEAC) and the Southwest Atlantic Conference (SWAC)

<tr”>MEAC% of African American PlayersSWAC% of African American Players

Bethune-Cook 21 Alabama A&M 90
Coppin State 30 Alabama State 84
Delaware State no baseball Alcorn State 50
FAMU 39 Arkansas PB no data
Hampton no baseball Grambling 80
Howard no baseball Jackson State 72
Maryland Eastern 16 Miss Valley St 100
Morgan State no baseball Prairie View 84
Norfolk 25 Southern no data
N.C. A&T 60
Average among those reporting 31 68
Sources, http://www.meacsports.com/, http://www.swac.org

Additionally, none of the SEC head or assistant baseball coaches were African-American during the 2006 season. The average SEC team had 1.91 African-American players on the forty-man roster with the range from one to four players. The two SEC schools representing states with the highest African-American population, Mississippi State and Mississippi, from a state with a 36.3% African-American population, had zero African-American players.

As presented in Table 3, the focus group identified four categorical areas as reasons for the limited number of African-Americans in college baseball. The reasons noted by the focus group, in order of their perceived importance, were: (1) lifestyle factors, (2) competition for the African-American athlete from other sports and social opportunities, (3) the absence of African-American role models (either active players or coaches), and (4) a limitation resulting from the perception that the African-American athlete is more difficult to coach.

Table 3: Focus Group Conclusions for the Scarcity of African-American Baseball Players

Themes Description
Lifestyle Factors African Americans are more interested in fast-paced sports.
Competition College baseball is out-recruited by more visible sports.
The popularity of AAU basketball draws interest.
College baseball has less recruiting money.
Minority scholarships take away opportunities for African-Americans in historically black colleges and universities.
Role Models There is a small number of African-American baseball icons.
There are not many visible African-American GMs and Managers.
Limitations The African-American athlete is viewed as less able to be coached and is, therefore, less likely to be recruited.

Discussion:

There have been many theories presented as to why African-Americans are rapidly disappearing from college baseball. One possible explanation could be the relationship between the onset of Title IX, which led to many NCAA I schools reducing the number of baseball scholarships to 11.7 and to 10.0 in NCAA Division II, which may have contributed to the loss of interest in a college sport where full-scholarships are rare. In both NCAA Division I and II, partial scholarships are the rule, not the exception. There is the possibility that baseball has been socially architected out of the mainstream of African-American culture by means of well-intended legislation, such as Title IX. Results of this legislation have been to reduce access for the less affluent to college baseball and to influence athletes with the ability to play multiple sports to select a sport that can lead to a full scholarship.

Well-documented theories, such as Gidden’s structuration theory (1979), Ogden’s Welcome Theory, and limited access proposals (2003) may have credibility; however, they are difficult to prove quantitatively. It is likely that more than one specific theory or variable has been key in this social shift in baseball.

Several questions must be addressed. Have high-school and college baseball priced themselves out of the African-American athlete’s market by requiring participation in select teams for high schools or by limiting scholarship money for the college bound? Has the eagerness of the Central-American baseball player to sign for small bonuses become more appealing to MLB than going after the African-American player? Has the fact that MLB is now an international game influenced the reluctance of the high-school athlete to pursue baseball in college because other sports appear to be less competitive in the athlete’s quest for stardom? Is baseball too slow for the fast-paced lifestyle of the inner-city African-American youth? Are white athletes replacing African-Americans in baseball or is the international growth of the game naturally reducing the influence of any one racial group?

Perhaps the most perplexing rationale for the reduction in participation rates among African-Americans arises from the focus group in this study, which stated that the perceived slower pace of baseball has become a deterrent to participation among African-Americans. Baseball has many strategic games within it that are, in reality, constantly changing and fast paced. Therefore, the pace issue may have evolved out of a false perception which has been capitalized upon by those marketing other sports. People may not understand or see these elements of baseball. This issue itself merits further study.

No doubt, the evolution of sport participation is well documented. However, much study is needed before the theories behind the change can be scientifically proven. This author believes the change is primarily the result of a combination of the ramifications of Title IX legislation and the mass media marketing of the perception that other sports are faster paced and more entertaining.

References:

African Americans in Sports (n.d.). Retrieved September 15, 2006, from http://www.jimcrowhistory.org/scripts/jimcrow/sports.cgi?sport=Baseball

Beran, J. (1990). Diamonds in Iowa: Blacks, Buxton, and baseball. Journal of Negro History, 75(3-4), 81-95.

Boyd, T. (1997). “The day the Niggaz took over: Basketball, Commodity, Culture, and Black Masculinity in Out of Bounds: Sports, Media, and the Politics of Identity, ed. Aaron Baker and Todd Boyd. Bloomington: Indiana University Press, p. 140.

Bray, Corey. (2005). 1999-2000-2003-2004 Student-Athlete ethnicity report. The National Collegiate Athletic Association. January 2005, Retrieved September 1, 2006, from http://www.ncaa.org/library/research/ethnicity_report/2003-04/2003-04_ethnicity_report.pdf

Early, G. (2000). Why baseball was the Black national pastime. In T. Boyd & K.L. Shropshire (Eds.), Basketball Jones (pp.27-50). New York: New York University Press.

Flanagan, J. (1999, June 29). Baseball continues to ponder how to attract black fans. Kansas City Star, p. C2.

Giddens, A. (1979). Central Problems in Social Theory. Berkeley: University of California.

Hall, R. (2002). The bell curve: Implications for the performance of black/white athletes. Social Science Journal, 39(1), 113-118.

Little League Online. (n.d.). Retrieved September 22, 2006, from http://www.littleleague.org/programs/urban.asp

Lynn, A. (2006, February 21). Research on minority stars for Baseball Hall of Fame a revelatory process. Illinois News Bureau. Retrieved September 15, 2006, from http://www.news.uiuc.edu/news/06/0221hallfame.html

Major League Baseball: Community: Reviving Baseball in Inner Cities (RBI). (n.d.). Retrieved September 22, 2006, from http://mlb.mlb.com/NASApp/mlb/mlb/official_info/community/rbi

Nightengale, B. (2006, June 2). Where are black ballplayers? USA Today, pp. 1C-2C.

Odgen, D. (2001). African Americans and pick-up ball: A loss of diversity and recreational diversion in midwest youth baseball. NINE: A Journal of Baseball History & Culture 9: pp. 200-207.

Odgen, D. (2003a, April 12). Baseball Crowd Shots and the Social Construction of Spectators: An Exploratory Analysis. Paper presented at the Central State Communication Association meeting.

Odgen, D. (2003b, March 20-23). The Welcome Theory: An approach to studying African American Youth Interest and Involvement in Baseball. Paper presented at the Tenth Annual NINE Spring Training Conference. Retrieved September 1, 2006 from http://muse.jhu.edu, from the Project Muse Database.

Philipp, S. (1998). Race and gender differences in adolescent peer group approval of leisure activities. Journal of Leisure Research, 30(2), 214-232.

Philipp, S. (1999). Are we welcome? African American racial acceptance in leisure activities and the importance given to children’s leisure. Journal of Leisure Research 31: pp.385-403.

The Torii Hunter Project. (n.d.). Retrieved September 22, 2006, from http://www.toriihunter48.com/

United States Census Bureau. (Revised 2006, June 23). USA QuickFacts from the U.S. Census Bureau. Retrieved September 1, 2006, from http://quickfacts.census.gov/qfd/states/00000.html

Watson, G. & Collis, R. (1982). Adolescent values in sport: A case of conflicting interests. International Review of Sport Sociology 17 (1982): pp. 73-90.

Wilson, B. & Sparks, R. (1996). It’s gotta be the shoes: Youth, race, and sneaker commercials. Sociology of Sport Journal, 13(4), 398-427.

2020-06-02T13:16:22-05:00March 14th, 2008|Contemporary Sports Issues, Sports Facilities, Sports Management|Comments Off on African-Americans in College Baseball
Go to Top