A Study of the Effect of Experiential Marketing on Customer Purchase Intention: Case Study of the Taipei International Sports Cycle Show

Submitted by Chao-Chien and I-Han, Chen

ABSTRACT
The meeting, incentive, convention, and exhibition (MICE) industry has gradually flourished. However, the market encountered at exhibitions has increasingly changed into the commercial buyers’ market. Through experiential marketing, the industry can enhance its contact and communication with potential customers by participating in exhibitions, and thus, increase customer intent to purchase for products highlighted and exhibited at this specific type of venue. In recent years, one industry, in Taiwan has used sports marketing through MICE as a platform to market sport bikes. Manufacturers and business owners alike used the exhibition to reach the potential customer base, and as a result, this study conducts a questionnaire-type survey at the Taipei International Sports Cycle Show. The main purposes of this study are to investigate the degree to which experiential marketing influences customer intent on purchase choices and to assess differences in experiential marketing across different demographic variables. The results of this study are as follows:
• There is a significant difference in experiential marketing across different demographic variables, including age, educational level and average monthly income.
• There is a significantly positive correlation between experiential marketing and the purchase intention of customers participating in exhibitions.
• All attributes of experiential marketing have a significantly positive influence on purchase intention.

INTRODUCTION
Taiwan is highly regarded worldwide as having an excellent reputation for its outstanding manufacturing of bicycles. In the past, the bicycle was considered merely a traditional transport vehicle; however, recently and in a very short period of time for many Taiwanese, cycling has become a popular recreational activity because of the rising awareness of environmental protection, energy saving and carbon reduction policy, and an increased focus on exercise, attention to health issues and seeking an improvement in overall quality of life (21). Until very recently, the bicycle industry was monopolized by a single giant manufacturing company and this corporation was one of the most dominant manufacturers of bicycles, having occupied the largest output of all bicycles within the sports cycling market. As a result of this company having the monopoly for the production of sports cycles, the global revenues amounted about $ NT 300 million, and annual production and sales targeted about $ NT 4.8 million bicycles (5). In 1985, Taiwanese manufactured bicycles were far greater in overall annual production than the amount produced in Japan. This earned Taiwan the reputation as “World Bike Kingdom” (20). Additionally, with the extremely rapid progress of information and technology, not only did the development of the national economy advance quickly, but also international businesses had increased growth as well. As these companies grew, many of them began utilizing the marketing strategy of exhibition venues, which contributed to the development of the meeting, incentive, convention, and exhibition (MICE) industry (32). Recently, the bike industry in Taiwan is without exception. It has held lots of international sports cycling exhibition for selling its own brand of sports bike by means of the MICE promotion platform, the Taiwanese sports bike industry has participated lots of international sports cycling exhibition for selling its own brand of sports bike. These products do not only sell in the Taiwanese domestic market, but also globally, using exhibition venues such as the Taipei International Sports Cycle Show, Taichung Bike Week, and Taiwan Cycle Night.

Compared to the consumers who do not attend exhibitions, the visitors to the MICE have a higher level of product consumption, and vendors positively appraise their experience in host countries (22). Moreover, numerous cities regard the development of the MICE as a strategy for a new era of urban development and a path to the development of local infrastructure. The statistical results of the research showed that the average consumption of the visitors brought by conventions and exhibitions was two to three times that of normal tourists; the travel consumption brought by conventions and exhibitions accounted for 30 percent of the total travel consumption (22). The Sydney Convention and Visitors Bureau (SCVB) surveyed conference representatives. The survey results showed that 67% of the representatives participating in international conferences in Australia would revisit Australia in the next five years, showing that the MICE has enormous potential in promoting the development of the tourism industry (26).

Exhibition activities in the MICE have gradually transformed from the traditional “sample display,” provided by vendors and ordering services; however, more recently, the exhibition theme and format are further subdivided according to economic specialization (6). In 2009, Yin’s research (32) notes that an exhibition is regarded as a crucial instrument in marketing for information exchange and merchandise trade; an exhibition not only integrates the functions of advertisement, personal selling, sales promotion, and public relations, but also provides manufacturers and customers with abundant face-to-face opportunities. Furthermore, Breiter and Milman (2006) explain that most exhibitions held at convention centers are annual or circulating ones as well as consumers with positive experiences in attending exhibitions should increase their willingness to revisit these type of venues. Consequently, whether exhibition activities are held successfully depends on whether the marketing service techniques of the hosting organizations are good enough to attract people.

Presently, the economic consumption style of Taiwan has changed from the “Agricultural Economy” into the “Experiential Economy” (12). According to numerous studies, with the advancement of the experiential economy, the concept of marketing has become a heavily discussed issue among management scientists and economists (24,16,23). Hence, the marketing concept has gradually evolved from product-, sale-, society-, and relation-oriented into the experiential-oriented marketing as the primary core of business activities. In 1999, Schmitt (28) is the first person who integrates experiential marketing concepts and compares traditional marketing with experiential marketing comprehensively. He argues that the traditional marketing method, which focuses on the benefit and function of products, has not been appealing to customers; therefore, enterprises should focus on customers’ experiences. With the coming of the age of the experiential economy, not only marketing methods but also customers’ experiences should be emphasized; and entrepreneurs also need to consider experience as a crucial factor in running a successful brand. Differing from traditional marketing, which emphasizes the performance and function of products, experiential marketing focuses more on the function and efficiency of products and the brand image (7,24). Thus, the experiential method has become a popular trend in increasing the performance of various industries. Based on these findings, experiential marketing has a great influence on customers’ consumption behavior. If entrepreneurs can understand a customer’s reaction to experiential marketing through activities held by exhibitors and relevant research in experiential marketing, they should be able to enhance the performance in selling their products at exhibitions.

This research aims to understand differences in experiential marketing across different customers through participating in exhibitions as well as investigate whether customers’ feelings towards experiential marketing at exhibitions are helpful in managing and developing the Taiwanese sports bike industry. In 1991, Kotler (17) suggests that management should satisfy customer demands. He further encourages businesses to develop marketing strategies by looking from the viewpoint of its customers. The assumption is that if enterprises focus on what the customer wants, this form of marketing should increase customer purchase intention, and moreover, companies will obtain increased profits from these customers. A higher degree of customer satisfaction will lead to higher customer purchase intention, positive public praise, greater competitive advantages, and higher market share (1,10). Purchase intention means the likelihood that a consumer will buy a particular product; the higher the purchase intention, the greater the purchase probability (8,29). Fishbein and Ajzen (1975) confirmed that purchase intention can be used as a key index in predicting consumption behavior; it represents consumers’ subjective preferences for purchasing products and in recommending products to their family and friends. Furthermore, establishing a good relationship with customers to promote customer purchase intention is the most important task for industries in marketing (2). Through experiential marketing strategies, if customers actually experience products, their intent to actually purchase the exhibited products is usually also increased (12). Hence, selling products through experiential marketing not only enables customers to “understand” products on exhibition, but also maintains a suitable product value, and provides better sales performance (18,19). Through sensory and emotional experiences, consumers are both directly or indirectly influenced which, in turn, increases the likelihood of customer purchase intention. Customer satisfaction is the main factor influencing consumer behavior (30). To maintain sustainable development on the market, modern enterprises should increase their profits mainly by increasing customer purchase intention (10). Therefore, through the techniques, assessments and applications of experiential marketing, exhibitors can determine whether the real effect and performance of experiential marketing are helpful in promoting consumer purchase intention.

Several scholars, including Hsieh and Li (2008), Blackwell, R. D., Miniard, P. W., and Engel, J. F (2006), and Holbrook (2000) indicate that there is a positive correlation between experiential marketing and purchase intention. These findings show that through experiential marketing, customers attending bicycle product exhibitions can provide immediate feedback on the products on display at these venues. Having this “hands-on” experience allows the potential customer to immediately achieve full understanding of the functions, safety, and price of the sports bicycles and related products. Based on the literature review, experiential marketing can certainly establish an interactive relationship between customers and service personnel at exhibitions, and customers are more likely to have positive evaluations of these products. Consequently, this research sets out three hypotheses as follows:
Hypothesis 1: There is a significant difference in experiential marketing across different demographic variables.
Hypothesis 2: There is a significant correlation between experiential marketing and the purchase intention of customers participating in exhibitions.
Hypothesis 3: Experiential marketing has a significantly positive relationship and influence on purchase intention.

Methods
Research Subjects
The subjects for this study consisted of the customers participating in the 2012 Taipei International Sports Cycle Show. The investigation of this study lasted for four days, from March 17th, 2012 to March 20th, 2012. The researcher stayed at the 2012 Taipei Sports International Cycle Show from 9 a.m. to 5 p.m. each day for study. Then, the researcher conducted convenience sampling, selecting 650 questionnaires for research investigation.

Research Instruments
There were three research instruments used in this study. The first instrument was personal information including gender, age, marital status, education level, monthly income, residence, and so forth. The second one was an experiential marketing scale revised from Huang’s scale (11), which is based on Schmitt’s (27) experiential marketing scale. The experiential marketing scale of this study included 14 questions on five experiential attributes: emotional, thought, action, associative, and sensory experiences. The third instrument was a customer purchase intention scale revised from Hsu’s scale (15), which is based on Dodds, Monroe, and Grewal (8). Dodds, Monroe, and Grewal’s questionnaire on customer purchase intention and attitude toward recommending products to others. To ensure that the scales used in this study were consistent, efficient, and suitable, a validity and reliability analysis was implemented after the scales were gathered. Concerning the validity analysis, the questionnaires were created based on the theories and measurement instruments of Huang (11) and Hsu (15).

Then, the questionnaires were examined by scholars and experts, and a factor analysis was conducted to increase the efficiency of the content, thus building the content validity of the questionnaires. The factor analysis showed that the cumulative explained variance of both experiential marketing and purchase intention are up to 77.73 %. Hence, the measurement instruments used in this study meet the expected standards of validity. To analyze the reliability of the results, the Cronbach’s Alpha of purchase intention and experiential marketing scales were calculated for internal consistency. Both scales have an overall internal consistency up to .71, meaning they both have high reliability.

Number of Observations
This study adopted a more conservative method under the restriction of accuracy and reliability. Under the condition (α=.05, Cp=.05, and p=.5), the number of samples required was at least 384 (25). Based on the requirements for data analysis and the writing of the report, a return rate of at least 50 % as adequate, at least 60 % as good, and at least 70 % as very good (31). Thus, questionnaires were effectively gathered from 536 participants, return rate was 82%.

Results and Discussion
Differences in Experiential Marketing of the Taipei International Sports Cycle Show across Different Demographic Variables

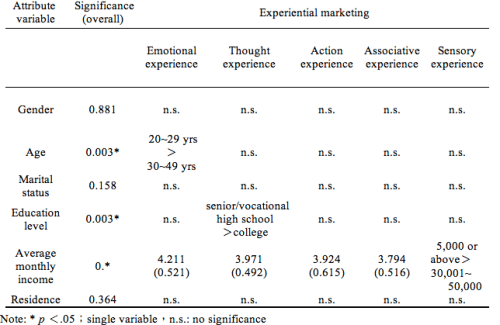
Differences in overall experiential marketing of potential consumer from different demographics were examined by an independent sample T test and a one-way ANOVA. The analysis showed that there was a significant difference in the variables of age and educational levels ( p<.005), while there was no significant difference in any other variables. Through a post hoc comparison, the researcher discovered that customers of 30 to 39 years of age had a stronger impression of “emotional experience” than those who were 40 years old or above. A post hoc comparison concerning the variable of education level showed that customers whose educational level was senior/vocational high school had a higher evaluation of experiential marketing activities than those with a college or graduate degree did. Furthermore, a one-way ANOVA was conducted to examine differences in all attributes of experiential marketing across customers with different backgrounds, as can be seen in the Table 1.

Table 1. Analysis of variance assessing differences in the five attributes of experiential marketing across customers with different backgrounds

Screen Shot 2014-01-31 at 8.41.26 AM

As can be seen from Table 1, differences in the five attributes of experiential marketing across customers of different ages, educational levels, and average monthly incomes reached a significant level ( p<.05), while there was no significant difference in any other variables. Furthermore, through a one-way ANOVA, the researcher discovered that there was a significant difference in the “emotional experience” attribute across customers of different ages ( p<.005). Based on the results of Scheffe’s post hoc test, compared to customers of 40 to 59 years of age, those 20 to 29 years old had a significantly higher perception of the “emotional experience” attribute; among customers with different education levels, compared to customers with a college degree, customers whose education level was senior/vocational high school had a significantly higher perception of the “thought experience” attribute ( p<.005); there was a significant difference in the “sensory experience” attribute across customers of different average monthly income ( p<.005). The results of Scheffe’s post hoc test also showed that compared to customers who have an average monthly income of $30,001 to 50,000 NTD, those who have an average monthly income of 5,000 NTD or below had a significantly higher perception of the “sensory experience” attribute; there was no significant difference in all attributes of experiential marketing of the Taipei International Sports Cycle Show across customers of different marital status, gender, or residence.

Correlation Analysis between Experiential Marketing and Customer Purchase Intention
This study implemented a Pearson correlation coefficient to analyze the correlation among the averages of each variable. The overall correlation between experiential marketing and purchase intention reached a significant level, as can be seen in Table 2. There was a moderate positive correlation between most of the five attributes of experiential marketing and purchase intention, as can be seen in Table 3. Among all correlation coefficients, there was the highest degree of correlation between “customer purchase intention” and “action experience” – a correlation value of 0.667.

Table 2. Correlation between experiential marketing and purchase intention

Screen Shot 2014-01-31 at 8.43.02 AM

Table 3. Correlation between purchase intention and the five attributes of experiential marketing

Screen Shot 2014-01-31 at 8.43.44 AM

Table 3 showed that the higher the experiential evaluation those customers obtained from the Taipei International Sports Cycle Show, the higher their purchase intention would be. Customers gave a fairly high evaluation of the perception and reaction to this exhibition.

Regression Analysis of Purchase Intention on Experiential Marketing
This study aims to investigate whether an experiential marketing method will be transferred to customer purchase intention of a certain product. First, a regression analysis was conducted to investigate the influence of experiential marketing on customer purchase intention. The analysis resulted in an F-value of 339.272, a p-value of 0.000, and an adjusted R2 of 0.477, showing that the regression of purchase intention on experiential marketing reached a significant level, and had an explanatory power of 47.7 %.

Table 4. Regression of purchase intention on experiential marketing

Screen Shot 2014-01-31 at 8.44.55 AM

Table 4 showed that experiential marketing had a significantly positive influence on customer purchase intention (t = 18.335, p = 0.000, Beta coefficient = 0.9270>0). Therefore, if enterprises can emphasize experiential marketing activities at exhibitions, customer purchase intention of a certain product on exhibition can be promoted.
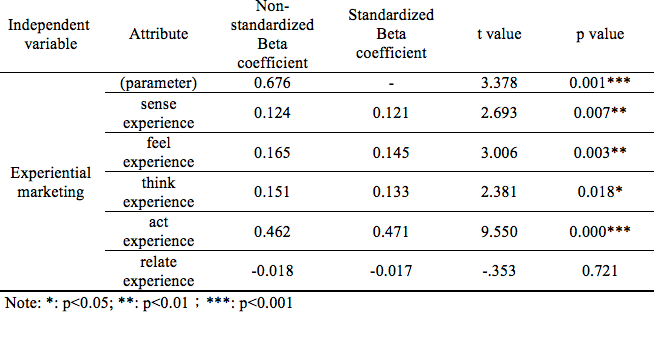
Second, another regression analysis was conducted to investigate the influence of the attributes of sensory, emotional, thought, action, and associative experiences on customer loyalty. The analysis result produced an F value of 81.591, a p-value of 0.000, and an adjusted R2 of 0.526, showing that the regression of customer purchase intention on the five attributes of experiential marketing reached a significant level, and had an explanatory power of 52.6 %.

Table 5. Regression of purchase intention on five attributes of experiential marketing

Screen Shot 2014-01-31 at 8.52.55 AM

Table 5 showed that the attributes of sensory, emotional, thought, and action experiences had a significant positive influence on customer purchase intention (t = 2.693, 3.006, 2.381, 9.550, respectively; p = 0.007, 0.003, 0.018, 0.000, respectively; and the standardized Beta coefficient = 0.121, 0.145, 0.133, 0.471, respectively). Among all five attributes of experiential marketing, only “associative experience” had no significant influence on purchase intention (t = -0.353; p = 0.721; standardized Beta coefficient = -0.017).

Consequently, if exhibitors at the Taipei International Sports Cycle Show can emphasize sensory, emotional, thought, and action experiences, this will help stimulate customer purchase activity at the exhibition.

CONCLUSIONS
The main purposes of this study are to investigate the degree of influence of experiential marketing of the Taipei International Sports Cycle Show on customer purchase intention as well as to assess differences in experiential marketing across different demographic variables. The results show that there is a significant difference in experiential marketing at the Taipei International Sports Cycle Show across different demographic variables including age, education level, and average monthly income. There was a significant difference in “emotional experience” across customers of different ages. Among all age groups, customers 20 to 29 years old had higher perception of emotional experience than those 40 to 59 years old. Consumers in the age bracket of 20 to 29 years old placed more emphasis on “emotional experience.” Therefore, exhibitors should properly control the overall atmosphere of exhibitions, and maintain a sincere and professional attitude among service personnel. Moreover, exhibitors need to improve the cleanliness of their exhibition halls to enhance customer comfort and foster their “emotional experience” at the Taipei International Sports Cycle Show. Additionally, the Taipei International Sports Cycle Show appealed a lot of enthusiastic cyclists; hence, exhibitors should attempt to establish a relationship with customers to exchange information even after the exhibition is over. Compared to customers with a college degree, those who have a vocational or senior high school level of education have a significantly higher perception of the “thought experience” attribute. The researcher believes that customers who have an education level of college or above have a higher quality of cognitive ability than those with a general education degree; thus, they are more sensitive to the marketing necessity of exhibitions. There was a significant difference in the “sensory experience” between customers of different average monthly incomes. Through a post hoc comparison, the researcher discovered that compared to customers who had an average monthly income of$30,001 to 50,000 NTD, those who had an average monthly income of 5,000 NTD or below had a significantly higher perception of the “sensory experience” attribute.

There was a significant correlation between customer purchase intention and all attributes of experiential marketing. The experiential marketing of the Taipei International Sports Cycle Show is effective in predicting customer purchase intention. From the study results, it is known that experiential marketing is certainly helpful in increasing customer purchase intention. Customers are profoundly influenced by the attributes of emotional, thought, action, associative, and sensory experiences, and show a positive evaluation of products. Among all attributes of experiential marketing, the highest degree of correlation is between “customer purchase intention” and “action experience” – a correlation value of 0.667 according to Table 3. Hence, exhibitors can bring in more experiential marketing activities for promoting customer purchase intention.

Examining the influence of customer experiential value of the Taipei International Sports Cycle Show on customer purchase intention from viewpoint of marketing, the study results showed that all attributes of experiential marketing had a significant positive influence on purchase intention (t = 18.335; Beta Coefficient = 0.927). This result confirmed that past experiential marketing is a fairly crucial factor for impacting customer purchase intention. Furthermore, as the research supports the idea that purchase intention is influenced by experiential marketing, the creation of experiential marketing can be emphasized in marketing strategies. Experiential value can be created through experiential marketing including emotional, thought, action, associative, and sensory experiences. Through suitable experiential mediums, unique experiences can be passed onto customers to create high experiential value, which can be useful for further research. Enterprises can utilize experiential marketing, while paying close attention to whether the experience provided its customers is both holistic and irreplaceable. Moreover, enterprises can relate unique experiences with marketing strategies to offer customers a holistic experience to facilitate their future purchase decisions.

REFERENCES
1. Bearden, W., & Jesse, E. T. (1983). Selected Determinants of Consumer Satisfaction and Complaint Reports. Journal of Marketing Letters, 20, 21-28.

2. Berry, L. L. (1983). Relationship Marketing, Emerging Perspectives of Services. Marketing, American Marketing Association, 25-28, Chicago.

3. Blackwell, R. D., Miniard, P. W., & Engel, J. F. (2006). Consumer Behavior, (10th ed)., Thomson/South-Western.

4. Breiter, D., & Milman, A. (2006). Attendees’ needs and service priorities in a large convention center: Application of the importance–performance theory, Tourism Management, 27 , 1364-1370.

5. Chang, H. W. (2003). A Study of Bicycle Tourism Development in Taiwan. Journal of Tourism Studies. 9(1), 107-121.

6. Chang, Y. S. (1999). Behavior Research of National Firms Attend International Trade Shows-An Example of Machinery Industry. Unpublished Master Thesis, Soochow University, Taipei.

7. Chen, L. Y. (2004). The Influence of Experiential Quality on Emotion, Value, Experiential Satisfaction, and Behavior Intention – taking the drama in Taiwan as an Example. Unpublished Master Thesis, Fu Jen Catholic University, Taipei.

8. Dodds, W. B., Monroe, K. B., & Grewal, D. (1991). “Effects of price, brand and store information on buyers’ product evaluations,” Journal of Marketing Research, 28(8), 307-319.

9. Fishbein, M., & Ajzen, I. (1975). Belief, Attitude, Intention, and Behavior: An Introduction to Theory and Reaseach, M.A.: Addison-Wesley.

10. Fornell, C. (1992). A National Customer Satisfaction Barometer: The Swedish Experience. Journal of Marketing, 56, 6-21.

11. Huang, Y. Y. (2005). A Study of the Relationships among Experiential Marketing, Experiential Value, Customer Satisfaction, Brand Image and Behavioral Intention. Unpublished Master Thesis, Dayeh University, Changhua.

12. Huang, J. Y. (2009). A Study of the Relationship among the Experiential Marketing, Customer Value and Customer Loyalty – A Case Study of Starbucks. Unpublished Master Thesis, Soochow University, Taipei.

13. Holbrook, M. B.(2000). The Millennial Consumer in the Texts of Our Times: Experience and Entertainment. Journal of Macro marketing, 20(2), 178-192.
14. Hsieh, A. T., & Li, C. K. (2008). The moderating effect of brand image on public relations percept ion and customer loyalty. Marketing Intel ligancy & Planning, 26(1), 26-42

15. Hsu, C. Y. (2006). Investigation of Relationships among Importance, Satisfaction and Behavioral Intention of Members towards Travel Information–A Case Study of the President Health Resorts. Unpublished Master Thesis, Shih Hsin University, Taipei.

16. Jeremy, Rifkin. (2000).The Age of Access. New York: Penguin Putnam Inc.

17. Kotler, Philip. (1991). Marketing Management: analysis, planning, implementation and control. Englewood Cliff NJ.: Prentice-Hall Inc.

18. Lin, A. Y. (2003). A study on the communication between CIS and its reader by the concept of play by Hans-Georg Gadamer. Unpublished Master Thesis, Chung Yuan Christian University, Touyuan.

19. Lan, S. M. (2003). Study of Situational Factors of Consumers Exploring From the Aspects of Experiential Marketing -Examples of Coffee Chain stores in Taichung City. Unpublished Master Thesis, Chaoyang University of Technology, Taichung.

20. Liao, S. L. (1998). The effect of Taiwan bicycle industry after becoming a WTO member country. Taiwan Economic Research Monthly, 21(6), 43-48.

21. Lin, J. Z. (2008). The Effect of Serious Leisure and Leisure Commitment on Voluntary Performance Behaviors among Leisure Tennis Participants. Unpublished Master Thesis, National Yunlin University of Science and Technology, Yunlin.

22. Oppermann, M. (1999). Convention Destination Images: Analysis of Association Meeting Planners’ Perceptions. Tourism Management, 17(3), 176-182.

23. Ownes, D. D. (2000). The experience economy. Franchising World, 32 (1), 11.

24. Pine, B. J., & Gilmore J. H. (1998). Welcome to the Experience Economy. Harvard Business Review, 76, 97, Boston.

25. Rea, L. M., & Parker, R. A. (1997). Designing and conducting survey research. San Francisco, CA: Jossey Bass Publishers.

26. Sydney Convention & Visitors Bureau (2006). Sydney Convention and Visitors Bureau – Your key to the best of Sydney. Retrieved December 2, 2006.
http://www.scvb.com.au/why/scvb_section/scvb_home.cfm

27. Schmitt, B. H.(2000). Experiential Marketing:How to get customers to sense, feel, think, act, relate to your company and brands, NY:Free Press.

28. Schmitt, B.H. (1999). Experiential Marketing, Journal of Marketing Management, 15, 53-67.

29. Schiffman, L. G., & Leslie, L. K. (2000). Consumer Behavior (7th ed.), Wisconsin Prentice Hall International, Inc.

30. Woodside, A., Frey, L., & Daly, R. (1989). Linking service quality, customer satisfaction and behavioral intention. Journal of Health Care Marketing, 9, 5-17.

31. Wang, W. K., & Chih, H. W.(2006). Education Research. Wu Nan Book inc. Taipei.

32. Yin, H. Y. (2009). A Study of Relationships among Exhibition Service Quality, Satisfaction and Loyalty. Unpublished Master Thesis, Takming University of Science and Technology, Taipei.

2014-02-03T15:50:07-06:00January 31st, 2014|Contemporary Sports Issues, General, Sports Marketing|Comments Off on A Study of the Effect of Experiential Marketing on Customer Purchase Intention: Case Study of the Taipei International Sports Cycle Show

Physical Activities and Their Relation to Physical Education: A 200-Year Perspective and Future Challenges

Submitted by Suzanne Lundvall and Peter Schantz.

The Sport Journal normally doesn’t publish articles that have appeared in other publications previously, but the entry below is an exception to this rule. We at The Sport Journal feel the views expressed in this article are important enough to republish for our valued readers.

Abstract
In this macrolevel overview, a model of the multiplicity of the field of bodily movement cultures is initially presented. The model is then used to illuminate how different bodily movement practices emerged over time, became embedded, remained, faded, or disappeared in the world’s oldest physical education teacher education (PETE) program. Through this continuity and discontinuity of practices, five distinct phases are identified, although sometimes intertwined, and their contextual background is described. The first phase is characterized by the establishment of Ling gymnastics from the early 19th century and by its fall in the 20th century. The next phase started in the late 19th century and dealt with the introduction of sports and outdoor life. During a third phase, sports became the dominating movement practice. The fourth phase is related to the rise and fall of a separate female gymnastics culture during the 20th century. The fifth phase is characterized by the introduction of everyday life physical activities at the beginning of the new millennium. The overview is followed by reflections on the future content of bodily movement practices and sought-after values in PETE and physical education in the school system.

Introduction
The content of physical education (PE) programs in schools for children and young people is under debate globally. This is not new. PE has had an ongoing battle concerning how to gain the greatest and longest benefits for mind and body since it was established at the beginning of the 19th century (Pfister, 2003). These conflicts have been noted between cultures and nations, representing different points of view about the legitimate agenda of physical education, but conflicts have also been noted within nations and educational institutions (Kirk, 2010; Korsgaard, 1989; Lundvall & Meckbach, 2003; Morgan, 2006; Pfister, 2003; Schantz, 2009; Schantz & Nilsson, 1990). In the authors’ view, good reasons exist to continue this debate in our time. For this purpose, a model of the multiplicity of the field of physical activity cultures is presented. It is offered as a supportive and clarifying structure for identifying, discussing, and making future PE content decisions.

To illuminate these issues, the model is used in a macrolevel overview, illustrating changes in values and practices within the oldest still existing physical education teacher education (PETE) program in the world, that is, The Royal Gymnastic Central Institute (GCI), now named The Swedish School of Sport and Health Sciences (GIH). Apart from studies based on empirical data from this PETE institution, the overview also makes use of international literature on physical culture and health.

Thus, this article focuses on PETE, a less examined area when it comes to how new concepts of bodily movement practices have emerged, become embedded in programs and local
practices, remained, faded, or disappeared because they were not “legitimate” or were of less value or for other reasons (e.g., Annerstedt, 1991; Fernandez, 2009; Kirk & Macdonald, 2001; Kirk, Macdonald, & Tinning, 1997; Lundvall & Meckbach, 2003). Proceeding from these basic concepts, the final aim of this article is to reflect and discuss the present-day situation in relation to principles for bodily movement practices and sought-after values for PETE. This discussion will include tensions and disagreements on content issues and future challenges for PETE and school PE.

Theoretical Framework
The theoretical departure point is inspired by the work of Bourdieu. The analytical focus has been placed on how deliberate forms of bodily movement practices in the studied PETE program came to be defined and regulated through meaning-making principles or the logic of practices (Bourdieu, 1984, 1990; Engström, 2008). Over time, the chosen bodily movement practices have created tensions in terms of power and control over what has been seen as legitimate in the educational sector of physical activity and body culture. This departure point also makes it possible to study how aspects of investment and intrinsic values have been put forward and have been related to views on body and health.

The Educational Field of Physical Activity Practices: A Model
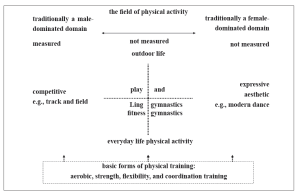
A model has been developed to illustrate the multiplicity of different forms of deliberate bodily movement practices with distinctly different meaning-making principles (logic of practices; Figure 1). It also considers the construction of gender. It is based on a similar model first described by Schantz and Nilsson (1990) and relates to an educational context in Sweden. However, it can also be easily adjusted to conditions in other countries. The different principles for bodily movement practices are spatially oriented in the model in relation to the rationality underpinning each practice. Sport activities, based on the logic of competition, are placed in the traditionally male-dominated domain. Aesthetic and expressive forms of physical activities, such as artistic forms of dance, are placed in the traditionally female-dominated domain. Ling gymnastics, fitness gymnastics, play, outdoor life, and everyday life physical activities are placed in a traditionally gender-neutral position in the middle of the model. None of these forms of movement practices are underpinned by measurement/competition or driven by aesthetics and expressiveness. Enhancement of different physical qualities through physical training can support the conduct of all movement practices in the model. Basic forms of physical training are therefore placed at the bottom of the model, with arrows signaling their possible supportive nature for all other movement practices. Physical activities that are related to different types of professions are not given a place in this model.

Figure 1. A Model of the Field of Physical Activity Practices (modified from Schantz &
Nilsson, 1990)

Screen Shot 2014-01-27 at 2.17.28 PM

Continuity and Discontinuity of Bodily Movement Practices Over Time
A general description is given below of how the model can be used to illuminate the relative amount of time devoted to different movement practices during different time periods. In this way, a flow of continuity and discontinuity emerges. Different distinct phases are noted. This primarily visual description is followed by a text elaborating contextual factors of importance for understanding the changes described.

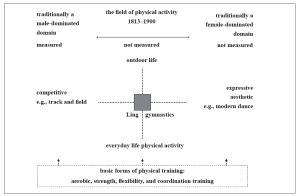
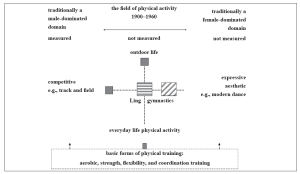
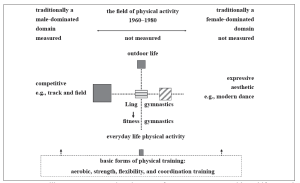
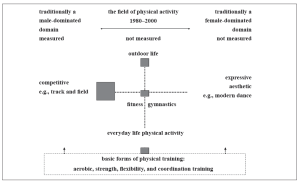
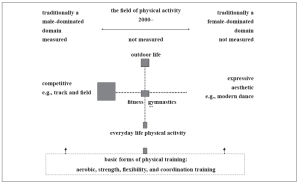
From 1813 to 1900, Ling gymnastics was developed and dominated the movement practices, and a fundamental principle was the schooling of body and character (Figure 2). From 1900 to 1960, sports were gradually introduced and thereby the logic of competition. PETE also started to involve outdoor life with the main goal of experiencing nature. For this purpose, physical activities such as orienteering and skiing became part of the educational program. Female PETE education developed a gymnastics discourse of its own, with influences from dance, rhythmic, and aesthetics. Thus, different and gender-related dimensions of movement practices became represented. Alongside this, new forms of physical training, particularly circuit training and aerobic conditioning, were brought in and signaled a logic of training solely for an investment value (Figure 3). During the period from 1960 to 1980, the elements of Ling gymnastics generally faded away but left a space for fitness gymnastics, and at the beginning, this was divided for men and women. Sport dominated as a movement practice, and fitness training within the area of gymnastics increased. The position for outdoor life activities remained stable (Figure 4). From 1980 to 2000 the separate female gymnastic discourse ended as an unintended consequence of a coeducational reform. Sport as a movement practice dominated and became the primary rationale for PETE. Fitness gymnastics was available for male and female students.Outdoor life held its position (Figure 5). From 2000 and onward, everyday life physical activity
emerged with its fundamental principle of an investment value in health. In other ways, there was no fundamental change compared to the previous period (Figure 6).

Figure 2. Bodily movement practice in PETE from 1813 to 1900. Ling gymnastics was developed and established. It represented the content in male and female PETE (where female PETE was established in 1864; cf. Drakenberg et al., 1913). This is indicated by the gray field, which signifies teaching time allocation to this specific bodily movement practice.

Screen Shot 2014-01-27 at 2.20.39 PM

Figure 3. Bodily movement practices in PETE from 1900 to 1960. Male and female gymnastics, indicated as boxes with horizontal and diagonal lines, respectively, developed in different directions. In the 1950s, new forms of physical training appeared. The sizes of the gray fields represent an approximate relative balance between time allocated to different physical activity practices at the latter part of the time period (cf. Lundvall & Meckbach, 2003; Tolgfors, 1979). The years indicated as the beginning and end of the period should be read as approximate indications of time.

Screen Shot 2014-01-27 at 2.21.55 PM

Figure 4. Bodily movement practices in PETE from 1960 to 1980, with a shift toward more time being allocated for sports and a gradual shift away from Ling gymnastics toward fitness gymnastics (cf. Lundvall & Meckbach, 2003; Tolgfors, 1979). For general comments on the construction of the figure, see Figure 3.

Screen Shot 2014-01-27 at 2.26.54 PM

Figure 5. Bodily movement practices in PETE from 1980 to 2000 differ from the previous practices (see Figure 4) in that the coeducational reform led to the termination of the separate female gymnastics culture (cf. Lundvall & Meckbach, 2003; Schantz & Nilsson, 1990). For general comments on the construction of the figure, s ee Figure 3.

Screen Shot 2014-01-27 at 2.27.58 PM

Figure 6. Bodily movement practices in PETE in the 21st century. A dimension of “everyday life physical activity” was introduced during this period (Idrottshögskolan, 2002, 2003). The other movement practices remained the same compared to the previous phase, with one exception: The time alotted to “basic forms of physical training” was reduced; see Figure 5 (cf. Lundvall & Meckbach, 2003, 2012). For general comments on the construction of the figure, see Figure 3.

Screen Shot 2014-01-27 at 2.28.48 PM

Contexts of Emergence, Continuity, and Discontinuity of Bodily Movement Practices

Emergence of PETE in Sweden
The early 19th century was a time open for new concepts about the training of the body. This process, which was connected to the Enlightenment and the growing importance of rational and acting, as well as the faith in scientific thinking, made it possible for new concepts and ideals to develop, including a specific exercise culture of physical education (Pfister, 2003). The institutional setting for Swedish gymnastics came about when Per Henrik Ling was given permission to establish the Royal Gymnastic Central Institute (GCI, today GIH) in 1813. This was also the starting point for the emergence of PETE in Sweden. Ling wanted to provide a system on a theoretical basis and resting on philanthropical ideas, “the philosophy of nature,” inspired by Rousseau and GutsMuths, where the intellect could be developed through the senses and action. The other basis for his system was that it was intended to rest on the “laws of the human organism” and on knowledge gained from studies of the human body. His thinking resulted in certain ideas about the execution of movements and schooling of the body, which were tightly linked to Lings’ ethical and aesthetic ideals and to perspectives of health regarded as a wholeness.

Ling aimed to develop a gymnastics system with four subdisciplines: pedagogical, medical, military, and aesthetic gymnastics. Hence, Swedish gymnastics came to be seen not only as a system for the purpose of educating the whole body, but also as a cure for the sick. Aesthetic gymnastics “whereby one expresses the inner self: thoughts and emotions” (Ling, 1840/1979, p.50) was subjected to only minor developmental attempts.

This article focuses on pedagogical gymnastics, which was defined as the means “whereby one learns to master one’s own body” (Ling, 1840/1979, p. 52). To correctly cultivate the human body, according to Ling (1840/1979, p. 54), required an elaborate system of different to promote the ability for movement control and competence. These movements were determined in detail with regard to starting and final positions, as well as the trajectory and rhythm of such movements. The system included a well-reasoned progression from easy to more complicated movements. The movements could be executed as freestanding exercises, without support, or as exercises supported by gymnastics apparatus, but all movements are based on the above-mentioned central aspects. This form of pedagogical gymnastics also had a statuesque aim (i.e., to develop a harmonious and symmetric body with good posture). Competition was not the aim or the medium of this specific movement practice, and it was not included in the praxeology (Lindroth, 1993/1994, 2004; Ling, 1840/1979; Ljunggren, 2000; Lundvall & Meckbach, 2003).

From early on, Ling stated that women should be included in this form of bodily exercise, in a feminine type of gymnastics. However, this type of gymnastics was never developed by Per Henrik Ling himself, but rather was developed later through the work of his son, Hjalmar Ling, who gave examples of simple forms of gymnastics for female students (Lindroth, 2004; Lundvall & Meckbach, 2003). Throughout the first 100 years at GCI, the teacher training of male and female students, in both theory and practice, was focused on gymnastics, as illustrated in Figure 2.

Tensions and Conflicts Around Ling Gymnastics
In the early 1900s, the scientific basis of the Ling gymnastic system was strongly questioned. This critique was primarily based on scientific studies of a specific movement that was claimed by the Ling gymnasts to enlarge the vital capacity and thereby improve oxygen uptake (Lindhard, 1926; Schantz, 2009; Söderberg, 1996). At GCI there had been, until the early 20th century, surprisingly small-scale efforts to increase the scientific understanding of Ling gymnastics in terms of their own knowledge production (cf. Lindroth, 2004). From the early 20th century there was, however, a clear ambition in this respect. A proposal to establish professorships in physiology, anatomy, histology, psychology, and pedagogics, as well as three in pedagogical gymnastics, was put forward in 1910. However, in those days the national government and parliament made such decisions, and not until 1938 was a decision made to establish a professorship in the physiology of bodily movements and hygiene (Schantz, 2009). In spite of this tension created by the accusation of a nonscientific bodily movement practice, Ling gymnastics kept its position as the main body exercise system into about the middle of the 20th century in combined 9-year elementary and junior high schools in Sweden (Lundquist Wanneberg, 2004) as well as in other countries (Kirk, 2010). One explanation for this long survival was its strong institutionalization, represented by the GCI, and its existing views on body, health, and physical culture, which constituted a strong health and hygiene discourse aimed at defeating, for example, infectious diseases and crooked bodily postures, and at strengthening character through education (Bonde, 2006; Palmblad & Eriksson, 1995). This health and hygiene discourse and the tight relationship between pedagogic and physiotherapeutic gymnastics gave legitimacy to Swedish gymnastics. Furthermore, this type of bodily exercise also encompassed PE for girls, which, over the years, led to a strong female PETE culture. From a societal perspective, this suited the task of PE well. The alternatives for bodily exercise and the training of girls’ bodies were few in number at that time (Carli, 2004; Kirk, 2010; Lundvall & Meckbach, 2003). Furthermore, from the point of view of scientific legitimacy, there were no alternatives to Ling gymnastics. Thus, sports, for example, could not compete with Ling gymnastics in this respect.

From Gymnastics to Sports: The Process of Sportification of PETE
During the first half of the 20th century, sport with its logic of competition was introduced as part of the bodily movement culture at GCI and expanded gradually to become an equal part of the PETE training practice as compared to Ling gymnastics. When Ling gymnastics rapidly lost its dominating position from the 1950s to 1960s, sports overtook that role (cf. Figures 3 and 4). From the mid-1960s, the study hours for courses in sport disciplines started to outnumber those for gymnastics (Lundvall & Meckbach, 2003). To understand these changes in physical practices in PETE, it is important to understand how sport as a physical culture spread during the 19th and 20th centuries in Sweden and globally. A vast amount of literature has described how the rise of organized sports took off in such an emphatic way. Undoubtedly, there is, as Pfister (2003) notes, “a connection between the rise of sport and the adoption of values, standards and structures of industrialization—including rationality, technological progress, the abstract organization of time and an economy aimed at accumulation of capital” (p. 71). Linked to these societal processes was also the reformation of the public school systems, which required a system for the changing ideals of manliness, where the idealization of fair play, together with an appreciation of individual achievement, competitive in character, represented values to be sought after (Mangan, 1981a, 1981b). The average man was considered superior to the average woman, with women being seen as weaker and lacking potential (Pfister, 2003; Wright, 1996). Darwinism also played an important role in forming the sports ideology: the application of Darwin’s theory of natural selection as an argument for maintaining a strong defense for the survival of the fittest, which was to be achieved by means of persistent athletic exercises and competitions (Sandblad, 1985).

In Sweden, the breakthrough for the establishment of the sports movement occurred when the first sports organization became government financed (1913) and a part of the nation’s social and moral program (cf. Lindroth, 2004). As support grew during the first decades of the 20th century, sport was taken on by PETE as well as in PE in schools. The fundamental principle of Ling gymnastics thereby became less exclusive, appeared to be of less value, and was less sought after. The representatives of Ling gymnastics were surprised that sport, which had earlier been for the upper classes, was suddenly available to the wider masses (Lindroth, 2004).

The spread of sport after World War II was also accompanied by influences of a type of physical training—circuit training—originally emerging from military training. These influences brought in new principles concerning how the training of the body was to be planned and executed (Morgan & Adamson, 1961). Effective training during short periods of time, possible to be executed in small spaces, was in many ways revolutionary compared to the more complicated exercise programs in gymnastics. The emergence of exercise science (cf. Åstrand & Rodahl, 1970), not the least with regard to aerobic conditioning, gave sport and fitness training further legitimacy at GCI (Schantz, 2009). At first, the principles of training represented by circuit training were implemented as part of male gymnastic training (Figure 3).

Alongside the sportification process, the female branch of Ling gymnastics challenged its traditional practice from the beginning of the 20th century and was influenced by an elaborated theory of body and rhythm and the concept of effort saving (Laine, 1989). Initially, these influences, involving breaking with the stiff traditional floor-standing gymnastics, met opposition and resistance (Forsman & Moberg, 1990; Lundvall & Meckbach, 2003). But it was not possible to stop this development and changing of “logic” to aesthetics because it could be justified as being in line with Ling’s intentions concerning the aesthetic branch of his system (see Figure 3). Another process that demonstrated elasticity in the application of the principles of Ling was the development of PE and children’s gymnastics toward a more natural and child centered way of moving, away from drill and command (Falk, 1903, 1913).

The nature of female gymnastics embodied values of emotions and how to put one’s soul into the movements, to liberate the body, and to provide space for self-education (Carli, 2004; Laine, 1989; Lundvall & Meckbach, 2003). The performing of movements was characterized by sensitiveness, adaptability, body awareness, and expression—the feeling of the movement. This type of body training, based on what today is called a subjective experiencing of the body (body-as-subject), provided cultural, physical, and symbolic capital that did not challenge the existing ideals of the female body at that time. Both of the above-mentioned processes must be acknowledged as mechanisms for understanding the long survival of Swedish gymnastics in the PETE programs and in school PE. The corresponding development of the male Ling gymnastics was not the case (Lundvall & Meckbach, 2003).

The popularity and success of the spread of sports is both easy and not easy to understand. With regard to former principles for the education of body and mind, it is interesting how sport, with its meaning-making principles of competition and specialization of skills, with the training of the body as an objective, could fit in so easily and replace the old virtues of the training of the body, regarding health as wholeness, without the dualism of body and soul.

The introduction of outdoor life in PETE from 1900 to 1960 (Figure 3) can be understood in relation to the organization phase of outdoor life in the late 19th century and the beginning of the 20th century. It reflects a need for new identities due to both the great demographic changes with the strong urbanization processes during this period and also the concomitant nationalism and strong surge for new national identities. In this identification process, love of nature as well as skiing emerged as strong parts of the identity profile for Swedes (cf. Sandell & Sörlin, 2008).

From Two-Gender Specific PETE Cultures to One: A Merging With Consequences
During the 1970s political striving for equal rights and employment in Sweden led to questioning of the organization of gender-separated PETE programs. Suddenly old ideals stood beside new ones. The process of integration of the male and female PETE cultures as well as the sportification process of bodily movement practices led not only to a new gender order and a loss of the female gymnastics culture, but also to a marginalization of the female PE pedagogical culture (Carli, 2004; Lundvall & Meckbach, 2003; Schantz & Nilsson, 1990; cf. Figures 4 and 5). For corresponding changes in other countries, see Kirk (2010), Wright (1996), and O’Sullivan, Bush, and Gehring (2002). Furthermore, the time allotted to courses in gymnastics decreased substantially after the coeducation reform in 1977 (Lundvall & Meckbach, 2003). The long tradition of female PETE culture, together with school PE steering documents, prevented a total termination. Courses in dance, music, and movement remained as minor parts of the coeducational PETE study program, but were aimed more at fitness gymnastics, such as workouts and aerobics (Figure 5). Former practices with their fundamental principles of aesthetics became simplified.

At GCI–GIH, the total amount of practical courses went from being the major portion of the study programs during the early 20th century to becoming more peripheral, from taking up 80% of the total study time in the 1920s to less than 15% about 90 years later (Lundvall & Meckbach, 2012; Tolgfors, 1979). A parallel academization process of PETE took place in general, and globally, after the 1970s (e.g., see Kirk, 2010; Kirk et al., 1997; Tinning, 2010).

Everyday Life Physical Activity as Bodily Movement Practice: Disagreements in Modern Time During the late 20th century, new and other practices of physical activity started to be demanded. Recommended amounts and levels of physical activity were distributed in 1996 by the U.S. Surgeon General (U.S. Department of Health and Human Services, 1996). This way of thinking about children’s and young peoples’ needs for physical activity bore some resemblance to former medical arguments for the prevention of disease and for the curing of the sick that started nearly 200 years earlier.

Everyday life physical activity as a way of thinking gradually became established in society around the beginning of the 21st century, originally taken on by stakeholders in public health, actors outside the field of PETE, and academic disciplines related to sports (Ainsworth, 2005; McKenzie, Alcaraz, Sallis, & Faucette, 1998; Morgan, 2000). This thinking signaled that children and adolescents need to learn how to become and stay physically active in everyday life (McKenna & Riddoch, 2003; Smith & Biddle, 2008; Trost, 2006). Changes in society had led to a focus on physical inactivity among the population. This scenario developed even though there had never before been so many opportunities for participation in organized sports. An outspoken fear of to what physically inactive lifestyles could lead among young people (including reports of obesity crises) was strongly communicated (World Health Organization, 2002). Once again, the question of how physical exercise could contribute to the health of a nation’s citizens came up on the political agenda.

The sought-after legitimatizing educational values and logic of practices behind this new way of thinking have not been clearly communicated so far. The rationale behind the emphasis on everyday life physical activity has given rise to criticism. Educational sociologists point out that school PE cannot only be driven by a medical risk discourse, or a pathogenic and/or normative way of thinking of physical activity and health (Gard & Wright, 2001, 2006; Kirk, 2010). Physical education is much more: It is about physical self-esteem, body awareness and abilities, personal and social development, questions of democracy, as well as critical aspects of health and health communication (Evans, 2004; Evans, Davies, & Wright, 2004; Macdonald & Hay, 2010; Siedentop, 2009). This can perhaps explain to some extent why PETE educators have shown a cautious attitude toward how the thinking about everyday life physical activity has been exposed and how it has been attempted to be implemented. It is too early to describe with any certainty how and what the construction of knowledge around everyday life physical activity will represent in terms of new or renewed bodily movement practices in the area of PETE in general and globally.

The first compulsory course in everyday life physical activity at GIH was started in 2004 in two transdisciplinary courses (Idrottshögskolan, 2002, 2003), which were demanded in a teacher education reform (Figure 6). These dimensions of human movement were introduced in a context of physical activity, public health, and sustainable development (Schantz, 2002, 2006; Schantz & Lundvall, forthcoming). Hence, it is possible to state that learning sports as the predominant bodily movement practice in PETE programs and school PE has been challenged.

Post-Overview Reflections
In this article, a model clarifying the multiplicity of fundamental principles and dimensions of bodily movement practices in a specific, but for the development of PETE, central setting in Sweden has been presented. The model has been used to illustrate the continuity and discontinuity of movement practices. Thereafter, mechanisms and contextual backgrounds to these changes over time have been described.

Although national and cultural differences in how countries organize their PETE programs and school PE exist, there are reasons to believe that the similarities of the development described outnumber the differences. The scheme of continuity and discontinuity stimulates a discussion about what values have been gained, what has been lost, and what possible values have not been introduced as part of PETE.

The introduction of new physical activity logics in PETE has sometimes been dependent not only on the meaningfulness of a certain logic but also on power relations. The introduction of sport is such an example. Furthermore, there are also examples of dramatic changes that have taken place without being desired or planned for intentionally. The rapid decline of female gymnastics at the beginning of the 1980s as a result of the introduction of coeducation is an example. Furthermore, Ling gymnastics faded away after World War II and, with that, faded the principles of movement practices aimed at dimensions such as general body awareness, posture, and ability to maintain motor control. Again, these consequences were not foreseen.

Another lesson is that such unforeseen consequences can be difficult to handle in terms of compensatory pedagogic actions. The values of the female gymnastics and the Ling gymnastics were dependent on strong framing cultures that had been developed over long periods of time, and indeed, the creation of new cultures fostering the best values of those previous cultures is difficult to achieve. Therefore, as a memento, it is suggested that, before changing the content of PETE, one should try to create different scenarios to counteract the possibility that that decision may lead to unforeseen effects.

The overview also makes it clear that the dimension of movement practices connected to different forms of artistic dance have been left out in PETE. This exclusion has, with few exceptions (Schantz & Nilsson, 1990), not been an issue that has been discussed. Indeed, most likely, this would not have been the case if it had been a traditionally male-dominated domain of physical activity. Among these gender issues is also that females taking up different forms of traditionally male-dominated sports is appraised positively, whereas attempts in the opposite direction are generally few in number or entirely absent and lack clear support in the currently governing mind-sets within PETE.

The existence of a multiplicity of logic of movement practices in the field of physical activity points to distinct values of each of the fundamental principles underlying these practices. In line with this, the interaction between different kinds of movement practices and the individual enlarges his/her points of reference in relation to body, movement, and mind.

With such a view constituting a rationale for different physical activities in PETE, one can ask what balances in time allocation are reasonable for attaining a goal of widening the personal experiences and securing “breadth” as an educative value of its own. This takes into account that most of the PE students of today have a strong personal experience in sports, whereas their experience with other physical activity cultures is meager (Brun Sundblad, Meckbach, Lundvall, & Nilsson, 2010). They have what Bourdieu would call a strongly developed taste for sport, forming part of a strong sport habitus (Bourdieu, 1984; Engström, 2008).

Another dimension of reflection on the PETE content deals with what PE contents in schools may be important for adult behavioral patterns of physical activity. Not much cross-sectional or longitudinal research exists on those issues, but there are indications that socializing into sport activities might not effectively foster physically active lifestyles among adults. Instead, schooling into a broad movement repertoire, as well as experiences of outdoor life, appears to be more effective in this respect (Engström, 2008).

Recent knowledge highlights that, in relation to physical activity, one has to take into account the multiplicity and complexity of young peoples’ lives. Context and social interaction play a central role. Children and adolescents are social actors that navigate in the landscape that surrounds physical movement culture. More attention has to be given to how the “healthy citizen” is constructed. What does it mean to live on the countryside, to live in inner cities, or to have the gym or the sport club as the social place for physical activities? In what ways does the place create meanings and relations? And for whom? Which physical activities are included or excluded (Wright & Macdonald, 2011; Thedin Jakobsson, in press)? According to current reports and research studies on school PE in Sweden, students learn sports but not about health and how to take responsibility for healthy physically active lifestyles (Lundvall & Meckbach, 2008; Quennerstedt, Öhman, & Ericson, 2008; Skolinspektionen, 2010). These issues have also been highlighted globally (Hardman & Green, 2011; Green, 2008; Pühse & Gerber, 2005)

New scenarios concerning health, well-being, and illness, including rising numbers of school students experiencing stress and forms of psychological unhealthiness (Folkhälsoinstitutet, 2011), migration, economic recessions, growing segregation among social classes, and an uneven distribution of access to physical activity and health knowledge, have continued to challenge the stability of health among societies’ citizens. The overview relates the content matter of PETE over time to influences of different societal contexts. From this perspective, the relation of physical activity in PETE to major current societal challenges, such as the obesity and type 2 diabetes epidemics, as well as issues related to sustainable development (cf. Schantz & Lundvall, forthcoming) and globalization, are examples of matters that deserve to be thought through and discussed in much more depth than what appears to be the case in most PETE institutions and countries at present.

References
1. Ainsworth, B. (2005). Movement, mobility and public health. Quest, 57, 12–23.
2. Annerstedt, C. (1991). Idrottslärarna och idrottsämnet [The PE teachers and the subject of PE] (Doctoral dissertation). Gothenburg University, Gothenburg, Sweden.
3. Åstrand, P.-O., & Rodahl, K. (1970). Textbook of physiology: Physiological bases of exercise. New York, NY: McGraw-Hill.
4. Bonde, H. (2006). Gymnastics and politics. Niels Bukh and male esthetics. Copenhagen, Denmark: University of Copenhagen, Museum of Tusculanum.
5. Bourdieu, P. (1984). Distinction: A social critique of judgement of taste. London, England: Routledge.
6. Bourdieu, P. (1990). The logic of practice. Cambridge, England: Polity Press.
7. Brun Sundblad, G., Meckbach, J., Lundvall, S., & Nilsson, J. (2010). Orka hela vägen. Upplevd hälsa, idrotts- och träningsbakgrund bland studenter på en fysiskt inriktad yrkesutbildning. Lärarstudenter GIH 2008, delrapport 1: 2009 [Managing all the way. Self-reported health, sports and training background of students in physical activity-related higher education programs. Teacher students, GIH 2008, partial report 1:2009]. Stockholm, Sweden: Gymnastik- och idrottshögskolan.
8. Carli, B. (2004). The making and breaking of the female culture. The history of Swedish physical education ‘in a different voice’ (Doctoral dissertation). Gothenburg University, Gothenburg, Sweden.
9. Drakenberg, S., Hjort, C., Nerman, E., Levin, A., & Svalling, E. (1913). Kungliga Gymnastiska Centralinstitutets historia 1813–1913, utgiven av dess lärarkollegium med anledning av institutets 100-års dag [The history of the Royal Gymnastics Central Institute 1813-1913, published by its academic council on the occasion of the Institute’s 100th anniversary]. Stockholm, Sweden: Kungliga Gymnastiska Centralinstitutet.
10. Engström, L.-M. (2008). Who is physically active? Cultural capital and sports participation from adolescence to middle age—A 38-year follow-up study. Sports Pedagogy and Physical Education, 13(4), 319–343.
11. Evans, J. (2004). Making a difference? Education and ‘ability’ in physical education. European Physical Education Review, 10, 95–108.
12. Evans, J., Davies, B., & Wright, J. (2004). Body knowledge and control: Studies in the sociology of physical education and health. London, England: Routledge.
13. Falk, E. (1903). Friskgymnastik I: anteckningar från skilda källor [Pedagogical gymnastics I: notes from different sources]. Stockholm, Sweden: Palmquist AB.
14. Falk, E. (1913). Gymnastikfrågan vid Stockholms folkskolor [The question of pedagogical gymnastics in Stockholm’s elementary schools]. Stockholm, Sweden: Palmquists AB.
15. Fernandez, I. L. (2009). The social, political and economic contetxs to the evolution of Spanish physical educationalists (1874–1992). International Journal of History in Sport, 26(11), 1630–1658.
16. Folkhälsoinsititutet. (2011). Barns och ungas hälsa. Kunskapsunderlag för Folkhälsopolitisk rapport [Health of children and young people: A knowledge base for public health policy report] (Delrapport: R 2011:14). Östersund, Sweden: Folkhälsoinsititutet.
17. Forsman, C., & Moberg, K. (1990). Rytmikens inträde i den svenska gymnastiken [The introduction of rhythmics in Swedish gymnastics]. Idrottslärarlinjen 1990:6 [Physical education teacher program 1990:6]. Stockholm, Sweden: Gymnastik- och idrottshögskolan.
18. Gard, M., & Wright, J. (2001). Managing uncertainty. Obesity discourse and physical education in a risk society. Studies in Philosophy and Education, 20(6), 535–549.
19. Gard, M., & Wright, J. (2006). The obesity crises. London, England: Routledge.
20. Green, K. (2008). Understanding physical education. London, England: Sage.
21. Hardman, K., & Green, K. (2011). Contemporary issues in physical education. Maidenhead, England: Meyer & Meyer Sport.
22. Idrottshögskolan, Lärarutbildningsnämnden. (2002). Kursplan för “Hälsa och miljö I, 5 p”, fastställd 2002-06-14 [Curriculum for Health and Environment I, 5 credits, determined in 2002-06-14]. Stockholm, Sweden: Idrottshögskolan.
23. Idrottshögskolan, Lärarutbildningsnämnden. (2003). Kursplan för “Hälsa och miljö II, 5 p”, fastställd 2003-03-26 [Curriculum for Health and Environment II, 5 credits, determined in 2003-03-26]. Stockholm, Sweden: Idrottshögskolan.
24. Kirk, D. (2010). Physical education futures. London, England: Routledge.
25. Kirk, D., & Macdonald, D. (2001). The social construction of PETE in higher education: Towards a research agenda. Quest, 53, 440–556.
26. Kirk, D., Macdonald, D., & Tinning, R. (1997). The social construction of pedagogic discourse in physical education teacher education in Australia. Curriculum Studies, 8(2), 271–298.
27. Korsgaard, O. (1989). Fighting for life: From Ling and Grundtvig to Nordic visions of body culture. Scandinavian Journal of Sports Sciences, 11(1), 3–7.
28. Laine, L. (1989). In search of a physical culture for women – Women’s movement and culture in everyday life; Elli Björstén’s heritage today. Scandinavian Journal of Sports Sciences, 11(1), 15–27.
29. Lindhard, J. (1926). Über den Einfluss einiger gymnastischen Stellungen auf den Brustkast [On the effect of some gymnastic positions on the thorax]. Skandinavische Archiv für Physiologie, 47, 188–261.
30. Lindroth, J. (1993/1994). The history of Ling gymnastics in Sweden. A research study. Stadion, 19/20, 164–177.
31. Lindroth, J. (2004). Ling – från storhet till upplösning i svensk gymnastikhistoria 1800–1950 [Ling – from grandness to decline in Swedish history of gymnastics]. Eslöv, Sweden: Brutus Östlings bokförlag Symposion.
32. Ling, P. H. (1979). Gymnastikens allmänna grunder [The general foundation of gymnastics] (Facsimile ed.). Stockholm, Sweden: Svenska Gymnastikförbundet. (Original work published 1840)
33. Ljunggren, J. (2000). The masculine road through modernity: Ling gymnastics and male socialisation in nineteenth-century Sweden. In A. Mangan (Ed.), Making European masculinities: Sport, Europe, gender. European Sports History Review, 2, 86–111.
34. Lundquist Wanneberg, P. (2004). Kroppens medborgarfostran. Kropp, klass och genus i skolans fysiska fostran 1919–1962 [The schooling of the body. Body, class and gender] (Doctoral dissertation). Stockholm, Sweden, Stockholm University.
35. Lundvall, S., & Meckbach, J. (2003). Ett ämne i rörelse – gymnastik för kvinnor och män i lärarutbildningen vid Gymnastiska Centralinstitutet/Gymnastik- och idrottshögskolan under åren 1944–1992 [A subject in motion – gymnastics in the PETE program at the Royal Central Institute of Gymnastics/GIH during the period 1944–1992] (Doctoral dissertation). Stockholm University, Stockholm, Sweden.
36. Lundvall, S., & Meckbach, J. (2008). Mind the gap – Physical education and health and the frame factor theory as a tool for analysing educational settings. Physical Education and Sports Pedagogy, 13(4), 345–364.
37. Lundvall, S., & Meckbach, J. (2012). Från gymnastikdirektör till lärare i idrott och hälsa. In H. Larsson & J. Meckbach (Eds), Idrottsdidaktiska utmaningar [Didactic challenges in sports pedagogy] (pp. 250–265). Stockholm, Sweden: Liber Förlag.
38. Macdonald, D., & Hay, P. (2010). Evidence for the social construction of ability in physical education. Sport, Education and Society, 15(1), 1–18.
39. Mangan, J. A. (1981a). Athleticism in Victorian and Edwardian public schools. Cambridge, England: Cambridge University Press.
40. Mangan, J. A. (1981b). Social Darwinism, sport and English upper class education. Stadion, 7(1), 93–116.
41. McKenna, J., & Riddoch, C. (2003). Perspectives on health and exercise. New York, NY: Palgrave.
42. McKenzie, T. L., Alcaraz, J. E., Sallis, J. F., & Faucette, F. N. (1998). Effects on of a physical education program on childrens’ manipulative skills. Journal of Teaching in Physical Education, 17, 327–341.
43. Morgan, J. M. (2006). Philosophy and physical education. In D. Kirk, D. Macdonald, & M. O’Sullivan (Eds.), The handbook in physical education (pp. 97–108). London, England: Sage.
44. Morgan, R. E., & Adamson, G. T. (1961). Circuit training (2nd ed.). London, England: Bell.
45. Morgan, W. P. (2000). Prescription of physical activity: A paradigm shift. Quest, 53, 366–382.
46. O’Sullivan, M., Bush, K., & Gehring, M. (2002). Gender equity and physical education: A USA perspective. In D. Penney (Ed.), Gender and physical education: Contemporary issues and future directions (pp. 163–189). London, England: Routledge.
47. Palmblad, E., & Eriksson, B. E. (1995). Kropp och politik: Hälsoupplysningen som samhällspegel från 30-tal till 90-tal [Body and politics: The health enlightenment from the 1930s to the 1990s as a mirror of society]. Stockholm, Sweden: Carlssons.
48. Pfister, G. (2003). Cultural confrontations: German Turnen, Swedish gymnastics and English sport – European diversity in physical activities from a historical perspective. Culture, Sport, Society, 6(1), 61–91.
49. Pühse, U., & Gerber, M. (2005). International comparison of physical education: Concepts, problems, prospects. Aachen, Germany: Mayer & Mayer.
50. Quennerstedt, M., Öhman, M., & Ericson, C. (2008). Physical education in Sweden: A national evaluation. Education-line. Retrieved from htt://www.leeds.ac.uk/educol/documents/
51. Sandblad, H. (1985). Olympia och Valhalla: Idéhistoriska aspekter av den moderna idrottsrörelsens framväxt. Stockholm: Almkvist och Wicksell.
52. Sandell, K., & Sörlin, S. (2008). Friluftshistoria: Från ”härdande friluftsliv” till ekoturism och miljöpedagogi [The history of outdoor life: From ‘strengthening outdoor life’ to eco tourism and environmental pedagogy]. Stockholm, Sweden: Carlssons.
53. Schantz, P. (2002, September). Environment, sustainability and the agenda for physical education. International Council of Sport Science and Physical Education (ICSSPE) Bulletin, 36, 8–9.
54. Schantz, P. (2006). Rörelse, hälsa och miljö: Utmaningar i en ny tid [Movement, health and environment – challenges in a new time]. Svensk Idrottsforskning, 3, 4–7.
55. Schantz, P. (2009). Om Lindhardskolan och dess betydelse i ett svensk perspektiv [The Lindhard school and its influence from a Swedish perspective]. In A. Lykke Poulsen, E. Trangbæck,
56. K. Jørgensen, & N. Nordsborg (Eds.), Forskning i bevaegelse: Et nytt forskningsfelt I et 100-årigt perspektiv [Research in human movement: A new research field in a 100-year perspective] (pp. 137–167). Köpenhamn, Denmark: Museum Tusculanums Forlag, Köpenhamns Universitet.
57. Schantz, P., & Lundvall, S. (forthcoming). Changing perspectives on physical education in Sweden: Implementing dimensions of public health and sustainable development. In M.- K. Chin & C. R. Edginton (Eds.), Physical education and health: Global perspectives and best practice. Urbana, IL: Sagamore.
58. Schantz, P. G., & Nilsson, J. (1990). Skolans kroppsövningar i obalans: Tillför en konstnärlig dimension [Imbalance in the school’s physical exercises – add an artistic dimension]. Tidskrift i Gymnastik, 6, 10–17.
59. Siedentop, D. L. (2009). National plan for physical activity: Educational sector. Journal of Physical Activity and Health, 6(2), 168–180.
60. Skolinspektionen. (2010). Mycket idrott och lite hälsa. Skolinspektionens rapport från den flygande tillsynen i idrott och hälsa [Lot of sports and little health. Report from the flying inspection of the Swedish Schools Inspectorate] (Report 2010:2037). Stockholm, Sweden: The Swedish Schools Inspectorate.
61. Smith, A., & Biddle, S. (2008). Youth physical activity and sedentary behavior challenges and solutions. Champaign, IL: Human Kinetics.
62. Söderberg, B. (1996). P.H. Ling i gungning. En strid på 1940-talet om Linggymnastikens förflutna [P.H. Ling under attack. A battle during the 1940s concerning the past of Ling gymnastics]. In J. Lindroth, Idrott, Historia och Samhälle, Svenska Idrottshistoriska föreningens årsskrift [The annual publication of the Swedish Sports History Association]. SVIF-Nytt, 4, 100–117.
63. Thedin Jakobsson, B. (in press). What makes teenagers continue? A salutogenic approach to understanding youth participation in Swedish club sports. Physical Education and Sport Pedagogy.
64. Tinning, R. (2010). Pedagogy and human movement: Theory, practice and research. London, England: Routledge.
65. Tolgfors, B. (1979). Historik över GIH-utbildningarnas historia under senaste 50-årsperioden [History of GIH – the Swedish School of Sport and Health Sciences’ educational programs during the last 50-year period]. Tidskrift i Gymnastik, 9, 323–330.
66. Trost, S. (2006). Public health and physical education. In D. Kirk, D. Macdonald, & M. O’Sullivan (Eds.), The handbook in physical education. London, England: Sage.
67. U.S. Department of Health and Human Services. (1996). Physical activity and health. A report of the Surgeon General (Executive summary). Washington, DC: Author.
68. World Health Organization. (2002). How much physical activity needed to improve and maintain health? Retrieved from www.who.int/hpr/physactiv/pa.hoe.much.html/
69. Wright, J. (1996). Mapping discourses of physical education: Articulating a female tradition. Journal of Curriculum Studies, 28(3), 331–351.
70. Wright, J., & Macdonald, D. (2011). Young people, physical activity and the everyday. London, England: Routledge.

2014-01-27T19:05:47-06:00January 27th, 2014|Contemporary Sports Issues, General, Sports Exercise Science, Sports Studies and Sports Psychology, Women and Sports|Comments Off on Physical Activities and Their Relation to Physical Education: A 200-Year Perspective and Future Challenges

Comparison of Body Image Perceptions for Female Competitive Dancers, Fitness Cohort, and Non-Dancers in a College Population

Submitted by Lorraine Killion, Ed.D. & Dean Culpepper, Ph.D.

ABSTRACT
Body image is a complex synthesis of psychophysical elements that are perpetual, emotional, cognitive, and kinesthetic (1). The desire to achieve and maintain an ideal weight is a prevalent goal among females. The purpose of this study was to examine a female population of competitive dancers, control, and fitness cohorts’ body image and eating characteristics. A total of 51 (29 dancers, 12 control, and 10 fitness) subjects completed the MBSRQ-AS, EAT-26, a Physical Activity Questionnaire, Stunkard Figural Silhouettes, and body fat measurements. A MANOVA was conducted to determine group differences and showed a significant relation (Wilk’s Lambda = .106, F=8.735, p<001). Post hoc tests were conducted to determine directionality and showed that the dancers scored significantly higher on the Appearance Orientation subscale (p=.034) with no difference between the control and fitness cohort. Dancers also significantly perceived themselves to be overweight (p=.048) with no difference between the other two groups. Both the dancers (p<.001) and the fitness cohort (p<.001) scored as exhibiting disordered eating patterns as rated by the EAT-26. Even though the dancers had a low percent body fat (M=17.6), they tended to place more importance on how they look. The dancers perceived themselves to be overweight and engaged in disordered eating patterns. These types of perceptions and behaviors are disturbing, but not surprising since dancers have a drive for thinness to compete (2). To fully understand the scope of the issue and the psychological factors that accompany the quest for achieving a certain appearance, future research should include other female cohorts such as elite athletes, obligatory exercisers, and sedentary females to determine any similarities and differences in the groups.

INTRODUCTION
Research has documented and quantified a shift towards a thinner ideal shape for females in the Western culture for the past 20 years (3). Body image has been shown in numerous studies to be a key issue for females. Body image has been described as a multidimensional construct that describes internal, subjective representations of physical and bodily appearance (4). The internal representations of one’s own body include both cognitive and perceptual elements (5). In addition, eating disorders have been shown to be prevalent in females with more than 90 percent of those with eating disorders are women between the ages of 12 and 25 years of age (6, 7, 8). Research indicates that both of these factors (body image and eating disorders) are present among elite performers of certain sports or physical activities, ballet dancers, and professional dancers (8). Yet little has been reported on dance team participants (9, 10, 11).

Dance team is difficult to research due to the paucity of literature available and the complexity of terminology. Also, dance team is a nebulous term to define. Research demonstrates common referrals to spirit teams, spirit squads, dance teams, as well as pom squads. While the confusion in labeling and current argument as to whether this is an activity or a sport still looms, one fact that remains constant is competitive spirit teams is one of the fastest growing areas of participation for females (12).

Among high school participants, over 96,718 females were accounted for in the 2010-2011 high school athletics participation survey conducted by the National Federation of State High School Associations, ranking competitive spirit teams ninth for female participation. At the college level, the National Collegiate Athletic Association (NCAA) reported that spirit squad has experienced the most growth for women’s sport (13, 14). A nationwide Division I study conducted during the 2001-02 academic school year investigated the prevalence of dance and cheerleading programs and reported 89% of the institutions contacted indicated they sponsored competitive dance (12).

The current emerging phenomenon of dance teams has witnessed the rise in visibility of participants at sporting events and are known for their pre-game and half-time routines. Dance teams are comprised of competitive dancers who are required to practice for long hours in movements, choreography, and synchronicity among dancers. Participants are also required to incorporate specific choreography (i.e., contemporary, hip-hop, or jazz) and technical skills (jumps, kicks, and other gymnastic-type skills) into the routine. It is highly competitive and requires hours of rehearsal to master precise movements in harmony with other members of the team.

The increasing number of females participating in dance team competition is prevalent. Long rehearsal hours, use of mirrors, and dance outfits, place dance team participants at risk of body image concerns (15, 16, 17, 18). Of additional concern is the presence of wearing dance outfits which possibly place them as subjects of objectification, or being evaluated by gazing or being observed or “checked out” on the basis of their appearance (17, 19, 10).

With the growing number of females participating in dance team competition, a further examination of the psychosocial factors that accompany this new sport warrants investigation including the importance of assessing potential body image disturbance. This study was designed to examine the perceptions of dance team participants, fitness participants, and non-dancers in a college population.

METHODS
Upon Internal Review Board (IRB) approval, fifty one subjects were recruited from two university campuses. Informed consent was obtained prior to the study through an information letter that was administered to participants in dance and physical fitness classes.

Participants
Participants were female students enrolled in university classes and dance teams. Two university campuses were involved in the study and yielded a total of 51 participants. The study was comprised of 29 dancers, 10 fitness students, and 12 control subjects. The mean age and standard deviation for the participants were: dancers (M = 20.69, SD = 2.25), fitness (M = 25.40, SD = 8.67), and control (M = 20.42, SD = 0.996). The dancers were from university dance teams, the fitness participants were enrolled in fitness classes, and the participants in the control group were randomly selected from general university courses.

Instruments
Each subject completed questionnaires assessing participant demographics, physical activity involvement using the NASA Physical Activity Scale and body image perceptions using the Stunkard Figural Rating Silhouettes. Eating behavior patterns were assessed utilizing the Eating Attitudes Test (EAT-26) and attitudes concerning body image were assessed with the Multi- dimensional Body-Self Relations Questionnaire (MBSRQ). Anthropometric measurements (height and weight) were then taken. Weight was taken using a Tanita WB-110A Digital Scale and height was taken using a using a Seca 420 measuring stadiometer. Body fat measurements were taken on each participant using an Omron Fat Loss Monitor, Model HBF-306C. The Fat Loss Monitor (Omron Fat Loss Monitor, Model HBF-306C) displays the estimated value of body fat percentage by bioelectrical impedance method and indicates the Body Mass Index (BMI). The bioelectrical impedance, skinfold, and hydrostatic weighing methods have all been shown to be reliable measures of body composition (r = .957-.987). (23)

Eating Attitudes Test (EAT-26)
The Eating Attitudes Test (EAT-26) was used to differentiate participants with anorexia nervosa, bulimia nervosa, binge-eating, and those without disordered eating characteristics. It is a 26-item measurement consisting of three subscales: 1) dieting, 2) bulimia and food perception, and 3) oral control. Scoring for this instrument was a Likert scale of six possible answers (always, usually, often, sometimes, rarely, never). Scores ranged from zero to three for each question and a total score greater than 20 indicates excessive body image concern that may identify an eating disorder (20, 21). The EAT-26 has been proven to be a reliable (r =.88) measurement. (7)

Figural Rating Silhouettes
Body size judgments were obtained using the Stunkard Figure Rating Scale (see figure 1). This scale consists of a nine-figure scale of numbered silhouettes that increase gradually in size from very thin (a value of 1) to very obese (a value of 9). (22) Two body size perception variables were included in the current study. “Self-perceived body size” is the number of the figure selected by participants in response to the prompt “Choose the figure that reflects how you think you currently look.” “Ideal body size” is the number of the figure chosen in response to the prompt “Choose your ideal figure.” This scale has good test-retest reliability and adequate validity (23, 24). Following the methods of other investigators, we defined body size satisfaction as the difference between self-perceived body size and ideal body size (25, 26, 27, 28). A body size discrepancy index variable was created for each participant by subtracting the number of the figure selected as the ideal body size from the number of the figure selected as the self-perceived current body size (28). A high body size discrepancy value signifies low satisfaction with body size, and a low value signifies greater satisfaction with body size.

Multidimensional Body-Self Relations Questionnaire
The Multidimensional Body-Self Relations Questionnaire (MBSRQ) is a 69 item self-report inventory for the assessment of self-attitudinal aspects of the body image construct. The MBSRQ measures satisfaction and orientation with body appearance, fitness, and health. In addition to seven subscales (Appearance Evaluation and Orientation, Fitness Evaluation and Orientation, Health Evaluation and Orientation, and Illness Orientation), the MBSRQ has three special multi-item subscales: (1) The Body Areas Satisfaction Scale (BASS) approaches body image evaluation as dissatisfaction-satisfaction with body areas and attributes; 2) The Overweight Preoccupation Scale assesses fat anxiety, weight vigilance, dieting, and eating restraint; and 3) The Self-Classified Weight Scale assesses self-appraisals of weight from “very underweight” to “very overweight.” Internal consistency for MBSRQ subscales range from .74 -.91. This questionnaire has been studied and used extensively in the college population. Internal consistency for the subscales of the MBSRQ ranged from .67 to .85 for males and .71 to .86 for females (9).

Physical Activity Scale
Level of physical activity was obtained by self-report with the NASA Activity Scale (NAS) (29, 30). The scale enables subjects to rate their general activity behavior over the previous 30 days. The scale range is from 0 to 10, which is based on the total weekly minutes spent in exercise or the total weekly miles run or walked. A NAS of 0-1 represents very low activity. A rating of 2-3 represents regular recreation or work of modest effort in such activities as golf or yard work for a weekly total of between 30 min to 2 h. Ratings of 4-10 represent regular participation in aerobic exercise ranging from light to heavy exercise.

Procedures
The participants were instructed by a trained individual to fill out the information packets provided on clipboards. First, the participants completed a personal identification and demographic sheet that contained general information such as age and dance or sport category. The participants then completed the MBSRQ-AS, the EAT-26, Physical Activity Questionnaire, and the Stunkard Figural Rating Scale (31, 20, 29, 22). As the participants completed the written component of the study, another trained individual took height and weight measures of the participants and recorded the body mass index (BMI) from a hand-held BIA analyzer. Weight was taken using a Tanita WB-110A Digital Scale and height was taken using a using a Seca 420 measuring stadiometer. A test/retest method was utilized for both measures to offset measurement error. In the measure of weight, the individual’s weight was recorded, the participant stepped off the digital scale and the scale was returned to “zero”. The measure was then taken again and recorded. In the measure of height, the same procedure of test/retest was used. When all measures were taken, the average of the two measures was then recorded. The measures were then taken by the researchers and converted using the formula (BMI = weight/height M2). BMI was then calculated and recorded for all participants. When the information was completed, the participants returned the packets to the trained administrator. Data sheets were collected and kept in a locked file cabinet for confidentiality.
A total of 51 participants completed the MBSRQ-AS, EAT-26, a Physical Activity Questionnaire, Stunkard Figural Silhouettes, and body fat measurements. Descriptive statistics are presented in Table 1. The Dancers and the Fitness group were significantly lower in body fat and higher in physical activity and the on the EAT-26. A MANOVA was conducted to determine group differences among the different measures and the subscales.

Table 1 – Figure Rating Means for each Group (dancer, fitness, & control)
Screen Shot 2014-01-24 at 4.14.52 PM

RESULTS
The MANOVA indicated a significant relation (Wilk’s Lambda = .106, F = 8.735, p<.001). Post hoc tests were conducted and analyses were examined to determine directionality. Results showed that the dancers scored significantly higher on the Appearance Orientation subscale (p=.034) with no difference between the control and fitness cohort. Dancers also significantly perceived themselves to be overweight (p=.048) with no difference between the other two groups. Both the dancers (p<.001) and the fitness cohort (p<.001) scored as exhibiting disordered eating patterns as rated by the EAT-26 (see Table 2).
Even though the dancers had a low percent body fat (M=17.6), they tended to place more importance on how they look. Body dissatisfaction measures often focus on body build and are operationalized as the difference between ideal and self-perceived current figure as selected from a group of drawings (32, 33, 34). Measures of body dissatisfaction were computed by subtracting participants’ ratings of their Current Body Size (CBS) from their Ideal Body Size (IBS) to create a discrepancy index (DI). (28) The DI’s for each group were calculated with means and standard deviations recorded: Dancers (-.59/1.11), Fitness Group (-1.04/.966), and Control (-1.55/.85). The dancers in this study were dissatisfied with their bodies and wanted a thinner body as described in the discrepancy index, indicating a higher level of importance on their appearance (p=.045).

Table 2-Percent Fat and Eat-26 Totals for Subjects
Screen Shot 2014-01-24 at 4.15.08 PM

DISCUSSION
The primary focus of this investigation was to examine collegiate dance team participants to see if they exhibited body image distortions and disordered eating habits as exhibited in other female performers. Even though the dancers had a low percent body fat (M = 17.6), they tended to place more importance on how they look. The dancers perceived themselves to be overweight and engaged in disordered eating patterns. These types of perceptions and behaviors are disturbing, but not surprising since dancers have exhibited a drive for thinness to compete (2).

The findings of the data for this study are consistent with previous studies regarding body image in females (6, 35, 36). The females in this study perceived their current figure as heavier than their ideal figure. Although literature available on dancers exists, many of the studies have focused on ballet dancers and other professional dancer types. Future research should examine dance team participants to see if the pressures are similar (i.e., rehearsing with mirrors and being viewed during their performance by an audience). To fully understand the scope of the issue and the psychological factors that accompany the quest for achieving a certain appearance, future research should include other female cohorts such as elite athletes, obligatory exercisers, and sedentary females to determine any similarities and differences in the groups.

These results indicate that dancers had higher incidence of negative body image disturbances as compared with the controls. Dancers are usually expected to be slim, well-proportioned, and toned and are placed under a great deal of pressure to maintain these features. Often, the various aspects of a dance class can potentially lead to a negative body image (37). The pressures of being thin may present negative body images for dance team members (38). A national survey conducted reported that body image concerns continue to be prevalent among American women (39). Levels of body dissatisfaction may also foster negative affect because appearance is a central dimension for women in our culture (40).

While the dangers of distorted body image are present in the dance world, measures to minimize their impact should include coaches who focus on performance rather than personal appearance. Taking an active interest in how their dancers view themselves is critical to a more comprehensive understanding of the causes of body image concern. By further addressing this issue, researchers can also help minimize health risks in female participants as well as reduce body image dissatisfaction.

Limitations & Implications
Limitations to this study include the sample size. In addition, this study investigated indicators of disordered eating attitudes and behaviors rather than clinical diagnoses of eating disorders. Other variables that are contributing factors to the prevalence of disordered eating were not investigated. The results of the EAT-26 test were not intended to diagnose nor suggest an eating or life-threatening disorder; however, the EAT-26 was used because it has proven to be an effective screening tool in identifying eating disorder symptomology and allows for further investigation for treatment.

APPLICATIONS IN SPORT
Body image has been the subject of much research conducted in recent years. As a result, body image is now recognized a multidimensional construct with complex aspects, particularly perceptual. The majority of the existing data indicates that body image concerns are prevalent among American females. With the recent phenomenal growth of dance team participation and the increasing number of female participants; a closer examination is warranted. Yet, there is a paucity of research available on dance team participants and their perceptions of their body appearance. Because dance team members wear a designated uniform/outfit, dance to a learned synchronized routine, and perform in front of an audience, they are subjected to visual scrutinization of fans/viewers. The uniqueness of the stressors and demands placed on the dancers complicates this issue. Additional knowledge of how dance team members perceive how they look and what the audience thinks of them in regards to abilities and their physical appearance deserves further investigation. Dealing with such information will not only benefit dance team members body image and self-esteem, but assist coaches and directors in ways to assist young women in resulting body image dissatisfaction.

ACKNOWLEDGMENTS
None

REFERENCES
1. Thompson, K. (1999). Exacting beauty: Theory, assessment, and treatment of body image disturbance. Washington, DC: American Psychological Association.
2. Wood, K. C., Becker, J. A., & Thompson, J. K. (1996). Body image dissatisfaction in preadolescent children. Journal of Applied Developmental Psychology, 17, 85-100.
3. Garner, D. M., Garfinkel, P. E., Schwartz, D., and Thompson, M. (1980). Cultural
expectations of thinness in women. Psychological Reports, 47, 483-491.
4. Cash, T. F., & Pruzinsky, T. (1990). Body images: development, deviance, and
change. New York: NY, Guilford Press.
5. Cash, T. F., & Brown, T. A. (1987). Body image in anorexia nervosa and bulimia
nervosa: A review of the literature. Behavioral Modification, 11, 487-521.
6. Fallon, A. E. & Rozin, P. (1985). Sex differences in perceptions of desirable body
shape. Journal of Abnormal Psychology, 94, 102-105.
7. Garner, D. M. & Garfinkel, P. E. (1979). The Eating Attitudes Test: An index of
the symptoms of anorexia nervosa. Psychological Medicine, 9, 273-279.
8. National Alliance for the Mentally Ill (2003). Fact sheet,
http://www.ncsacw.samhsa.gov/files/
9. Sundgot-Borgen, J. (1993). Prevalence of eating disorders in elite female athletes.
International Journal of Sport Nutrition, 3, 29–40.
10. Tiggemann, M., and Slater, A. (2001). A test of objectivity theory in former
dancers and non-dancers. Psychology of Women Quarterly, 25, 1, 57-64.
11. Pierce, E. F., & Daleng, M. L. (1998). Distortion of body image among elite
female dancers. Perceptual and Motor Skills, 87, 3, 769-770.
12. Sowder, K., Hennefer, A., Pemberton, C., & Easterly, D. (2004). Defining
“Sport”. Athletic Management, 16.02, February/March.
13. National Federation of State High School Associations (http://www.nfhs.org/)
14. National Collegiate Athletic Association (NCAA) (http://www.ncaa.org/)
15. Carman, J. (2011). Passing on the Magic. Dance Magazine, 85, 12, 50-54.
16. Radell, S. A., Adame, D.D., & Cole, S.P. (2002). The effect of teaching with
mirrors on body image and locus of control in women college dancers: A pretest-
posttest study. Research Quarterly for Exercise and Sport, 74, 1, A-3.
17. Schneider, D. J. (1974). Effects of dress on self-presentation. Psychological
Reports, 35, 1, 167-170.
18. Fredrickson, B. L., Roberts, T., Noll, S. M., Quinn, D.M., & Twenge, J.M.
(1998). That swimsuit becomes you: Sex differences in self-objectification,
restrained eating, and math performance. Journal of Personality and Social
Psychology, 75, 1, 269-284.
19. Price, B. R., & Pettijohn, T. F. (2006). The effect of ballet dance attire on body
and self-perceptions of female dancers. Social Behavior and Personality, 34,
8, 991-998.
20. Garner, D. M., Olmsted, M. P., Bohr, Y., & Garfinkel, P. (1982). The eating
attitudes test: Psychometric features and clinical correlates. Psychological
Medicine, 12, 871 878.
21. Williamson, D. A., Davis, C. J., Goreczny, A. J., & Blouin, D. C. (1989). Body
image disturbances in bulimia nervosa: Influences of actual body size. Journal of
Abnormal Psychology, 98, 97-99.
22. Stunkard, A., Sorensen, T. & Schulsinger, F. (1983). Use of the Danish adoption
register for the study of obesity and thinness. In S. Kety (Ed.), The genetics of
neurological and psychiatric disorders (pp. 115-120). New York: Raven Press.
23. Thompson, J. K. & Altabe, M. N. (1991). Psychometric qualities of the figure
rating scale. International Journal of Eating Disorders, 10, 5, 615-619.
24. Smith, D. E., Thompson, J. K., Raczynski, J.M., and Hilner, J. E. (1999). Body
image among men and women in a biracial cohort: The CARDIA study.
International Journal of Eating Disorders, 25, 1, 71–82.
25. Garner, D. M., Garfinkel, P. E., and O’Shaughnessy, M. (1985). The validity of
the distinction between bulimia with and without anorexia nervosa. American
Journal of Psychiatry, 142, 581-587.
26. Flynn, K., & Fitzgibbon, M. (1996). Body images and obesity risk among Black
females: A review of the literature. Annals of Behavioral Medicine, 20, 1, 13-24.
27. Furnham, A., Badmin, N., & Sneade, I. (2002). Body image dissatisfaction:
Gender differences in eating attitudes, self-esteem, and reasons for exercise. The
Journal of Psychology, 136, 6, 581-596.
28. Thompson, K. (1996). Assessing body image disturbance: Measures,
methodology, and implementation. In J.K. Thompson (Ed.), Body image, eating
disorders, and obesity (pp. 49-81). Washington, DC: American Psychological
Association.
29. Jackson, A.S., et al. (1996). Changes in aerobic power of women, ages 20 to 64
years. Medicine and Science in Sports and Exercise, 28: 884-891.
30. Jackson, A.S., et al. (1990). Prediction of functional aerobic capacity without
exercise testing. Medicine and Science in Sports and Exercise, 22:863-870.
31. Cash, T. F. (1990). Body images: Development, deviance, and change. Cash,
Thomas F. (Ed.); Pruzinsky, Thomas (Ed.); New York, NY, US: Guilford Press,
1990. pp. 51-79.
32. Thompson, J. K., and Smolak, L. (2001). Body Image, Eating Disorders, and
Obesity in Youth: Assessment, Prevention, and Treatment. 2ndEd., Washington,
DC, US: American Psychological Association, 389. pp. 54-55.
33. Candy, C. M. & Fee, V.E. (1998). Underlying Dimensions and Psychometric
Properties of the Eating Behaviors and Body Image Test for Preadolescent Girls.
Journal of Clinical Child Psychology, 27, 117-127.
34. Collins, M. (1991). Body figure perceptions and preferences among preadolescent
children. International Journal of Eating Disorders, 10, 100-108.
35. Tiggemann, M. (1992). Body-size dissatisfaction: Individual differences in age
and gender, and relationship with self-esteem. Personality and Individual
Differences, 13, 39-43.
36. Demarest, J. & Langer, E. (1996). Perception of body shape by underweight,
average, and overweight men and women. Perceptual and Motor Skills, 83, 569-
570.
37. Oliver, W. (2008). Body image in the dance class. Journal of Physical Education,
Recreation & Dance (JOPERD), 79, 5, 18-25.
38. Irving, L. (1990). Mirror images: Effects of the standard of beauty on the self- and
body-esteem of women exhibiting varying levels of bulimic symptoms. Journal of
Social and Clinical Psychology, 9, 230-242.
39. Cash, F. & Henry, E. (1995). Women’s Body Images: The results of a national
survey in the USA. Sex Roles, 33, 19-28.
40. Thompson, K. & Stice, E. (2001). Thin-Ideal Internalization: Mounting Evidence
for a New Risk Factor for Body-Image Disturbance and Eating Pathology.
Current Directions in Psychological Science, 10, 5, 181-183.

2015-10-02T23:24:23-05:00January 24th, 2014|Contemporary Sports Issues, General, Sports Studies and Sports Psychology, Women and Sports|Comments Off on Comparison of Body Image Perceptions for Female Competitive Dancers, Fitness Cohort, and Non-Dancers in a College Population

Parental Support Behaviors for Children Participating in Community Soccer Programs.

Submitted by Alan C. Taylor, Ph.D., John T. Schweichler, B.S., Bryce L. Jorgensen, Ph.D., Ember H. McKown, B.S. and Melissa Teresak, B.S.

ABSTRACT
The current study examined the perceptions of parental supportive behaviors and activities when children are involved in community recreational soccer programs. A sample of 145 parents completed the online survey. Children ranged in age from 3-18 years old and had a mean age of 6.02 (SD= 0.86). Demographic information was gathered and twenty supportive behavior statements with likert-type scales were drawn from four general support categories: Instrumental Support, Communicative Support with Coaches, Communicative Support during Games, and Communicative Support with Child Before and After Games. Results indicated that parents were most likely to perform Instrumental Support types of behaviors (M=4.55) which included supportive activities such as attending games and practices, purchasing proper soccer equipment, and bringing game snacks. Attending their child’s soccer game (M=4.81, SD = 0.39), showing love and affection to the child who is upset and disappointed after a game (M=4.71, SD = 0.47), and purchasing and providing the correct soccer equipment (M=4.70, SD = .053) were the top-ranked parental supportive behaviors. Freely voicing frustration/opinions during the game when disagreeing with a coach’s decision (M=1.49, SD = 0.68) was ranked the lowest among all supportive behaviors. The results suggest that the goals parents have for their soccer playing children center around positive social development. Parental actions and behaviors related to visible and verbal encouragement were rated very highly as supportive activities while voicing frustration at coaches, children’s teammates, referees and their own children were rated among the lowest. These results may lead to potential collaboration between parents and coaches regarding the development of their players and children.

INTRODUCTION
Researchers use many approaches to investigate the influence of sports on individuals as well as the influence of parents on their children. Millions of youth each year take part in sports, which can foster positive development (15). Of paramount importance to a successful youth sport experience is the relational environment (7).

Youth sports provide an opportunity for parents and children to form an emotional bond. Research by Dorsch, Smith and McDonough (6) found that parents experienced many changes in their behavior, cognition, affect, and general parent-child relationship as a result of their child’s participation in youth sports. Similarly, a child’s perceived quality of the parent-child relationship has been shown to be a predictor of a child’s enjoyment and experience while playing the sport (12-13, 16).

Parents play a large role in the sport experience of their children (10). In fact, parents have been shown to have the largest impact compared to peers, teachers, and coaches (18). Their influences can be communicated through support and their own motivations for their child’s participation (5). For this study, we have defined parental support as overt behaviors and activities parents perform to help children be successful in their selected activity and to help them feel positive about their efforts.

Support can be material such as registration (1) or emotional support (9). Results reported by Brustad (2-3) suggest that parental beliefs and positive sentiments about their child’s physical activity was a greater influence on a child participation and motivation than role-playing factors. Thus, it is important to understand the types of support that many parents provide and view as important.

Previous research has shown that parents have an important role in their child’s development (17) and more recent research suggests this extends into a parent’s involvement in their child’s activities, such youth sports programs (6, 13). We argue that relational scaffolding theory, as postulated by Vygotsky (17), can be used to conceptualize the parent-child interactions surrounding community youth sport participation. Relational scaffolding theory assumes that children learn through supportive interactions with others which make possible thoughts or actions that otherwise would be outside of the grasp of the child. For example, when teaching a child a skill, a parent may begin training the child using a great deal of hands-on instruction and modeling. As the child becomes increasingly more confident in performing the skill, the parent allows the child to function without as much modeling and guidance, while still offering support as needed. Eventually, after the support and training of the parent over a period of time and with increasing mastery, the child is able to maneuver the skill without any assistance from parent.

Since youth sports have been viewed by previous researchers and scholars as a mode of instruction, socialization, and development (4, 8, 11), understanding the nature of the interactions between parents and children is important. To this end, the current study investigates the nature of parent’s involvement and their supportive behaviors during their child’s participation in a community soccer program. The following two research questions guided this inquiry: What behaviors and activities do parents perform to show support of their child’s involvement in a community soccer program? Which supportive behaviors are done the most and least often by parents?

METHODS
Data was gathered in collaboration with an Eastern North Carolina county’s recreation and parks department. E-mail addresses of parents whose children participated in the most recent community soccer league were provided by the recreation department. Three hundred and seventeen parents were then emailed invitations to complete an online survey of 24 general demographic questions as well as 20 parental support statements using five-point likert scales (1=strongly disagree to 5=strongly agree). If they agreed to take part in the study and before starting the survey, the parents were asked to read and electronically sign the research study’s consent to participate agreement. Upon consent, parents were presented the twenty statements regarding the behaviors and activities they use to demonstrate their support and encouragement for their children’s soccer participation (i.e., “I support my child’s soccer participation by…teaching soccer skills and providing soccer instructions to my child at home). Assuming that some of the targeted parents would have multiple children playing in community youth soccer program during the same season, we instructed the responding parents to respond to survey questions as they related only to their youngest child participating in the soccer league. This strategy was incorporated in order to reduce biases of selective support behaviors and to have the parent focus on supportive behaviors for one particular child.

Sample
Our final sample consists of 145 parents with an average age of 37.5 years. Twenty-seven were male (18.6%) and the remaining 118 were female (81.4%). Regarding reported ethnicity, the current parent sample consisted of 113 Caucasians (77.9%), eight African-Americans (5.5%), four Asians (2.8%), and four Latino/as (2.7%). Eighty-two parents responded to the survey regarding their sons (56.6%), while 61 responded regarding their daughters (42.1%). The average age of the youngest participating child was 6.04 years, with their ages ranging from 3-11 years old. Finally, 126 of the parents were married (83.4%), while ten parents were single-never married (6.6%) and 9 were single-divorced (6.0%).

Analysis
To determine the highest and lowest overall parental support behaviors, the statistical means for each supportive statement were calculated and analyzed (see Table 1). Table 1 shows the four distinct parental support categories and their overall collective means scores. In addition, the table shows the overall mean scores and corresponding standard deviation for each of the individualized supportive behaviors statements. The mean scores of each parental support behaviors were also ranked from 1-20, with one being the highest score and the behavior most likely performed by parents within this sample and 20 being the lowest score and the behavior to be least likely performed. Finally, an independent t-test analysis was performed to determine if there were significant differences between the reported means scores of parental support behaviors for male and female children. Statistical significance level for t-test analysis was set at p < .05. Table 1. Means, Standard Deviations and Rank of Parental Support for Children’s Participation in Community Soccer
Screen Shot 2014-01-21 at 10.51.06 AM

RESULTS
Among the collective parental support behaviors, parents indicated that they were most likely to perform Instrumental Support types of behaviors (M=4.55). This category included supportive activities such as attending games and practices, purchasing equipment, and bringing game snacks (See Table 1). Communicative Support with Child Before and After Games was the second highest collective parental supportive behaviors category (M=4.38) and included supportive behaviors such as giving advice and playing instruction before and after games, and showing love after a disappointing game. Attending their child’s soccer game (M=4.81, SD = 0.39), showing love and affection to the child who is upset and disappointed after a game (M=4.71, SD = 0.47), and purchasing and providing the correct soccer equipment (M=4.70, SD = .053) were the top-ranked parental supportive behaviors.

Communicating with their child’s coach/coaches through e-mail or phone throughout the season (M=4.63, SD = 0.54) was rated as the highest support behavior in the category of Communicative Support with Coaches. The three lowest ranked parental supportive behaviors all came from the Communicative Support During Game category. Freely voicing frustration/opinions during the game when disagreeing with a coach’s decision (M=1.49, SD = 0.68) was ranked the lowest among all supportive behaviors. Freely voicing frustration/opinions during the game when their child or another player makes a mistake (M=1.57, SD = 0.68) and letting the referee know when they are not pleased with a call or lack of a call (M=1.78, SD = 0.98) were both also in the bottom three lowest ranked parental supportive behaviors. When analyzing potential statistical differences of parental support behaviors for male and female children, independent t-tests showed that there were no differences at the p < .05 level. DISCUSSION AND IMPLICATIONS
Ogilvie (14) suggested that a child in sports will discover that the most rewarding attribute to their own success while participating is if they are intrinsically motivated and supported. However, Vygotsky (17) argued that parents play a critical role in the development of their child in many activities. Thus, it is important to understand the relational environment created by parent’s support behaviors within a recreational sport environment. To this end, results from the current study are the first to examine the supportive behaviors of parents within the context of a child’s participation in a community recreational sport program. The results suggest that parents goals for their children center around positive social development. Actions and behaviors related to visible and verbal encouragement, were rated very highly as supportive activities while voicing frustration at coaches, children’s teammates, referees, and their own children were rated among the lowest. In other words, it was reported that voicing encouragement and approval towards their children or their teammates for playing well during the game was considered by many to be a very effective way of showing parental support. This seems to show that parents likely recognize that their positive verbal communication during a game can demonstrate their positive supportive, while their negative verbal communication demonstrates low support. As was reported earlier, the mean age for the children was 6.02 years old. Therefore, parents with these younger children seem to want to make sure their children are given opportunities to have positive experiences and environments and they seem to be able to help make that happen. Competitive supporting behaviors (criticizing the referees, coaches, or players) that seem to relate to a team’s performance did not seem to rank highly on the parent’s list of supportive activities. This might be the difference between having children play in a recreational league versus having them play in a more competitive league or on a travel soccer team. It may also have to do with how young most of the children were when data was gathered (mean of 6 years). Competitive supporting behaviors may become more prevalent as players get older and/or move to more competitive leagues.

Responses to the positive social development items also support the theory of relational scaffolding posited by Vygotsky (17). They indicate that parents view sports as a “relational scaffold” through which children can learn skills that might otherwise be just outside of their grasp. In addition, many parents reported that they provided a high level of material (i.e., attending games, purchasing equipment or snacks) and emotional support (i.e., voicing encouragement or offering advice before, during, or after games) to their children. This indicates that the parents from the current sample work simultaneously to supplement the relational scaffolding that occurs during youth sport participation.

CONCLUSION AND SPORT APPLICATIONS
These results may lead to potential collaborations between parents and coaches regarding the development of their players and children. Parents’ moderate-to-strong agreement that they regularly communicated with coaches throughout the season in general and also before, during, and after games indicated there is a channel for such communication. The data indicated that parents seem to want to be communicative with their child’s coaches and coaches may need to provide opportunities so that this type of communication can occur successfully. Successful and deliberate parent-coach communication may allow parents to feel they are better supporting their children’s soccer participation. Further, the results indicated that parents moderately agreed that they voiced their encouragement to coaches if they supported coaching decisions. This is in contrast to the relatively low ratings for items regarding expressing frustration with coaches. Although the current study did not ascertain the specifics of these communications, these findings do support the potential for collaboration between coaches and parents in the facilitation of a child’s advancement through relational scaffolding by both parties.
Recreational youth soccer league organizers could benefit from developing and implementing collaborative coaches-parental educational seminars that would best teach parents how to show support for their child’s participation, while still encouraging positive supportive behaviors in regard to the team, players, and coaches. Coaches might also benefit from similar parent-coaches educational seminars that might teach them how to better facilitate effective parental support activities as well as effective communication techniques. In many youth recreational sports leagues, coaches are volunteer parent-coaches who are regularly looking for ways to build successful team unity, which goes beyond the players and encompasses the parents and their support activities.

The current study has a few limitations worthy of note. First, the sample size is small and is derived from a single community. Though the results are still informative, they are limited in their generalizability. Gathering parental support data from multiple youth community soccer leagues from various areas throughout the country would have likely provided more generalizable results. Another limitation to consider is the ages of the children for whom the parents reported their support behaviors. The mean age of the children for this data was 6 years of age. If our sample would have included more adolescent children, ages (12-18), the parental supportive behaviors might have been slightly different.

The potential existence of a collaborative system of interactions among parents and coaches to facilitate positive development through relational scaffolding is important and should be studied further. Specifically, future research might involve the examination of coaches’ supportive behaviors and how they agree or disagree with parental supportive behaviors. In addition, a deeper understanding of the developmental needs and abilities of children at different ages when playing soccer would likely benefit parents and coaches when placing expectations on children’s playing abilities and cognitive understanding. Therefore, an investigation of coaches’ and parents’ understanding of developmentally appropriate physical and cognitive abilities would prove helpful. Such research would provide an understanding of adult interactions surrounding children’s participation in youth supports and open a dialogue as to how parents and coaches can provide appropriate mentorship of children attempting to learn new skills and while still having fun in the process.

REFERENCES
1. Atsalakis, M. and Sleap, M. (1 996). Registration of children in a physical activity program: An application of the Theory of Planned Behavior. Pediatric Exercise Science, 8, 166-176.
2. Brustad, R.J. (1993). Who will go out and play? Parental and psychological influences on children’s attraction to physical activity. Pediatric Exercise Science, 5, 210-233.
3. Brustad, R.J (1996). Attraction to physical activity in urban schoolchildren: Parent socialization and gender influences. Research Quarterly for Exercise and Sport, 67, 316-323.
4. Coakley, J. (2011). Youth sports: What counts as “positive development?” Journal of Sport and Social Issues, 25, 306-324.
5. Dempsey, J. M., Kimiecik, J. C., & Horn, T. S. (1993). Parental influence on children’s moderate to vigorous physical activity participation: An Expectancy-value approach. Pediatric Exercise Science, 5, 151–167
6. Dorsch, T.E., Smith, A.L., McDonough, M.H. (2009). Parents’ perceptions of child-to-parent socialization in organized youth sport. Journal of Sport and Exercise Psychology, 31, 444-468.
7. Fry, M.D. (2010). Creating a positive climate for young athletes from day 1. Journal of Sport Psychology in Action, 1, 33-41.
8. Fry, M. D., & Gano-Overway, L. A. (2010). Parental influences on youth involvement in sports. In M. R. Weiss (Ed.), Developmental sport and exercise psychology: A lifespan perspective. (pp. 145-164). Morgantown, WV: Fitness Information Technology.
9. Hellstedt, J.C. (1987). The coach-parent-athlete relation. The Sport Psychologist, 1,151-160.
10. Hellstedt, J. C. (1990). Early adolescent perceptions of parental pressure in the sport environment. Journal of Sport Behavior, 13, 135-144.
11. Hoffman, J. P. (2006). Extracurricular activities, athletic participation, and adolescent alcohol use: Gender-differentiated and school-contextual effects. Journal of Health and Social Behavior, 47, 275-290.
12. Kanters, M.A., Bocarro, J., & Casper, J. (2008). Supported or pressured? An examination of agreement among parents and children on parent’s role in youth sports. Journal of Sport Behavior, 31(1), 64-80.
13. Keegan, R., Spray, C., Harwood, C., & Lavallee, D. (2010). The motivational atmosphere in youth sport: Coach, parent, and peer influences on motivation in specializing sport participants. Journal of Applied Sport Psychology, 22, 87-105.
14. Ogilvie, B. (1979). The child athlete: Psychological implications of participation in sport. Annals of the American Academy of Political and Social Science, 445, 47-58.
15. Strachan, L., Cȏté, J., & Deakin, J. (2009). An evaluation of personal and contextual factors in competitive youth sport. Journal of Applied Sport Psychology, 21, 340-355.
16. Ullrich-French, S., & Smith, A. L. (2006). Perceptions of relationships with parents and peers in youth sport: Independent and combined prediction of motivational outcomes. Psychology Of Sport And Exercise, 7(2), 193-214.
17. Vygotsky, L.S. (1978). Mind in society: The development of higher psychological processes. Cambridge, MA: Harvard University Press.
18. Weiss, M. R. & Barber, H. (1995). Socialization influences of collegiate female athletes: A tale of two decades. Sex Roles, 33, 129-140.

2014-01-21T11:27:51-06:00January 21st, 2014|Contemporary Sports Issues, Sports Studies and Sports Psychology|Comments Off on Parental Support Behaviors for Children Participating in Community Soccer Programs.

Analysis of Goal Scoring Patterns in the 2012 European Football Championship

Submitted by Michalis Mitrotasios & Vasilis Armatas

ABSTRACT
Purpose: The aim of the present study was to investigate the factors associated with goal scoring in top class football matches. Methods: 76 goals analyzed from 31 matches from the European football Championship in Poland-Ukraine in 2012. The SportScout performance analysis tool was used to time code when goal scored and the associated behaviors relating to goal scoring. Results: It was presented that 57.9 % of the goals were scored in the second half and most of them in the last 15-min period, while the first goal seems to play an important role in the final result of the match. Most goals were scored during open play (72.4%) but 27.6% scored after a set play, mainly following corner kick and free kick. Concerning initiation zone of the attack, it was presented that 56.6% began from the attacking half. Most goals were scored after a cross (43.7%) while regarding goal scoring area, over 90% of goals were scored inside the penalty area and specifically from the area between penalty spot and goal zone (42.1%). Finally, almost ½ of goals were scored without any pressure from defenders. Conclusions: The present study presented guidelines to coaches in order to design trainings similar to the actual competition and adapt the game style with regard to match status. Moreover, coaches can use this information to establish objectives for players and teams with a special reference to the offensive or defensive play.

INTRODUCTION
Match analysis is the objective recording and examination of behavioural events that occur during competition (12). The main aim of match analysis is to identify strengths of one’s own team, which can then be further developed, and its weaknesses, which suggest areas for improvement. Similarly, a coach analyzing the performance of an opposition side will use the data to identify ways to counter that team’s strengths and exploit its weaknesses (11). A performance indicator has been described as a selection, or combination, of action variables that aims to define some or all aspects of a performance (19). These indicators constitute an ideal profile that should be present in the athletic activity to achieve success and can be used as a way to predict the future behaviour of sporting activity (27).

However, what might be classified as a good performance in football, such as a high proportion of possession, a higher number of goal-scoring opportunities, shots on target or corners, does not always relate to success. A football team can be successful and win a game or competition, despite performing suboptimal (50). At all competitive levels, the main concern is simply to score at least one more goal than the opponent while in some tournament settings, goal differential may influence attacking philosophy. A single goal can change radically, and for a considerable amount of time, the strategic environment in which teams interact (38). Consequently, the most identified components of the performance in football matches are the scored goals. An analysis of how goals are scored can reveal critical factors that will help determine the most appropriate attacking strategy, briefly to obtain winning formula.

Since the landmark work of Reep and Benjamin (42), many studies have focused on goal scoring patterns in various national and international football tournaments. Reep and Benjamin (42) showed that approximately 80% of goals scored were the result of a short sequence of three or less passes and that 1 in 10 shots tend to lead to a goal. More recently, Hughes and Franks (21) showed that in the 1990 and 1994 World Cup tournaments 84% and 80% of goals respectively came from possessions of four or less passes. In addition, 80% and 77% of the shots at goal were a result of a sequence of four or less passes.

Jinshan and co-workers (25) reported on the characteristics of goals from the 14th World Cup and showed that nearly 70% of all goals were scored in the 2nd half. Armatas, Yiannakos and Sileloglou (6) studied three World Cups (1998, 2002 and 2006) and reported that more goals were scored as time progresses, however lower percentages than Jishan et al. (25). Moreover, many studies have pointed out the influence in the final score of an early goal or the first goal in a match (3, 26, 37, 51).

Bangsbo and Peitersen (7) point out the magnitude of set plays in modern football and reported that twenty are estimated to appear, in average, for each team in every match. Many studies from international and domestic tournaments have reported that about 25%-40% of all goals have been scored on set plays (3, 25, 30, 48, 49, 51).

Other research has examined the position on the pitch from which goals are scored. In a recent study Wright et al. (50) showed that from 167 goals from English Premier League, 87% of goals were scored inside the penalty area which is similar to the 90% observed by Olsen (36) for the 1986 World Cup whereas Dufour (14) reported 80% for the 1990 World Cup. Yiannakos and Armatas (51) reported that 44.4% of goals scored were inside the penalty area, 35.2% inside the goal area, and 20.4% outside the penalty area, for the 2004 European Championship in Portugal. Finally, Hughes et al. (22) showed that successful teams in the 1986 Football World Cup made more attempts inside the penalty area in comparison to unsuccessful teams.

Usually, after international tournaments, such as the European Championship, successful teams set new trends in terms of playing style and training. Indeed, others will tend to imitate the tactics and play of winning teams, seeking to master those aspects of performance which are deemed to underlie their success (21). The European Football Championship provides an opportunity to examine the best teams and players in Europe. Thus the purpose of the present study was to analyze the goals scored in the European Championship in Poland-Ukraine in 2012.

METHODS
Footage from all matches from the 2012 European Championship was obtained via recording into AVI format of the television coverage, so it was compatible with the multisport notational analysis system (SportScout) that was used. In all, there were 2 goalless matches leaving 29 matches with 76 goals. One own goal was excluded from the study. A SportScout coding template was created to allow necessary information to be drawn from the footage by two experienced coders. All the output data was exported from SportScout into an excel data base for subsequent data analysis.

The following performance indicators were analyzed:
a) Time of goal scored (0-15, 16-30, 31-45+, 46-60, 61-75, 76-90+, 1st extra time, 2nd extra time)
b) Influence in the final score of the first goal (Win, Draw, Loss)
c) Type of play (Open play, Set play)
d) Style of play (Positional play, Direct play, Counter attack)
e) Type of set play (Free kick, Corner, Penalty, Throw in)
f) Initiation zone of the attack (pitch zones)
g) Number of passes leading up to goal (1, 2, 3, 4, 5, 6, 7, 8+)
h) Type of feed prior to goal scored (Pass<10m, Pass 10-20m, Cross, Shot, Individual action)
i) Scoring area (pitch zones)
j) Actions leading up to goal (One touch, Control+shot, Control+dribble+shot)
k) Shot type (Instep shot, Inside of the foot, Header, Other)
l) Existence of pressure by defenders on scorer (Pressure, No pressure)
m) Scorer’s playing position (Striker, Winger, Midfielder, Defender)
n) Goal zone (a1, a2, a3, b1, b2, b3, c1, c2, c3)

Statistical Analysis
Firstly, a descriptive analysis of the data was done (frequency, average, standard deviation). Then, to compare distribution frequency between independent variables chi-square tests were used, while one-way repeated measures ANOVA and t-test were used to compare average. The inter-rater reliability of separate observations was calculated to guarantee the quality of the observation system. A reliability index of 0.96 was observed (intra-class correlation coefficient and kappa index). SPSS 18 was used for data analysis (Lead Technologies Inc, USA) and the level of significance was set at p < 0.05. Results
Altogether 76 goals from 31 matches were analyzed which is on average 2.62±1.42 per match. Only in two of these matches no goals were scored. At Euro 2012, 57.9% of the goals were scored in the second half and 21.1% of them in the last 15-min period as shown in Table 1. However, there was not significant difference between the first and second half of the match (F(1, 75) =1.918, p = .170) as well as ANOVA did not show that frequency of goals scored were time dependent (F (5, 71) =1.065, p= .387). As expected, results presented that the first goal is critically important to match outcome. Moreover, of the teams that scored first results showed that they won 75.9%, lost 6.9% and had drawn 17.2% of the matches (x2(2, 29) =24.069, p<0.001).
Most goals (72.4%) were scored during open play (x2(1,76) =15.211, p<0.001), mainly following positional play while the rest of them were scored after a set play (27.6%), mainly following corner kicks and free kicks, as shown in Figure 1. Concerning initiation zone of the attack, it was presented that 56.6% of goals began from the attacking half, 43.4% from the defending half, while 52.6% goals began from central zone of the pitch. No differences were found between right and left zone, where in each zone 23.7% of goals were scored (Figure 2). Table 2 illustrates the sequence length of ball possessions that resulted in goal, where 61.84% of goals came from team possessions of four passes or less. On the other hand, a sizeable amount of goals were also preceded by passing sequence eight or more, which represented roughly 20% of them.
Regarding the type of feed, most goals were scored after a cross (43.7%) or a short pass (35.2%) which were significant differently ((x2(4,71) =46.535, p<0.001) compared to feed from pass 10-20m (4.2%), shot (7.0%) and individual action (9.9%). Moreover, results presented that after the final pass, the scorer finished in most cases with one touch (63.7%) which was statistically different (x2(2,71) =28.930, p<0.001), secondly after controling the ball (19.7%) and finally after controling and dribbling before shooting (16.9%). Figure 3 shows the pitch zones from which goals were scored, where over 90% of goals were scored inside the penalty area (F (1, 75) =149.224, p<0.001), (T (1, 25) =12.216, p<0.001) and specifically from the area between penalty spot and goal zone (42.1%). Concerning the way that the goals were scored from the player, it was shown that instep shots accounted for 38.67%, inside of the foot for 32.% and header for 29.33%, whereas almost ½ of the goals (47.2%) were scored without any pressure (x2(1,72) =0,222, p=0.637) from defending players.
As expected, most of the goals were scored from strikers (41.3%) and wingers (29.3%), whereas midfielders (20%) and defenders (9.3%) had diminished percentages. Finally, Figure 4 shows the goal zones where the goals were ended.  
DISCUSSION
The aim of the study was to investigate the factors associated with goal scoring patterns in football, taking into consideration a broader range of performance indicators. Firstly, it was presented that goals scored were not time dependent. Although no statistical difference was observed, more goals scored in the second half of the matches, while 15min period analysis revealed that more goals were scored in the beginning and in the end of the second half. Game period has been suggested as one of the factors that influence team performance (10) and the majority of papers in the literature are in agreement with the present study. In this way, Kirkendall and his colleagues (28) found that goals were most common at the start of the second half and the end of the game in World Cup 1998. Moreover, Abt, Dickson and Mummery (1) observed an upward trend in the number of goals scored as time progressed in 703 matches played during four seasons of the Australian National Soccer League. The highest percentage of goals was scored in the last 5-minute period of each half (41st-45th min. and 86th -90th min.). Armatas and Yiannakos (3) verified that in 2006 FIFA World Cup matches the greatest number of goals was scored between the 75th and 90th minutes, while Yiannakos and Armatas (51) in their study for Euro 2004 found that significant more of goals were scored in second half.
The results of the present study could be attributed in tactical and physiological factors. In a recent study, Pratas, Volossovitch and Ferreira (39), found that teams perform significantly fewer direct plays in the first half and make significantly more shots in the second half of Portuguese league matches. One reason could be that players consider rapid movements with the ball to involve risk and therefore attempt less such actions during the first half, when the match result is not yet decided (10). Additionally, Reilly (43) reports that play may become urgent towards the end of match as teams chase a result, thus players are more willing to take greater risks towards the end of a match in order to affect an outcome (1). It is also possible that the losing team pushes players forward in order to create scoring opportunities, thereby scoring themselves or conceding further goals (44).
Several studies have reported a decrease in physical performance in the second half of matches and explained that this is due to physical fatigue (8, 40). According to Mohr et al. (33), the time – motion analyses and performance measures during match-play, fatigue or reduced performance seem to occur at three different stages in the game: a) after short-term intense periods in both halves; b) in the initial phase of the second half; and c) towards the end of the game. Moreover, it has been observed that the amount of high-intensity running is reduced in the final 15 min of a top-class football match (32) and that jumping, sprinting, and intermittent exercise performance is lowered after versus before a football match (33).
Preparing for a team to last for 90 minutes does not reduce the need to be alert right from the kickoff. It is a terrible setback to concede a goal in the first minute and, of course, extreme boost for the scoring team. The results of the present study highlighted the significance of the first goal to the match outcome; it was shown that when a team scored first, it won 75.9% of the matches. In previous studies it was presented that teams which scored first went on to win 73.5% in 1994 World Cup tournament, 59.4% of the matches where there was a winner in 2002 World Cup (34) and 73.21% in 2002 World Cup 2006 (3).
Research on psychological momentum agrees with the present results. Moreover, it has shown that early success in a competition (e.g. scoring first) is a strong predictor of outcome in football (26, 37). Performance after the first goal is controlled by two responses: firstly how well the team which scores the first goal retains its advantage and secondly how well the team which concedes the first goal counters its disadvantage (35).
Thus when leading, it is important to keep pressing for more. In training, therefore, a coach should subject a team to a situation of playing while in the lead so the players develop the mental strength that is needed to sustain a lead. This can be done through simulated handicapped play, where a team starts a game knowing that they are either ahead by one or trailing by one or two goals. This will enable the coach to assess the reaction of the players in the different situations (35).
In relation to type of play, most goals scored after open play (72.4%) and almost 1/3 after set plays (27.6%). This coincides with the results of James, Mellalieu and Taylor (23), Lago and Martin (30) and Taylor, James and Mellalieu (48) who showed that about 25%-40% of all goals have been scored on set plays. Our findings provide further evidence for the importance of practicing set plays because of their potential productivity, despite their relatively low occurrence in comparison to open play opportunities. Concerning the style of play that was used to score a goal, the majority of goals were scored after positional attacks (60%) but significant percentage was scored after counter attack (20%) and direct play (20%).
In a recent study, that examined the goal scoring patterns in Euro 2004 presented similar results (positional attacks: 44.1%, counter attacks: 20.3%, set plays: 35.6%) (51). Also, according to Dufour (14) 88% of the goals in the World Cup Tournament in 1990 came from an organized offense and 12% from a counter-attack. A more recent study (4) found that despite the fact that frequency of counter-attacks in modern football is low (4.9%), they are considered to be more effective than organized offense moves; the following percentages are indicative and support such a proposition: 16.9% of counter-attacks lead to a goal whereas only 11.1% of positional attacks are successful.
Concerning the set play’s effectiveness, the data collected in present study are similar to those found by other authors and allow us to assert that corner kick (47.6%) and free kick (33.3%) are the plays that are performed on set pieces which result in the highest number of goals. Thus, free kicks and corner kicks have been shown to be the greatest source of goals, producing 46% and 13% of goals respectively at the 1994 World Cup (46) and 50% and 47.6% at the 1998 competition (15) and 33.3% and 26.7% at the 2006 competition (5).
Regarding the initiation zone of the attack, it was presented that most goals began from the attacking half while no differences were found between right and left zone. Jankovic and his colleagues (24) studied Euro 2008 and presented that 28.8%, 38.3% and 31.2% of goals initiated from the defensive third, middle third and attacking third respectively. Moreover, recent studies presented that in the 5 minutes before a goal was scored, the scoring team had significantly more possession in the middle and attacking thirds compared to the half average (41, 45). The authors suggested a definite shift and territorial advantage for the team about to score in the 5 minutes leading to the goal.
Some studies (9, 42) showed that goals occur when teams played with direct method. Particularly, Reep, and Benjamin (42) found that approximately 80% of goals resulted from a sequence of three passes or less. Moreover, Hook and Hughes (17) found that successful teams utilized longer possessions than unsuccessful teams in Euro 2000, although no significant differences were found in the number of passes used in attacks leading to a goal. These authors suggested that keeping the ball for longer durations was indicative of success. However, in a similar study, Stanhope (47) found that time in possession of the ball was not indicative of success in the 1994 World Cup. Jones, et al. (27) showed that successful teams in the English Premier league typically had longer possessions than unsuccessful teams, irrespective of the match status (evolving score). The results of the present study indicated that most goals (61.84%) resulted from a sequence of four passes or less; however 20% of goals resulted from a passing sequence of eight or more. Consequently, with the evolution of football, other styles of play have emerged, with more sequence of passes before the shot, i.e., teams try to find the best moment to attack with efficacy, maintaining the ball and the control of the game, waiting for the mistake or equilibrium break of the opponent (13). Therefore, there is probably not a principle that determines that ball possessions with few or many passes provide more or less shots to goal, once both ways can create kicks or headers conditions, depending on the match situations.
As proposed from previous resources (3, 50, 51), our findings showed that most goals were scored when the type of feed was from a cross (43.7%). Griffiths (16) found that France, who was at that time considered the best international team in the World, created significantly more crosses than their opponents, while Lago et al. (29) proposed that crosses is one of the variables that better differentiate winning, losing and drawing teams in a global way. Theis (49) supported that wing offensive play with long passes is a primary offensive tactic in order to face defending deep. Often, defenders used to commit errors in such cases because they observe the player that has the possession of the ball and not the unmarked players. Therefore, training should focus on improving long passes inside penalty area, preparing players to have the ability to score goals after an air ball but also defend better it such situations (3).
The results of the present study supported previous findings that more than 90% of goals were scored from within the penalty area. The current value is similar to the 90% observed by Olsen (36) for the 1986 World Cup, 87% by Wright and his colleagues (50) for English Premier League and 83.4% by Armatas and Yiannakos (3) for the 2006 World Cup. Moreover, it was presented that there seems to be an ‘effective’ area inside the penalty from which 42.1% goals scored. Hughes and Franks (20) have previously identified the key objective of getting the ball into a ‘prime target area’, which was defined as the area that consists of the length of the six-yard box and is from the penalty spot to within two yards inside the six-yard box. Hughes (18) stated that about four goals in every five scored from crosses are hit from this area, while Carling et al. (12) found that 37% were scored from the same area in the 2002 World Cup. The increased rate of recurrence of offensive actions and effectiveness inside the penalty area is justified by the fact that this area is nearer to goalpost and outside of the goalkeeper’s reaches (31). Thus, training should be focused on drills that contain shots inside the penalty area under match conditions but also on defensive response from defenders and goalkeeper.
With relation to the goal scorer, we found that 41.3% and 29.3% of goals were scored by strikers and wingers respectively. In a recent study, Acar and his colleagues (2) concluded that forward players scored 57% of goals in the 2006 World Cup while Mitrotasios and colleagues (31) studied Greek SuperLeague and concluded that strikers scored 47.7% of goals. In the present study, strikers and wingers were discriminated because of the massive usage of the wings due to systems of play with winger players (1-4-2-3-1 and 1-4-3-3). Moreover, in most cases the player scored the goal with one touch (63.7%) and almost ½ of the goals were scored without any pressure from defenders, however the above results could not be comparable because of the lack in literature.

CONCLUSIONS
The main objective of this study was to analyze the performance parameters of the most successful teams in Europe which competed in the final tournament of the European Championship in 2012, in order to give clues for specific tactical issues and training guidelines that coaches and competitive players need to carry out to be successful. The results demonstrate that top European teams score 1/4 of goals after set plays, initiate attacks from offensive half and there is not a principle that determines that ball possessions with few or many passes provide more goals. Moreover, there seems to be a critical zone inside the penalty area from which most goals are scored, crosses identified as a relevant factor for team goals and almost ½ of the goals were scored without any pressure from defenders.

APPLICATIONS IN SPORT
The present study presented values that can be used as normative data to design and evaluate practices and matches for football performance in a collective way. Likewise, it will allow coaches to design training exercises similar to the actual competition and adapt the game style with regard to match status. Moreover, coaches can use this information to establish objectives for players and teams. These objectives can be oriented in a positive way (things or number of things to try to achieve) or in a negative way (things or number of things to try to avoid) with a special reference to the offensive or defensive play.
The limitation of the present study is that it is based on one specific championship (2012 European football championship). The need for constant record and evaluation of football characteristics is prevalent, since it presents continuous evolvement; thus further research concerning goal analysis should include different competitions that involve other contextual factors (game location in a balanced schedule, continental differences, match status, etc.).

REFERENCES
1. Abt, G.A., Dickson, G., & Mummery, W.K. (2002). Goal scoring patterns over the course of a match: An analysis of the Australian National Soccer League. In W. Spinks, T. Reilly, & A. Murphy (Eds.), Science & Football IV (pp. 107-111). London: Routledge.
2. Acar, M., Yapicioglu B., Arikan, N., Yalcin, S., Ates, N., & Ergun M. (2009). Analysis of goals scored in 2006 World Cup. In T. Reilly, & F. Korkusuz (Eds.), Science & football VI (pp. 235-242). Oxon: Routledge.
3. Armatas, V., & Yiannakos, A. (2010). Analysis and evaluation of goals scored in 2006 World Cup. Journal of Sport & Health Research, 2, 119-128.
4. Armatas, V., Yiannakos, A., Ampatis, D., & Sileloglou, P. (2005). Analysis of the successful counter-attacks in high-standard soccer games. Inquiries in Sport & Physical Education, 3, 187-195.
5. Armatas, V., Yiannakos, A., Papadopoulou, S., & Galazoulas, Ch. (2007). Analysis of set plays in the 18th World Cup in Germany. Physical Training, October 2007.
6. Armatas, V., Yiannakos, A., & Sileloglou, P. (2007). Relationship between time and goal scoring in soccer games: Analysis of three World Cups. International Journal of Performance Analysis in Sport, 7, 48-58.
7. Bangsbo, J., & Peitersen, B. (2000). Soccer systems and strategies. Champaign, IL: Human Kinetics.
8. Barros, R., Misutal, M., Menezes, R., Figueroa, P.J., Moura F.A., Cunha, S.A., Anido, R., & Leite, N. (2007). Analysis of the distances covered by first division Brazilian soccer players obtained with an automatic tracking method. Journal of Sports Science & Medicine, 6, 233-242.
9. Bate, R. (1988). Football chance: Tactics and strategy. In T. Reilly, A. Lees, K. Davids, & W.J. Murphy (Eds.), Science & Football (pp. 293-301). London: E. & F.Spon.
10. Carling C. (2010). Analysis of physical activity profiles when running with the ball in a professional soccer team. Journal of Sports Sciences, 28, 319-26.
11. Carling, C., Reilly, T., & Williams, A. (2009). Performance assessment for field sports. London: Routledge.
12. Carling, C., Williams, A., & Reilly, T. (2005). The handbook of soccer match analysis. London: Routledge.
13. Clemente, F., Couceiro, M., Martins, F., & Mendes, R. (2012). Team’s performance on FIFA U17 World Cup 2011, Study based on notational analysis. Journal of Physical Education & Sport, 12, 13-17.
14. Dufour, W. (1993). Computer-assisted scouting in soccer. In T. Reilly, J. Clarys, & A. Stibbe (Eds.), Science & Football II (pp. 160-166). London: E. & F. Spon.
15. Grant, A.G., Williams, A.M., & Reilly, T. (1999). Analysis of the goals scored in the 1998 World Cup. Journal of Sports Sciences, 17, 826-827.
16. Griffiths, D.W. (1999). An analysis of France and their opponents at the 1998 soccer World Cup with specific reference to playing patterns (Unpublished master’s thesis). University of Wales Institute, Cardiff, Wales.
17. Hook, C., & Hughes, M. (2001). Patterns of play leading to shots in Euro 2000. In M. Hughes, & I. Franks (Eds.), Performance analysis of sport V (pp. 295-302). Cardiff: UWIC.
18. Hughes, M. (1996). Notational Analysis. In T. Reilly (Ed.) Science & Soccer (pp.343-362). London: E. & F. Spon.
19. Hughes, M., & Bartlett, R. (2002). The use of performance indicators in performance analysis. Journal of Sports Sciences, 20, 739-754.
20. Hughes, M., & Franks, I. M. (2004). Notational analysis – a review of the literature. In M. Hughes, & I. Franks (Eds.), Notational analysis of sport: Systems for better coaching and performance in sport (pp. 99-107). Abingdon: Routledge.
21. Hughes, M., & Franks, I. (2005). Analysis of passing sequences, shots and goals in soccer. Journal of Sports Sciences, 23, 509‐514.
22. Hughes, M., Robertson, K., & Nicholson, A. (1988). Comparison of patterns of play of successful and unsuccessful team. In T. Reilly, A. Lees, K. Davids, & W. Murphy (Eds.), Science & Football (pp. 373-376). London: E. & F. Spon.
23. James, N., Mellalieu, S., & Taylor, J. (2004). Notational analysis of corner kicks in English premier league soccer. In T. Reilly, D. Araujo, & J. Cabri (Eds.), Science & football V (pp. 225-230). London: E. & F. Spon.
24. Jankovic, A., Leontievic, B., & Pasic, M. (2009). Analysis of efficient attacks in the 2008 European football championship. Physical Culture, 37, 180-184.
25. Jinshan, X., Xiakone, C., Yamanaka, K., & Matsumoto, M. (1993). Analysis of the goals in the 14th World Cup. In T. Reilly, J. Clarys, & A. Stibbe (Eds.), Science & Football II (pp. 203-205). London: E. & F. Spon.
26. Jones, M., & Harwood, C. (2008). Psychological momentum within competitive soccer: Players’ perspectives. Journal of Applied Sport Psychology, 20, 57-72.
27. Jones, P., James, N., & Mellalieu, S. (2004) Possession as a performance indicator in soccer. International Journal of Performance Analysis in Sport, 4, 98-102.
28. Kirkendall, D., Dowd, W., & DiCicco, A. (2002). Patterns of successful attacks: a comparison of the men’s and women’s World Cup. Revista de Fútbol y Ciencia, 1, 29-36.
29. Lago, C., Lago, J., Dellal, A., & Gomez, M. (2010). Game-related statistics that discriminated winning, drawing and losing teams from the Spanish soccer league. Journal of Sports Science & Medicine, 9, 288-293.
30. Lago, C., & Martin, R. (2007). Determinants of possession of the ball in soccer. Journal of Sports Sciences, 25, 969-974.
31. Mitrotasios, M., Sentelidis, T., & Sotiropoulos, A. (2006). The systematic observation and analysis of the scored goals in soccer as a base to coaching in the training and the match. Hellenic Journal of Physical Education and Sport Science, 60, 58-74.
32. Mohr, M., Krustrup, P., & Bangsbo, J. (2003). Match performance of high-standard soccer players with special reference to development of fatigue. Journal of Sports Sciences, 21, 519-528.
33. Mohr, M., Krustrup, P., & Bangsbo, J. (2005). Fatigue in soccer: a brief review. Journal of Sports Sciences, 23, 593-599.
34. Njororai, W. (2004). Analysis of the goals scored at the 17th World Cup Soccer Tournament in South Korea- Japan 2002. African Journal for Physical, Health Education, Recreation & Dance, 10, 326-332.
35. Njororai W. (2007). Scoring goals. What the coach should know about the timing. Soccer Journal, 11/12: 34-36.
36. Olsen, E. (1988). An analysis of goal scoring strategies in the World Championships in Mexico. In T. Reilly, A. Lees, K. Davids, & W. Murphy (Eds.), Science & Football (pp. 373-376). London: E. & F. Spon.
37. Olsen, E., & Larsen, O. (1997). Use of match analysis by coaches. In T. Reilly, J. Bangsbo, & M. Hughes (Eds.), Science & football III (pp. 209-220). London: E. & F. Spon.
38. Palomino, F., Rigotti, L., & Rustichini A. (2000). Skill, strategy and passion: an empirical analysis of soccer. mimeo, Tilburg University. Retrieved from: http://www.pitt.edu/~luca/Papers/soccer.pdf
39. Pratas, J., Volossovitch, A., & Ferreira, A.P. (2012). The effect of situational variables on teams’ performance in offensive sequences ending in a shot on goal. A Case Study. The Open Sports Sciences Journal, 5, 193-199.
40. Rampinini, E., Bishop, D., Marcora, S.M., Ferrari Bravo, D., Sassi, R., & Impellizzeri, F.M. (2007). Validity of simple field tests as indicators of match-related physical performance in top-level professional soccer players. International Journal of Sports Medicine, 28, 228-235.
41. Redwood-Brown, A. (2008). Passing patterns before and after goal scoring in FA Premier League soccer. International Journal of Performance Analysis in Sport, 8, 172-182.
42. Reep, C., & Benjamin, B. (1968). Skill and chance in association Football. Journal of the Royal Statistical Society, 131, 581-585.
43. Reilly, T. (1996). Motion analysis and physiological demands. In T. Reilly, J. Bangsbo, & M. Hughes (Eds.), Science & football III (pp. 65-81). London: E. & F. Spon.
44. Reilly, T. (1997). Energetics of high intensity exercise (soccer) with particular reference to fatigue. Journal of Sports Sciences, 15, 257-263.
45. Ridgewell, A. (2011). Passing patterns before and after scoring in the 2010 FIFA World Cup. International Journal of Performance Analysis in Sport, 11, 562-574.
46. Sousa, T., & Gargantua, J. (2001). The importance of set-plays in soccer. In M. Hughes, & F. Tavares (Eds.), Proceedings of the IV World Congress of Notational Analysis of Sport, 22-25 September 1998 (pp.53-57).Faculty of Sport Sciences & Physical Education, University of Porto, Portugal.
47. Stanhope, J. (2001). An investigation into possession with respect to time, in the soccer World Cup 1994. In M. Hughes (Ed.), Notational Analysis of Sport III (pp. 155-162). Cardiff: UWIC.
48. Taylor, J., James, N., & Mellalieu, S. (2004). Notational analysis of corner kicks in English premier league soccer. Journal of Sports Sciences, 22, 518-519.
49. Theis, R. (2001). Torchancenerarbeitung im Spitzenfußball. In Lange, P. (Ed.), Leistungsdiagnostik und Coaching im Fußball (pp. 59-67). Hamburg: Czwalina.
50. Wright, C., Atkins, S., Polman, R., Jones, B., & Lee S. (2011). Factors associated with goals and goal scoring opportunities in professional soccer. International Journal of Performance Analysis in Sport, 11, 438-449.
51. Yiannakos, A., & Armatas, V. (2006). Evaluation of the goal scoring patterns in European championship in Portugal 2004. International Journal of Performance Analysis in Sport, 6, 178-188.

2014-01-21T11:30:21-06:00January 16th, 2014|Contemporary Sports Issues|Comments Off on Analysis of Goal Scoring Patterns in the 2012 European Football Championship
Go to Top