An Examination of the Moneyball Theory: A Baseball Statistical Analysis

Submitted by: Ehren Wassermann, Daniel R. Czech, Matthew J. Wilson & A Barry Joyner

INTRODUCTION

Money is a very important aspect in almost every professional sport. In professional baseball, there are large (New York Yankees) and small (Oakland Athletics) market organizations that make important decisions based on their economic status. For example, many smaller city market teams, must spend their money wisely to ensure the best outcome; whereas, a larger city market team has more income that is expendable (Lewis, 2003). This money spending process originates during the Major League Baseball player draft held each June. The draft process involves fifty rounds of selections by all thirty teams. Each team gathers their general managers, scouts, and professional consultants to decide which players should be drafted. The higher the draftee the more valuable he is believed to the team. Therefore, the procedure to decide which players should be selected earliest is very important (Lewis, 2003). According to Lewis (2003) there are two main theories that are being used to narrow the selection process.

The first theory is generally considered the “old” scouting theory. Scouts venture out and evaluate players all over the country. They do not pay particular attention to statistics, but rather base decisions on the five tools: speed, quickness, arm strength, hitting ability and mental toughness (Lewis, 2003). Each scout goes through “scout school” and is given a pamphlet on what should be looked for in certain aspects of baseball, such as arm strength, fielding, running, and the most important hitting. For arm, strength evaluation, scouts are instructed to look for players exhibiting a “fluid arm action and easy release” (Major League Baseball, 2001 p. 10). Furthermore arm strength evaluation is conducted with the assistance of a radar gun. In the fielding category, “a strong arm and defensive skills can and do carry a player to the major leagues” (MLB, 2001 p. 10). Also, “a live, active lower body, quick feet, agility, instinct, . . . alertness, are some of the qualities that go into the rankings of a major league infielder” (MLB, 2001 p. 10). Running is commonly judged through a timed 60 yard sprint (Baechle & Earle, 2003). Hitting is the “most difficult of all scouting categories of judgment” (MLB, 2001 p. 11). A general list of guidelines that scouts look for is: (1). Strength, (2). Starting the bat, generating bat speed, (3). Full arm extension and follow through after making contact, (4). Head stays on ball, (5). Lack of fear, butt stays up at plate, (6). Short stride, (7). Top hand is evident upon making contact and follow through, (8). Head of bat does not lag, (9). Aggressive, hits first good pitch, (10). Short strokes, yet ball jumps off bat, (11). Bat goes to ball (Not a swing through a certain arc area and the ball happens to be in that zone) (MLB, 2001 p. 11). Scouts are instructed not to scout performance but to “watch for things that are done mechanically that will eventually bring results and success” (MLB, 2001 p. 13). When a scout sees a player he then gives the player a certain grade. “The evaluated grade of five (5) in any respective category portrays the player as having, or will have, an average skill of major league standards, currently or once he reaches major league competition” (MLB, 2001 p. 14)

The second theory is based on the Oakland A’s general manager Billy Beane and is illustrated in a novel by Micheal Lewis entitled Moneyball. The Moneyball theory places no emphasis on the body of the athlete or the physical tools that the athlete possess’ (Lewis, 2003). This theory illustrates the simplicity of baseball by asking two questions: Does this player get on base? and Can he hit? According to Lewis (2003), Billy Beane (the inspiration of Moneyball) decided to base his drafting of position players/hitters on certain statistics. His main two statistics included on-base percentage (OBP) and slugging percentage. These two stats combined to form a new statistic called on-base plus slugging (OPS). Another differing aspect in Beane’s approach was his lack of emphasis on power (Lewis, 2003). Therefore, Beane believed that power could be developed, but patience at the plate and the ability to get on base could not. Moreover, Beane believed in the notion to select college players who are experienced on a different level than the high school “phenom” who needs to be developed into a player. Beane’s theory was created based on the works of a sabermetrician named Bill James. “Sabermetrics is the mathematical and statistical analysis of baseball records” (James, 1982 p. 3). James spent years trying to decipher numbers via the Bill James Baseball Abstract, which in turn, resulted in a specific philosophy on hitters.

James’ idea on hitters differs from the draft process of Billy Beane, but Beane adopted his views from James’ ideology. When putting together a lineup, managers must decide the best order in which the team has the best chance of winning. To win the game one must score more runs than the opposing team. This thought provokes the question as to why such great importance is placed on batting averages? “People are in the habit of listing their teams offensive statistics according to batting averages rather than in order of runs scored” (James, 1984 p.10). James believes that “a hitter’s job is not to compile a high batting average, maintain a high on-base percentage, create a high slugging percentage, get 200 hits, or hit home runs” (James, 2001 p. 329). However, part of a hitter’s job from a coach’s perspective, is to hit homeruns, singles, doubles, get on base, drive in runs, and steal bases (James, 2001). James believes the job of a hitter is to create runs. “The essential measure of a hitter’s success is how many runs he has created” (James, 2001 p. 330). James then developed a formula that allows one to establish created runs:

(Hits + Walks) x Total Bases
At-bats + Walks

This formula works 90 % of the time and gives a total of the team’s actual scored runs within 5 % (James, 2001). From this philosophy, Beane developed his theory. The only way to score runs is to get on base and since walks are such a vital part of the created runs formula, on-base percentage should be closely monitored. Even though this formula is very accurate, additional steps can be taken to improve the accuracy. This new formula accounts for the more minute aspects of meaningful baseball statistics. It works off the simple formula:
(A x B)/ C
The A variable adjusts the “on-base” aspect of baseball.

A = hits + walks + hit batsmen – caught stealing – ground into double play (H + W + HBP – CS – GIDP)
The B variable takes into account the advancement of the player.
B = total bases plus .26 times hit batsmen and non-intentional walks, plus .52 times stolen bases, sacrifice hits, and flies (TB + .26(TBB – IBB + HBP) + .52(SB + SH + SF)

The C variable accounts for opportunity.

C = at-bats + total walks + sacrifice hits and flies + hit batsmen (AB + TBB + SF + HBP) (James, 1984 p. 14)

James believed that “figuring the number of runs created is a great tool to evaluate hitters since a hitter’s job is to create runs” (James, 1983 p. 5). Therefore, Beane also placed a major emphasis on what had to be done to create runs and drafted players accordingly.

The difference between these two theories leads to the following questions, what are the optimal attributes of the ideal draft pick? Are young high school prospects with the ideal 5 physical tools more advantageous to draft than the seasoned college player with high offensive Moneyball statistics?

The purpose of this investigation was to answer the question of whether there is a significant difference in on base percentage, slugging percentage and on base + slugging percentage (OPS) between high school and college drafted position players performing at the professional level? It is hypothesized that because of more experience, more rich statistical data, and better competition at the college level, the college baseball players will have better offensive Moneyball statistics than the high school players.

METHODS

Participants

The participants in this study were 60 professional baseball players. More specifically, thirty high school and thirty college players from the 1997 major league professional amateur draft were selected for participation in this study. The age range of the participants was 18 to 23 years of age. The mean age of the high school players was x=18.3 and the mean age of the college players is x=20.9. The mean age for the entire participant sample is 19.6 years of age.

Procedure

A comprehensive internet search was conducted to locate the high school and college players from the 1997 amateur draft. The authors felt that four years was enough time to examine a drafted player’s moneyball statistics, as four years is the time when many players move to their highest level of play. By use of the following website (www.sports-wired.com), draft information i.e. the top thirty drafted position players from high school and college Moneyball statistics were obtained. Each player’s professional (Major and Minor League) Moneyball statistics (slugging percentage, on-base percentage, and on-base plus slugging) from their rookie year to their 4th year of playing professionally were utilized. Slugging percentage was calculated as (Total Bases divided by At Bats). On base Percentage was calculated as (Hits + Base on Ball + Hit By Pitch) divided by (At Bats + Base on Balls + Hit by Pitch + Sacrifice Flies)

Results

Descriptive statistics included the means and standard deviation ranges overall and as a function of both major league and minor league slugging percentage, on base percentage, and OPS. A score was calculated, comparing college and high school players, for each variable using the SPSS 12.0 statistical package. An independent samples T-test was utilized to compare differences between collegiate and high school players. An alpha level of .05 was used for all statistical tests.

The mean and standard deviation for the college and high school player’s performances in the major and minor leagues is illustrated in Table 1. An independent T-test revealed a significant difference between college and high school minor league slugging percentage. No significant differences were found when comparing college and high school on base percentage and OPS.

DISCUSSION

The purpose of this study was to compare the top collegiate and high school drafted baseball player’s professional offensive Moneyball statistics- slugging percentage, on base percentage, and on base plus slugging (OPS) over a four year period. It was hypothesized that college drafted players would have significantly higher Moneyball related offensive statistics than the high school players. The results did not support the hypothesis in that the only significant difference was between college and high school minor league slugging percentage. These results may contradict some of Beane’s Moneyball theory (Lewis, 2003).

Beane postulated in Lewis’ (2003) that college players would perform better than high school players. This hypothesis is due to several factors. First, college players are more mature physically, mentally, and emotionally than high school players. This maturity would enable them to handle the stresses that are involved in minor league baseball such as, long bus rides, the occasional slump, and unfamiliarity with surroundings. Secondly, college players play against stronger and more advanced competition more often than high school players. This allows for more experience which may provide a better preparation for professional play. Finally, college players play a longer schedule and usually practice year round. This consistent playing allows for skills to be refined and mastered. Using these facts, Beane decided that college players are a better investment than high school players (Lewis, 2003).

The results may not have supported the hypothesis because both groups of athletes had to make adjustments to professional baseball. The high school players may adapt more easily to new changes because they are younger and may have had less influence from other less experienced coaches; however, college players may have developed a certain approach to hitting from college that contradicts a new approach at the professional level. Therefore, the college players may take a longer time to alter their approach to hitting and thus hindering their productivity at the plate. Another factor may be due to the notion that high school players are usually placed in lower levels of professional baseball than college players, which in turn may even the offensive statistics. Lastly, college baseball players may have the opportunity to gain more experience with the wooden bat when competing in collegiate summer leagues.

The rest of baseball has seemed to take notice of the Billy Beane philosophy of drafting. In the 2003 First-Year Player Draft, more than 70 % of the players drafted through the first twenty rounds were from a four-year college or a junior college (Mayo/MLB.com, 2003). This percentage was “a marked increase compared to the last three years” (Mayo/MLB.com, 2003, p.1). Even though this significant increase in drafting college players seems to be the trend, “there [has been] little statistical data to support doing that” (Newman/MLB.com, 2003, p. 2). Baseball America researched the 1990s draft and announced that 2,115 players signed in the first ten rounds between 1990-97 (Newman/MLB.com, 2003). “The group includes 1,024 collegians, 398 of whom (38.9 %) reached the Majors” and “920 prepsters, 259 (28.2 %) did the same” (Newman/Mlb.com, 2003, p 2-3). It was noted that most of the differences amounts to only limited time in “The Show”. However, “further research noted that 90 college players (8.8 %) and 77 high school players (8.4 %) became Major League regulars for at least a few seasons” (Newman/MLB.com, 2003, p. 3). These last numbers correlate with the findings of this study illustrating little difference between the productivity of college players versus high school players.

It is important to note that there were limitations to this study. For example, one relevant limitation was the number of participants used in the study. A more significant result could have been established utilizing the entire draft. With more participants and more statistical data, a better idea of the purpose could have been allocated. Another limitation that needs to be noted is the speed at which certain players are promoted. Some high draft picks (top ten rounds) are quickly promoted to a higher level, regardless of their success at the current level. This is due to the amount of money invested in the athlete. For example, a fourth round shortstop may get a signing bonus of 450,000 dollars while the 38th round shortstop may only get 1,000 dollars.

Consequently, the organization has a tremendous amount of money invested in the fourth rounder and they need him to develop faster (Lewis, 2003). Hence, even though this player may not be physically and mentally ready, the organization wants to see a quick return on its investment. Finally, a major limitation is the amount of playing the athlete does. Each year when the regular season ends, many players face the decision of playing winter ball (Lewis, 2003). Many believe that rest is needed to help the body recover from a long, strenuous season; however, others believe that winter ball allows them to gain an extra advantage over their competition. No matter the limitations there is significant evidence against the Billy Beane philosophy.

What this study attempted to illustrate was how an organization with a low budget produces quality baseball players using a new philosophy unorthodox to the norm of baseball (Lewis, 2003). From a financial standpoint, the authors believe there are two mindsets regarding the lack of significance. Because of the minimal significant differences between college and high school players’ “moneyball” statistics, many MLB teams might want to disregard the notion that cheaper “moneyball” college drafted players are better investments because they do not do as well as their high school drafted counterparts. However, even though the comparison is not significant statistically, the statistics may be significant to an organization/coach, which is playing the Moneyball way of baseball. A small market organization may want to pay less for college players who average .432 (slugging percentage), .344 (on base percentage) and .776 (OPS) than pay more for high school players who average .396 (slugging percentage), .332 (on base percentage), .728 (OPS) over a four year time period. Even though slugging percentage is the only significant difference, the college players have better statistics from a baseball playing perspective. This difference may be the rationale as to draft cheaper players based on the Moneyball statistics and play the Moneyball way of baseball, especially for small market teams. More research, both qualitative and quantitative needs to be completed before making a conclusion regarding the Moneyball way of drafting and playing professional baseball. If the Moneyball method is proven as significant, it could revolutionize the baseball industry. The importance of this theory is not only relevant monetarily, but it could institute a new theory to the selection of baseball players. Future research should examine if other organizations are using Beane’s philosophy and if they are how this will affect the Oakland organization. Moreover, future research should analyze OPS and Runs Created.

REFERENCES

1. Baechle, T.R., & Earle, R.W. (2000). Essentials of Strength Training and
Conditioning. Human Kinetics: Champaign, Il.
2. James, B. (1982). The Bill James Baseball Abstract 1982. New York: Ballantine
Books.
3. James, B. (1983). The Bill James Baseball Abstract 1983. New York: Ballantine
Books.
4. James, B. (1984). The Bill James Baseball Abstract 1984. New York: Ballantine
Books.
5. James, B. (2001). The New Bill James Historical Baseball Abstract. New York:
The Free Press.
6. Lewis, M. (2003). Moneyball: The Art of Winning the Unfair Game. New York:
W.W. Norton and Company.
7. Major League Baseball. (2001). Major League Baseball Scouting Pamphlet.
8. Mayo, J. (2003). A Strong Lean Toward Collegians: Trend Away from High
Schoolers Continues in Draft. November 24, 2003, http://mlb.mlb.com/NASApp/mlb/mlb/news/mlb_news.jsp?ymd=20030603&content_id=353523&vkey=draft2003&fext=.jsp&c_id=mlb.
9. Mayo, J. (2003). High School Players Fall in Draft. November 24, 2003,
http://mlb.mlb.com/NASApp/mlb/mlb/news/mlb_news.jsp?ymd=20030604&content_id=355074&vkey=draft2003&fext=.jsp.
10. Newman, M. (2003). High School vs. College: Does Either Provide a Better
Shot at a “Sure Thing?”. November 24, 2003,
http://mlb.mlb.com/NASApp/mlb/mlb/news/mlb_news.jsp?ymd=20030520&content_id=328934&vkey=news_mlb&fext=.jsp&c_id=mlb

2015-03-20T10:41:26-05:00January 2nd, 2005|Contemporary Sports Issues, Sports Coaching, Sports Exercise Science, Sports Management, Sports Studies and Sports Psychology|Comments Off on An Examination of the Moneyball Theory: A Baseball Statistical Analysis

Evaluation of Motivation in Patients with Coronary Heart Disease Who Participate in Different Rehabilitation Programs

ABSTRACT

The purpose of this study was to evaluate “motivation in patients
with coronary heart disease, who participated in different rehabilitation
programs and those who did not participate.” Fifty-one (n=51) male patients
suffering from coronary heart disease participated in the present study.
Fifteen participated in a rehabilitation program in a gym; eighteen participated
in a swimming program and eighteen consisted of the control group. The
mean age of the participants was 60.83 (SD=±3.3). Participants completed
the Sport Motivation Scale (SMS). According to the results, patients who
participated in the gym program had statistically higher levels in IM
to knowledge, to stimulation, to accomplishment and EM to interjected
regulation. On the contrary, the control group had statistically higher
levels in EM to external regulation and motivation.

INTRODUCTION

Atherosclerotic cardiovascular diseases are the major cause of death
in middle-aged and older-adults in Europe and United States (BC Ministry
of Health and Ministry Responsible for Seniors, 1996; Giannuzzi et al.,
2003; Sarafino, 1990).

Cardiac Rehabilitation programs were first developed in the 1960s when
the benefits of ambulation during prolonged hospitalization for coronary
events had been documented. Exercise was the primary component of these
programs (Giannuzzi et al., 2003). Over the past 4 decades, numerous scientific
reports have examined the relationships between physical activity, physical
fitness and cardiovascular health (Cerubini, Lowenthal, Williams &
Aging Clinical and Experimental Research, 1997; Fletcher, Balady &
Amsterdam, 2001; Oldridge, et al., 1993; Pate et al., 1995). Randomized
clinical trials of exercise training showed improvement in coronary risk
factors such as blood pressure, body composition, fitness, lipid and lipoprotein
profiles (Dunn et al., 1997; European Hear Failure Training Group, 1998;
EUROASPIRE II Study Group, 2001; Myers, 2003; Rockhill, Willet & Manson,
2001). Swimming and exercise in a gym are included in the so-called coronary
sport groups; as endurance sports with training effects suitable for rehabilitation
(Lins et al., 2003).

Although exercise is considered to be the easiest type of rehabilitation
for patients with coronary heart disease (CHD), their maintenance into
exercise programs is difficult most of the times (Harlan et al., 1995).
Reported rates of uptake of cardiac rehabilitation range from 15% to 59%
(Gattiker, Goins & Dennis, 1992; Pell, Pell & Morrison, 1996).
Approximately 20-25% of patients dropout of exercise programs within the
first three months and about 40-50% within 6 to 12 months (Song et al.,
2000; Oldridge, 1998; Oldridge, 1982).

Psychosocial variables that were found to influence the entrance and
completion of a CR program include motivation, mood states, and social
support (Myers, 2003). Motivation consistently has been shown to be a
strong indicator of initiation and maintenance of participation in a CR
program. It was found that the people that seem to have lower levels of
motivation perceive more barriers or problems associated with their exercise
programs. (Dishman & Ickes, 1981; Evenson & Fleury, 2000). The
literature on physical rehabilitation frequently refers to patient motivation
in explaining differences in outcome among patient groups with similar
pathologies (King, Taylor & Haskel, 1993; Maclean, & Pound, 2000).
Several studies have lent empirical support to the hypothesis that patient
motivation is a determinant of rehabilitation outcome (Clark & Smith,
1997; King & Barrowclough, 1989; Oldridge & Stoedefalke, 1984;
Wolf, 1969).

In general, motivation expresses the needs and the wishes that regulate
the direction, the intensity and the continuation of a specific behavior
(Deci & Ryan, 1985). Deci and Ryan (1985) explained intrinsic and
extrinsic motivators and their influence on self-determination in their
theory of self-determination. Self-determination is a quality of human
functioning that involves the experience of a choice. An important distinction
concerning motivation in exercise and sports is the one between intrinsic
and extrinsic motivated behavior for participation (Ryan et al., 1984).
Intrinsic motivation (IM) refers to an individual who participates in
an activity simply for the satisfaction of doing so (Fortier, et al.,
1995). Intrinsic motivation has been postulated to have three separate
categories: IM to know, to accomplish things and to stimulation (Vallerand
& Losier, 1999; Vallerand, et al., 1989; Vallerand &Bissonnette,
1992).

Extrinsic Motivation (EM), on the other hand, is related to external
factors, such as rewards and punishment (Vallerand & Perrault, 1999;
Ryan & Deci, 2000). The three types of extrinsic motivation, from
the least self-determined to the most self-determined, are external regulation,
interjected regulation and identification (Ryan et al., 1990).

The third type of motivation, amotivation, is characterized by
the thought that actions have no control over outcomes (Deci & Ryan,
1985). In other words, amotivated individuals believe that forces out
of their control determine behaviors.

The specific purpose of this study was to examine the differences in
motivation between patients, who participated in different cardiac rehabilitation
programs and patients who did not participated.

METHOD

Sample

A sample of 51 male patients suffering from coronary heart disease was
selected and divided into 3 groups. Fifteen (n=15) participated in a rehabilitation
program in a gym, eighteen (n=18) participated in a swimming program and
eighteen (n=18) patients consisted of the control group. The participants
couldn’t choose the type of activity and all of them followed a
phase III cardiac rehabilitation program. The mean age of patients was
(mean±S.D. 60.83 ± 3.3).

Procedures

The sampling procedure required that the prospective subjects met the
following criteria: (1) having undergone cardiac-related procedures such
as coronary artery bypass graft surgery (CABG) or percutaneous transluminal
coronary angioplasty (PTCA); (2) able to participate in the cardiac rehabilitation
programs for more than 15 weeks (for the exercise groups) with an attendance
rate of more than 70%. Exclusion criteria were clinically unstable heart
failure, unstable arrhythmias and other exercise limiting concurrent condition
as skeletal or muscular disorders. All exercise patients followed the
routine 3 times per week for 45-90 minutes per session at an intensity
of 60-85% of the maximum heart rate (MHR).

The duration of the rehabilitation programs was 20 weeks. During the
20-week period, the type and intensity of exercise and heart rate and
blood pressure before, during and after exercise were recorded for all
subjects in the exercise groups. Exercise patients did not participate
in any other physical training.

Each training-session in the gym rehabilitation program consisted of
walking, cycling or running on an ergometer. It consisted of 10 minutes
warm–up, 10 minutes stretching and flexibility exercises, of 25
minutes endurance training with heart rate (HR) maintained on 60% – 85%
of the maximum heart rate (MHR) and 10 minutes cool–down.

The swimming exercise program included 10 minutes warm-up, 10 minutes
stretching and flexibility exercises in the pool, 12 minutes walking in
the pool with kickboards and barbell and 12 minutes running or walking
in the pool with alternative intensity in a distance of about 200-250m,
with heart rate (HR) maintained on 60% – 85% of the maximum heart rate
(MHR) and 10 minutes cool-down.

Permission to conduct the investigation was received from the local athletic
association and the individual coaches. Each participant took 10-15 minutes
to complete the questionnaire and responses to the instrument were kept
anonymous. The participants were advised to ask for help if confused about
either the instructions or the clarity of any particular item. No problems
were encountered in completing either of the inventories or understanding
the nature of the questions.

Questionnaire

Patients completed the Sport Motivation Scale (SMS) developed by Pelletier,
Fortier, Vallerand and Tuson (1995). The SMS consists of seven sub-scales
that measure the three types of motivation: intrinsic, extrinsic, and
amotivation. There are four items per sub-scale, thus there are a total
of 28 items being assessed. Each item represents a possible reason why
patients with coronary heart disease participated in an exercise rehabilitation
program. Subjects must rate the extent to which each item corresponds
to one of their participation motives on a seven-point Likert scale, ranging
from “not at all” (1) to “exactly” (7). The English
questionnaire is valid, consistent, and reliable. Pelletier et al. (1995)
found that the English translation of the questionnaire had a satisfactory
level of internal consistency. Additionally, correlations between the
subscales and confirmatory factor analysis have confirmed the determination
continuum and the construct validity of the scale (Pelletier, et al. 1995).

Statistical Analysis

The data was analyzed in two steps. First, internal consistency of subscales
was assessed using Cronbach alphas (Cronbach, 1951). Secondly, a one –way
MANOVA was used to determine if significant differences existed among
patients exercise groups and control group across the seven SMS subscales.
When the results of the one –way MANOVA were statistically significant,
Post hoc Scheffe analysis were conducted to determine which specific patient-group
means were significantly different from one another. The level of significance
was 0.5.

RESULTS

The internal consistency of the Sport Motivation subscales was determined
by calculating Cronbach’s Coefficient Alpha. The seven subscales
of SMS demonstrated acceptable internal reliability (IM to know =. 70,
IM to stimulation =. 80, IM to accomplishment =. 75, EM to external regulation
=. 69, EM to interjected regulation =. 66, EM to identified regulation
=. 75 and amotivation =. 70). These findings are supported by previous
study (Papageorgiou, 2001).

A one – way MANOVA indicated significant differences between the three
patients groups across the seven SMS subscale, Wilk’s Lambda=. 113,
(F7,14=9.892, P<0.05, eta squared=0.664).

Univariate ANOVA results indicated a significant difference only for
the six dependent variables. Statistically significant differences were
found for IM to know (F2,41=13.485, P<0.05, eta squared=0.397),
IM to stimulation (F2,41=43.581, P<0.05, eta squared=0.680),
IM to accomplishment (F2,41=6.581, P<0.05, eta squared=0,243),
EM to external regulation (F2,41=6.548, P<0.05, eta squared=0.242),
EM to interjected regulation (F2,41=22.913, P<0.05, eta
squared=0.528) and amotivation (F2,41=5.707, P<0.05, eta
squared=0.218). Scheffe post hock analysis indicated that patients who
participated in the gym rehabilitation program had statistically higher
levels in IM to know, to stimulation. to accomplishment and EM to interjected
regulation. Additionally, the control group had statistically higher levels
in EM to external regulation and Amotivation. Table 1 provides the means
and standard deviations for these dependent variables.

Table 1 Means and Standard Deviations of Motivation Variables by Group

Variables Gym Group Swimming Group Control Group
M±SD M±SD M±SD
IM to know 4.56±0.798 3.73±0.504 3.44±0.455
IM to stimulation 4.64±0.432 4.18±0.175 3.39±0.433
IM to accomplishment 4.41±0.701 3.75±0.365 3.98±0.358
EM to external regulation 4.10±0.991 3.76±0.240 4.5±0.342
EM to introjected regulation 3.79±0.729 3.46±0.311 2.69±0.286
Amotivation 1.47±0.588 1.63±0.208 2.0±0.450

DISCUSSION AND CONCLUSION

This study explored the influence of two specific types, frequency and
duration of exercise cardiac rehabilitation programs in-patient motivations.

Findings from this study indicated that patients who participated in
the gym rehabilitation program had statistically higher levels in IM to
know, to stimulation, to accomplishment and EM to interjected regulation,
than patients who participated in the swimming rehabilitation program
and patients who did not participate in any program (control group). One
of the possible reasons for the differences between the two exercise patient
groups may be due to the fact that swimming is not very much allowed for
cardiac patients, despite the valuable advantages as an overall physical
conditioning and leisure avocation (Kawahatsu et al., 1986). According
Ebbeck, Gibbons and Loken-Dahle (1995) the differences in reasons for
participating depend on the type of physical activity in which the individual
is involved.

Specifically, patients who participated in a gym program to fulfill intimacy
or acceptance needs were motivated intrinsically to participate in order
to gain knowledge, to experience stimulation and accomplishment (Stults,
2001). According to previous studies, personal satisfaction, knowledge
and pleasure (IM) constitute the main reasons of adult’s participation
in exercise programs (Ebeck et al., 1995; Eix, 2001; Brodkin & Weiss,
1990). These findings are consistent with the findings of previous studies
that suggest effects of the type of rehabilitation in-patients motivation
(Papageorgiou, 2001).

However, the gym exercise group differs significantly from the swimming
and control group in EM to introjected regulation. Introjection is related
to the internal pressures that the patient may put on himself. The guilt
that they feel when they fail to complete a health task or a training
session, will motivate them so as to make it up (Vlachopoulos, Karageorghis
& Terry, 2000). According to Brodkin & Weiss (1990) health reasons
were rated highest by older adults for participating in exercise programs.
Additionally control group had statistically higher levels in EM to external
regulation and Amotivation.

Given the study findings, further research is suggested. A research design
for assessing long-term adherence is recommended. Previous studies indicated
that the dropout rate for an exercise program remains high until 12 months,
with an average attrition rate of 50% (Comoss, 1988; Oldridge, 1979; Song
et al., 2001). It is imperative to assess adherence changes over a long-term
period, focusing on the motivation related variables influencing participation
in rehabilitation programs.

REFERENCES

  1. BC Ministry of Health and Ministry Responsible for Seniors (1996).
    Selected Vital Statistics and Health Status Indicators: Annual
    report 1995
    (Victoria: Division of Vital Statistics).
  2. Brodkin, P. & Weiss, M.R. (1990). Developmental differences in
    motivation for participation in competitive swimming. Journal of
    Sport and Exercise Psychology, 12
    , 248-263.
  3. Cerubini, A., Lowenthal, D.T., Williams, L.S. & Aging Clinical
    and Experimental Research (1997). Physical activity and cardiovascular
    health in the elderly,
    10, 13-25.
  4. Clark, MS. & Smith, DS. (1997). Abnormal illness behavior in rehabilitation
    from stroke. Clinical Rehabilitation, 11, 162-70.
  5. Commos, P.M. (1988). Nursing strategies to improve compliance with
    lifestyle changes in a cardiac rehabilitation population. Journal
    of Cardiovascular Nursing, 2
    , 3, 23-36.
  6. Cronbach, L.J. (1951). Coefficient alpha and the internal structure
    of tests. Psychometrika, 16, 297-334.
  7. Deci, E.L. & Ryan, R.M. (1985). Intrinsic motivation and self-determination
    in human behavior
    . New York: Plenum Press.
  8. Dickey, C. & Gavin, J. (2002). Behavioral counseling benefits
    older adults in cardiac rehabilitation programs. Medicine and Science
    in Sport and Exercise, 34,
    11, 1705-1713.
  9. Dishman, RK. & Ickes, W. (1981). Self-motivation and adherence
    to therapeutic exercise. Journal of Behavioral Medicine, 4(4)
    421–438
  10. Dunn, AL., Marcus, BH., Kampert, JB., Melisa, E., Garcia, M.P.H.,
    Kohl, H.W. & Blair, S.N. (1997). Reduction in cardiovascular disease
    risk factors: 6 – months results from project active. Preventive
    Medicine, 26
    , 883-892.
  11. Ebbeck, V., Gibbons, S.L. & Loken-Dahle, L.J. (1995). Reasons
    for adult’s participation in physical activity: an interactional
    approach. IInternational Journal of Sport and Exercise Psychology,
    26,
    262-275.
  12. Eix, T. (2001). Intrinsic and extrinsic motivation in sport: An
    analysis of gender differences
    . Unpublished Doctoral Dissertation,
    Department of Psychology, Carleton University.
  13. European Heart Failure Training Group. (1998). Experience from controlled
    trials of physical training in chronic heart failure. Protocol and patients
    factors in effectiveness in the improvement in exercise tolerance. European
    Heart Journal, 19
    , 466-475.
  14. EUROASPIRE II Study Group (2001). EUROASPIRE II. Lifestyle and risk
    factor management and use of drug therapies in coronary patients from
    15 countries. European Heart Journal, 22, 554-572.
  15. Evenson, KR. & Fleury, J. (2000). Barriers to outpatient cardiac
    rehabilitation participation and adherence. Journal of Cardiopulmonary
    Rehabilitation, 20
    , 4, 241–246.
  16. Fletcher, G.F., Balady, G.J. & Amsterdam, E.A. (2001). Exercise
    standards for testing and training: a statement for healthcare professionals
    from the American Heart Association. Circulation, 104, 1694-1740.
  17. Fortier, M.S., Vallerand, R.J., Briere, N.M. & Provencher, P.J.
    (1995). Competitive and recreational sport structures and gender: A
    test of their relationship with sport motivation. International Journal
    of Sport Psychology, 26
    , 24-39.
  18. Gattiker, H., Goins, P.& Dennis, C. (1992). Cardiac rehabilitation.
    Current status and future directions. West Journal of Medicine, 156,
    183-188.
  19. Giannuzzi, P., Saner, H., Bjornstad, P., Fioretti, P., Mendes, M.,
    Cohen-Solal, A., Dugmore, L., Hambrecht, R., Hellemans, I., McGee, H.,
    Perk, J., Vanhees, L. & Veress, G. (2003). Position paper of the
    working group on cardiac rehabilitation and exercise physiology of the
    European Society of Cardiology. European Heart Journal, 24,
    1273-1278.
  20. Harlan, W.R., Sandler, S.A., Lee, K.L., Lam, L.C. & Mark, D.B.
    (1995). Importance of baseline functional and socioeconomic factors
    for participation in cardiac rehabilitation. American Journal of
    Cardiology, 76,
    36-39.
  21. Kawahatsu, K., Itoh, Saida, Hamazaki, Aoto, Ayai, Nohara, Hashimoto,
    Go, Kambara, H. & Kawai, C. (1986). Application of swimming to a
    long-term sporttherapy in coronary artery disease. Japanese Journal
    of Physical Education, 30,
    4, 103-315.
  22. King, P. & Barrowclough, C. (1989). Rating the motivation of elderly
    patients on a rehabilitation ward. Clinical Rehabilitation, 3,
    289-91.
  23. King, A.C., Taylor, C.B. & Haskel, W.L. (1993). Effects of differing
    intensities and formats of 12 months of exercise training on psychological
    outcomes in older adults. Health Psychology, 12, 292-300.
  24. Lins, M., Speidel, T., Bastian, A., Zurbon, K.H., Bruhn, H.D. &
    Simon, R. (2003). Swimming and hemostasis during rehabilitation in patients
    with coronary heart disease. Thrombosis Research, 108, 191-194.
  25. Maclean, N. & Pound, P. (2000). A critical review of the concept
    of patient motivation in the literature on physical rehabilitation.
    Social Science and Medicine, 50, 495-506.
  26. Myers, J. (2003). Exercise and cardiovascular helath. Circulation,
    107
    (1), 20-26.
  27. Oldridge, N.B. (1979). Compliance of post myocardial infarction patients
    to exercise program. Medicine and Sciene in Sports, 11, 373-375.
  28. Oldridge, N.B. (1982). Compliance and exercise in primary and secondary
    prevention of coronary heart disease: A review. Preventing Medicine,
    11
    , 56-70.
  29. Oldridge, N.B. & Stoedefalke, K.G. (1984). Compliance and motivation
    in cardiac exercise programs. Clinical Sports Medicine, 3(2),
    443-454.
  30. Oldridge, N., Furlong, W., Feeny, D., Torrance, G., Guyatt, G., Crowe,
    J. & Jones N. (1993). Economic evaluation of cardiac rehabilitation
    soon after acute myocardial infarction. American Journal of Cardiology,
    72,
    154-61.
  31. Oldridge, N.B., Guyatt, G.H., Fischer, M.E. & Rimm, A.A. (1998).
    Cardiac rehabilitation after myocardial infarction. Combined experience
    of randomized clinical trials. Journal of the American Medical Association,
    260,
    5-50.
  32. Papageorgiou, P. (2001). Forecast of participation in exercise
    program: Health adults and patients with coronary heart disease
    .
    Unpublished Master Dissertation, University of Thrace, Department of
    Physical Education and Sports Science
  33. Pate, R.R., Pratt, M., Blair, S.N., Haskell, W.L., Macera, C.A., Buchenr,
    D., Ettinger, W., Heath, G.W., King, A.C., Kriska, A., Leon, A.S., Marcus,
    B.H., Morris, J., Paffenbarger, R.S., Patrick, K., Pollock, M.L., Rippe,
    J.M., Sallis, J. & Wilmore, J.H. (1995). Physical activity and public
    health. Journal of the American Medical Association, 273, 402-407.
  34. Pelletier, L.G., Fortier, M.S., Vallerand, R.J., Tuson, K., Brier,
    N.M. & Blais, N.M. (1995). Toward a new measure of intrinsic motivation,
    extrinsic motivation and amotivation in sports: The sport motivation
    scale (SMS). Journal of Sport and Exercise Psychology, 17, 35-53.
  35. Pell, J., Pell. A. & Morrison, C. (1996). Retrospective study
    of influence of reprivation on uptake of cardiac rehabilitation. British
    Medicine Journal, 313
    , 276-268.
  36. Rockhill, B. Willet, W.C. & Manson, J.E. (2001). Physical activity
    and mortality: a prospective study among women. American Journal
    of Public Health, 91
    (4), 578-583.
  37. Ryan, R.M., Vallerand, R.J. & Deci, E.L. (1984). Intrinsic motivation
    in sports: A cognitive evaluation theory interpretation. In W.F. Staub
    & J.M. Williams (Eds.),Cognitive Sport Psychology
    (pp. 231-242). Lansing, NY: Sport Science Associates.
  38. Ryan, R.M., Connell, J.P. & Crolnick, W.S. (1990). When achievement
    is not intrinsically motivated: A theory of self regulation in school.
    In A.K. Boggiano & T.S.
  39. Pittman (Eds.),Achievement and Motivation: A social-development
    perspective (
    pp. 143-158). New York: Cambridge University Press.Ryan,
    R.M. & Deci, E.L. (2000). Intrinsic and extrinsic motivation: Classic
    definition and new directions. Contemporary Educational Psychology,
    25,
    54-67.
  40. Sarafino, E.P. (1990). Health psychology: biopsychological interactions.
    New York: John Wiley & Sons.
  41. Song, R. & Lee, H. (2001). Effects oa 12-week cardiac rehabilitation
    exercise program on motivation and health promoting lifestyle. Heart
    and Lung, 30
    , 3, 200-209.
  42. Stults, M.P. (2001). Motivation and Perceived Relatedness. Presented
    at the Meeting of the Midwesten Psychological Association. Psi
    Chi Poster Session, Chicago, May.
  43. Vallerand, R.J., Blais, M.R., Briere, N.M. & Pelletier, L.G. (1989).
    Construction et validation de l’echelle de motivation en education
    (EME). Revue Canadienne des Sciences du Comportement, 21, 323-349.
  44. Vallerand, R.J. & Bissonnette, R. (1992). Intrinsic, extrinsic
    and amotivational styles as predictors of behavior: A prospective study.
    Journal of Personality, 60, 599-620.
  45. Vallerand, R.J. & Losier, G. F. (1999). An integrative analysis
    of intrinsic and extrinsic motivation in sport. Journal of Applied
    Sport Psychology, 11
    , 142-169.
  46. Vallerand, R.J. & Perrault, S. (1999). Intrinsic and extrinsic
    motivation in sport: Toward a hierarchical model. In R. Lidor &
    M. Bar-Eli (Eds.), Sport Psychology: Linking Theory and Practice
    (pp. 191-212). Morgantown, WV: Fitness Information Technology, Inc.
  47. Vlachopoulos, S.P., Karageorghis, C.I. & Terry, P.C. (2000). Motivation
    profiles in sport: A self-determination theory perspective. Research
    Quarterly for Exercise and Sport, 71
    (4), 387-397.
  48. Wolff, B.B. (1969). How do rheumatic diseases relate to economic potential
    as influenced by personal attitudes and motivation. Palliative Medicine,
    72,
    68-70.
2015-03-20T08:36:36-05:00March 7th, 2004|Contemporary Sports Issues, Sports Exercise Science, Sports Studies and Sports Psychology|Comments Off on Evaluation of Motivation in Patients with Coronary Heart Disease Who Participate in Different Rehabilitation Programs

Consumer Experience Tourism and Brand Bonding: A Look at Sport-Related Marketers

ABSTRACT

This manuscript reviews the growing use of manufacturing plant tours,
company museums, and company visitor centers by sport-related marketers
(equipment manufacturers, venues, etc) to cultivate relationships with
existing and potential consumers. Consumer Experience Tourism provides
the user (i.e., the consumer) with an experience regarding a product,
its operation, production process, history, and historical significance.
Such brand bonding may contribute to higher levels of involvement with
a product/brand and brand loyalty. Ultimately, the bond between consumers
and brands may be strengthened by the availability of such consumer experiences.
Such tourism opportunities provided by sport-related firms are profiled.

INTRODUCTION

The National Sporting Goods Association tracks the annual sales of sports
equipment, footwear, clothing, and recreational transportation (such as
bicycles, pleasure boats, RVs, and snowmobiles). For 2003, it is estimated
these four product categories combined for almost $80 billion in sales
(sports equipment, $22.2 billion; footwear, $14.4 billion; clothing, $10.1
billion; and recreational transportation, $40 billion (please see nsga.org).

The Relationship Marketing orientation has prompted brand managers to
seek new and innovative ways of creating long-lasting, mutually-beneficial
relationships (or bonds) with a most important asset; namely, their customers.
Increasingly, brand managers are recognizing the opportunity to showcase
a product’s creation and/or evolution as an important catalyst for
forging stronger bonds with consumers. So, interested consumers/tourists
can witness the production of such items as Calloway Golf Clubs, Fleetwood
RVs, Louisville Slugger Baseball Bats, Trek Bicycles, and Harley-Davidson
Motorcycles.

The purpose of this manuscript is to evaluate the growing use of manufacturing
plant tours, company museums, and company visitor centers by sport-related
markets to cultivate stronger relationships with consumers and to (hopefully)
stimulate greater brand loyalty. First, the concept of Consumer Experience
Tourism is defined. Second, the underlying interest in this type of tourism
activity is reviewed. Third, the target consumers for such tourism venues
are examined. Next, existing Consumer Experience Tourism efforts of sport-related
marketers are profiled. Finally, the desired outcomes of these efforts
are discussed.

CONSUMER EXPERIENCE TOURISM

Manufacturing plant tours, company museums, and company visitor centers
represent a segment of tourism known by different names: manufacturing
tourism, industrial attractions, industrial tourism, and industrial heritage
tourism. The shared desire of such facilities is to establish a bond between
a consumer and brand as the consumer learns about the brand, its operation,
production process, history, and historical significance. The term “Consumer
Experience Tourism” represents a unifying theme for this segment
of the tourism industry. This term captures the consumer’s ability
to discover more about the brands they consume while manufacturers can
forge closer relationships with those consumers during the 30-120 minutes
of time spent as the facility’s guests (Mitchell and Mitchell 2000,
2001, 2002; Mitchell and Orwig 2002). (The abbreviation CET will be used
throughout the manuscript to represent Consumer Experience Tourism.)

Involvement With a Brand

Brand managers seek to address consumer needs at three levels: functional
(providing solutions to consumer problems); symbolic (providing satisfaction
of psychological desires); and experiential (providing sensory pleasure,
variety, and cognitive stimulation) (Park, Jaworski, and MacInnis, 1986).
CET can strengthen the bond between consumers and brands by providing
a visual presentation of the brand, its operation, production process,
history, and historical significance. Such a bond may be viewed as an
increased level of personal involvement with the brand and (assumedly)
translates into greater brand loyalty. For example, a parent seeking to
cultivate a child’s interest in baseball can take that child to
the Louisville Slugger tour (Louisville, KY).

Cognitive involvement reflects a consumer’s interest in thinking
(or learning more) about a product (Park and Young, 1986). CET may increase
the consumer’s level of cognitive involvement by stimulating thinking
about the brand and its production processes. So, an active golfer may
appreciate witnessing the manufacturing processes used by Karsten Manufacturing
(i.e., Ping) (Phoenix, AZ) or Calloway (Carlsbad, CA). Further, the positive
word-of-mouth communication stimulated by satisfied visitors may be deemed
more credible than other paid forms of promotion.

INTEREST IN CONSUMER EXPERIENCE TOURISM

Many people think of manufacturing plant tours, company museums, and
company visitor centers as low-cost entertainment (and educational) options
for parents with children because such tours are typically free or require
only a nominal fee (Lukas, 1998). While this is a key target market and
a benefit the consumer may seek, the root cause of this fascination runs
much deeper.

Harris (1989) and Prentice (1993) point out that factories and mines
have historically employed a large percentage of the American workforce.
The shift to a service economy takes individuals out of the factories.
This removes people spatially and culturally from the manufacturing sector
providing less contact and little first-hand knowledge of industrial work.
The plant tour creates a novel and nostalgic view of industrial work,
which in turn feeds tourist interest in manufacturing processes. Harris
and Prentice further note that many younger workers’ lack of factory
work experience progresses naturally toward an increasing curiosity about
the topic.

Older employees may relish the experience of “returning to their
roots”. Rudd and Davis (1998) identify the industrial revolution
as a defining event in American history with company plant tours providing
users a look at our collective past. Richards (1996) notes the industrial
revolution created an era where the transition from modern to obsolete
occurs more rapidly. As such, products of older technology are considered
cultural and historical artifacts creating feelings of nostalgia among
society. Company museums or visitor centers capitalize on these emotions
by providing a sentimental, bonding experience between buyer and brand.

The “Retro Example”

The current interest in retro sports clothing is a manifestation of
this interest, even fascination, with the past. All four major North American
sports leagues are aggressively pursuing this growing market (Finney 2003).
Throwback jerseys and other merchandise have become a $1 billion global
industry. The National Basketball Association (or, NBA) sold over $400
million worth of its Hardwood Classics in 2002. The National Hockey League
(or, NHL) is approaching $250 million in vintage merchandise sales. It
is interesting to note that many of these jerseys, ball caps, and other
items represent teams that no longer exist (i.e., Winnipeg Jets or Quebec
Nordiques) or former stars (i.e., Bobby Clarke) (Westhead 2003). The Negro
Leagued Baseball Museum (Kansas City, MO) considers such merchandising
initiatives an opportunity to educate younger fans about an important
part of American and sport history (Spellman 2003).

Sports venues designed as “retro” or “throw-back”
facilities are another interesting manifestation of this interest in the
game’s history. While Wrigley Field, Fenway Park, and Yankee Stadium
continue to be held in high regard for their historic value, newer ballparks
have been designed to capture the old ambiance of a day at the park while
enhancing customer comfort. Such parks as PNC Park (Pittsburgh Pirates),
Jacobs Field (Cleveland Indians), Camden Yards (Baltimore Orioles), Comerica
Park (Detroit Tigers), or Conseco Fieldhouse (Indiana Pacers) have embraced
the past while enhancing fan (and player) comfort.

TARGET CONSUMERS FOR CONSUMER EXPERIENCE TOURISM

A manufacturer can use its physical facilities to establish (or strengthen)
the bond with a variety of parties. The target consumers for CET
can be divided into three categories: current and potential consumers,
business partners, and community stakeholders.

Bonding With Consumers

Manufacturing plant tours, company museums, and company visitor centers
have become a low-cost entertainment option for families, community groups,
business travelers, and others. They provide a day trip option for local
residents. Schools also benefit through field trips for area students
and teachers. Business travelers become aware of best practices from firms
in both related and unrelated industries (Axelrod and Brumberg 1997).
Prentice (1993) notes that areas with large numbers of business travelers
are particularly fertile for the development of such a tourism venue as
travelers can invest a small amount of time and have a valuable experience
with a brand. So, a salesperson can spend approximately 1 hour at the
BMW Zentrum in Greer, SC as they travel the Greenville-Spartanburg area
or as they shuttle from Charlotte to Atlanta.

Bonding With Business Partners

Though business associates are also frequently users of a brand, their
interests are typically more professional than personal. Lucas (1998)
suggests, “museums create the specter of the Wizard of Oz, but factory
tours provide a glimpse of the man behind the curtain.” Business
relationships enhanced by CET include corporate managers, future employees,
new sales agents, industrial suppliers, shareholders, and others. Plant
tours provide corporate managers with an enhanced understanding of how
manufacturing capabilities contribute to a company’s strength in the marketplace.

The plant tour may also be an effective means of identifying and recruiting
future employees by creating interest in the company’s manufacturing
processes (Day, 1990). Upton (1997) suggests that everyone who interacts
with a manufacturing plant (i.e., buyers, suppliers, managers, employees,
and so on) benefits from a comprehensive look at the manufacturing process.

Bonding With Community Stakeholders

Plant tours may be an effective means of communicating with regulatory
agencies and/or public interest groups. For instance, Nike commissioned
a panel to review its operations in China, Indonesia, and Vietnam to counter
perceptions of unfair labor practices and working conditions. The review
process included on-site plant tours and visits with local employees.
The company received a favorable review with respect to this volatile
public relations issue (Neuborne, 1997). Conducting tours of new facilities
during grand openings is commonly practiced, with target consumers including
shareholders, politicians, dignitaries and reporters. While target audiences
may have individual motivations for taking such a tour and may seek different
outcomes from it, it is certain that people are interested in the work
of others.

CONSUMER EXPERIENCE TOURISM EFFORTS BY SPORT MARKETERS

Currently, a number of sport marketers provide manufacturing plant tours,
company museums, and company visitor centers to support their products.
These firms compete in such diverse product categories as baseball/softball
equipment, golf clubs, fishing equipment, boats, and others (see Table
One
).

Table One
Consumer Experience Tourism Offerings of Sport Equipment Manufacturers

Company Name Location Product Category
Karsten Manufacturing (Ping) Phoenix, AZ Golf Equipment
Calloway Golf Carlsbad, CA Golf Equipment
Correct Craft (Ski Nautiques water-ski boats) Orlando, FL Boats
Coachman RVs Middlebury, IN RVs
Jayco RVs Middlebury, IN RVs
Hillerich and Bradsby
(Louisville Slugger, PowerBilt)
Louisville, KY Baseball Equipment
Golf Equipment
Arctco (Arctic Cat) Thief River Falls, MN Snowmobiles
Christian Brothers Warroad, MN Hockey Sticks
Polaris Roseau, MN Snowmobiles
Airstream Jackson Center, OH RVs
Goodyear Akron, OH Tires
Wooden Touch Putters (Oregon Connection) Coos Bay, OR Golf Equipment
Luhr-Jensen Lures Hood River, OR Fishing Equipment
Harley-Davidson York, PA Motorcycles
Vanguard Racing Sailboats Bristol, RI Boats
Worth Tullahoma, TN Baseball and Softball Equipment
Nocona Athletic Nocona, TX Baseball and Football Equipment
K2 Vashon, WA Skiing Equipment
Trek Waterloo, WI Bicycles

Source: Axelrod, K. and B. Brumberg (1997), Watch
It Made in the U.S.A
., Sante Fe, NM: John Muir Publications.

A list of automotive-related tours is separated and presented in Table
Two
.

Table Two
Consumer Experience Tourism Offerings of Automobile Manufacturers

Company Name Location Product Category
Mercedes Benz Vance, AL Automobiles
Mitsubishi Automobile Normal, IL Automobiles
Corvette Bowling Green, KY Automobiles
Ford Louisville, KYEdison, NJ Automobiles
Toyota Georgetown, KY Automobiles
General Motors Flint, MIJanesville, WI Automobiles
Goodyear Akron, OH Tires
Honda Marysville, OH AutomobilesMotorcycles
BMW Greer, SC Automobiles
Nissan Smyrna, TN Automobiles
Saturn Spring Hill, TN Automobiles

Source: Axelrod, K. and B. Brumberg (1997), Watch
It Made in the U.S.A
., Sante
Fe, NM: John Muir Publications.

It should be noted that NASCAR drivers/owners have been particularly
active in embracing CET for their use. NASCAR fans can visit the working
garage of their favorite drivers and witness the preparation of the very
cars they will watch later at the track. The most popular destinations
for NASCAR fans include Joe Gibbs Racing, Hendrick Motor Sports, Dale
Earnhardt Incorporated, Petty Enterprises, and others. The majority of
such facilities are located in close proximity to Charlotte, NC. Additionally,
most larger racetracks provide tours of their facilities including garage
areas, pits, and grandstands. An example list (not exhaustive) of these
tracks is presented in Table Three.

Table Three
Example Motor Sport Tracks Offering Public Tours

Name of Track Location
Atlanta Motor Speedway Atlanta, GA
Las Vegas Motorspeedway Las Vegas, NV
Lowe’s Motor Speedway Concord, NC
Daytona International Speedway Daytona, FL
Texas Motor Speedway Fort Worth, TX
Indianapolis Motor Speedway Speedway, IN
Talladega Superspeedway Talladega, AL
Kentucky Speedway Sparta, KY
Kansas Speedway Kansas City, KS

Source: Original constructed from information gained
from nascar.com.

As new stadiums have been built for professional teams, their owners
have identified the value of opening their facilities to the general public
for tours. Fans can now tour such venues as Lincoln Financial Field (Philadelphia
Eagles, NFL), Invesco Field at Mile High (Denver Broncos, NFL), PNC Park
(Pittsburgh Pirates, MLB), Camden Yards (Baltimore Orioles, MLB), and
the American Airlines Center (Dallas Mavericks, NBA and Dallas Stars,
NHL). And, some older ballparks continue to welcome guests to take nostalgic
tours of their facilities, including Wrigley Field (Chicago Cubs, MLB),
Fenway Park (Boston Red Sox, MLB), Yankee Stadium (New York Yankees, MLB),
New Orleans Superdome (New Orleans Saints, NFL), and others.

Table Four
Additional Sport Halls of Fame

Name Location
Bowling Hall of Fame and Museum St. Louis, MO
United States Golf Association Museum and Library Far Hills, NJ
International Tennis Hall of Fame and Museum Newport, RI
U.S. Bicycling Hall of Fame Somerville, NJ
Lacrosse Hall of Fame Baltimore, MD
World Figure Skating Museum and Hall of Fame Colorado Springs, CO
America’s Cup Hall of Fame Bristol, RI
Negro Leagues Baseball Museum Kansas City, MO
United States Slo-Pitch Softball Hall of Fame Petersburg, VA
Weightlifting Hall of Fame York, PA

Source: Arany, L. and A. Hobson (1998), Little
Museums: Over 1,000 Small (And Not-So-Small) American Showplaces
,
Henry Holt, New York.

DESIRED OUTCOMES FROM CONSUMER EXPERIENCE TOURISM

Involvement theory suggests that consumers who have witnessed a product’s
production may become more brand loyal as a result of their identification
with the product, their familiarity with the production process, their
first-hand interaction with employees, first-hand witness to their quality
assurance processes, and other internal needs. As such, business outcomes
such as growth in buyer loyalty, sales, profitability, and market share
are some of the outcomes sought by companies that provide manufacturing
plant tours, company museums, and company visitor centers. It would be
myopic, however, to suggest CET is solely driven by the desire to increase
sales, profitability, or market share. Other outcomes sought focus on
company image, education, and open communication.

Company Image

Plant tours provide firms the opportunity to build a relationship with
local residents. This can be particularly important if the product or
production processes are perceived to pose environmental concerns (i.e.,
a car plant that produces air emissions). When public funds are used to
build sports arenas, owners may seek to enhance their image by showcasing
what the public has received for their investment.

Education

Plant tours provide a multi-sense experience for consumers, employees,
shareholders, suppliers, and other stakeholders. Consumers can bond with
brands. Company employees can visualize the larger manufacturing process
and appreciate the contribution their particular function or sub-routine
makes to the finished good. As noted earlier, the licensing of retro sports
images by the Negro League Museum (Baseball) allows younger consumers
(often African-Americans) to learn more about the historical significance
of the league and its players.

Salespeople, as well as external sales agents, can study the manufacturing
processes to be better prepared to answer (and anticipate) buyer questions.
For example, a sporting goods sales representative can better appreciate
the manufacturing processes used by Worth to produce its line of baseball
and softball equipment. This representative then carries this knowledge
into the marketplace. A firm’s shareholders (for example, Calloway
Golf, Ford, Goodyear, Harley-Davidson) can witness the processes used
by the firms in which they have an equity position. Finally, some academic
and professional associations include plant tours on their meeting agendas
for continuing education.

Open Communication

An open manufacturing process conveys to others an open communication
style of an organization (i.e., we’ve got nothing to hide). Positive word-of-mouth
communication is stimulated among satisfied on-lookers. Campers having
witnessed the manufacturing of their Jayco or Coachman RVs may be more
likely to share their confidence in their units with fellow campers. News
media may provide “free press” given the novelty of the open
approach to manufacturing (such as the wooden head golf putters produced
by Oregon Connection. While some argue the opportunity for “true”
benchmarking may be overstated, one key outcome of industrial tourism
programs for managers is the openness of communication and the ability
to learn from others (Hinton, 1996).

SUMMARY STATEMENTS

Consumer experience tourism provides the consumer with a bonding experience
regarding a brand, its operation, production process, history, and historical
significance. A consumer witnessing the production of their favorite brand
of golf equipment, snowmobiles, fishing equipment, or softball bats may
become a more brand loyal user as their level of involvement with the
brand intensifies. Such an experience may increase the buyer’s cognitive
involvement with the brand while addressing the buyer’s need for
experiential learning. Further, the aura of the manufacturing process
or historical evolution of the brand may become an integral part of brand’s
image (e.g., as mechanics create race cars in NASCAR garages). Finally,
this same tourist may become a credible spokesperson for the firm as s/he
shares with others the excitement of watching their hockey sticks, baseball
bat or skis actually being produced. Toward this end, CET can become an
integral part of a firm’s integrated marketing communications program.

As the U.S. economy continues its progression from a manufacturing-driven
economy to one driven by services and information, the interest in “how
things work” or “how’d they make that” intensifies. The
separation from the manufacturing process feeds the growing interest in
CET. Further, citizens studying current processes used to produce familiar
brands can celebrate the industrial heritage of their nation. Ultimately,
the bond between consumers and brands may be strengthened by the availability
of manufacturing plant tours, company museums, and company visitor centers.
The relative importance of these outreach efforts, in addition to their
availability, will likely increase as the competition for sports equipment
and entertainment further intensifies.

REFERENCES

  1. Arany, L. and A. Hobson (1998), Little Museums: Over 1,000 Small
    (And Not-So-Small) American Showplaces
    , Henry Holt, New York.
  2. Axelrod, K. and B. Brumberg (1997), Watch it Made in the U.S.A.:
    A Visitor’s Guide to the Companies That Make Your Favorite Products
    (2nd Edition)
    ,
    John Muir Publications, Sante Fe,
    NM.
  3. Day, C. R. (1990), “Strut Your Stuff,” Industry Week,
    Vol 239 No 19, p. 5.
  4. Finney, D. P. (2003), “Back to the Future,” St. Louis
    Post-Dispatch
    , July 21, p. E1.
  5. Harris, F. (1989), “From the Industrial Revolution to the Heritage
    Industry,” Geographical Magazine, Vol 61, pp. 38-42.
  6. Hinton, J. (1996), “Rivals Club Together,” Accountancy,
    Vol 117 No 1, pp. 36-37.
  7. Lukas, P. (1998), “Working Vacation,” Money, Vol
    27 No 9, pp. 170-171.
  8. Mitchell, M. and S. Mitchell (2002), “Consumer Experience Tourism:
    A Powerful Tool for Food and Beverage Producers,” Journal of
    Food Products Marketing,
    Vol 6 No 3, pp. 1-16.
  9. Mitchell, M. and S. Mitchell (2001), “Showing Off What You Do
    (And How You Do It),” Journal of Hospitality and Leisure Marketing,
    Vol 7 No 4, pp. 61-77.
  10. Mitchell, M. and S. Mitchell (2002), “Consumer Experience Tourism
    in the Nonprofit & Public Sectors,” Journal of Nonprofit
    & Public Sector Marketing
    , Vol 9 No 3, pp. 21-34.
  11. Mitchell, M. and R. Orwig (2002), “Consumer Experience Tourism:
    Brand Bonding,” Journal of Product and Brand Management,
    Vol 11 No. 1, pp. 30-41.
  12. nascar.com (National Association of Stock Car Racing)
  13. nsga.org (National Sporting Goods Association).
  14. Neuborne, E. (1997), “Young Gives Nike Fair Review After Plant
    Tour,” USA Today, June 25, Section B, p. 5.
  15. Park, C.W. and S.M. Young (1986), “Consumer Response to Television
    Commercials: The Impact of Involvement and Background Music on Brand
    Attitude Formation, Journal of Marketing Research, Vol 24 No
    1, pp. 11-24.
  16. Park, C.W., B.J. Jaworski, and D.M. MacInnis (1986), “Strategic
    Brand Concept – Image Management,” Journal of Marketing,
    Vol 50 October, p. 136.
  17. Prentice, R. (1993), Tourism and Heritage Attractions,
    Routledge Kegan Paul, New York.
  18. Richards, G. (1996), “Production and Consumption of European
    Cultural Tourism,” Annals of Tourism Research, Vol 23, pp.
    261-283.
  19. Rudd, M. A. and J. Davis (1998), “Industrial Heritage Tourism
    at the Bingham Canyon Copper Mine,” Journal of Travel Research,
    Vol 36 No 3, pp. 85-89.
  20. Spellman, M. (2003), “Negro League Jerseys, Caps will Soon be
    Available,” Chicago Daily Herald, July 14, p. 10.
  21. Upton, D. (1997), “Why (and How) to Take a Plant Tour,”
    Harvard Business Review, Vol 75 No 3, pp. 97-106.
  22. Westhead, R. (2003), “The CFL Goes Retro,” The Toronto
    Star
    , June 29, p. C01.
2015-03-20T08:35:48-05:00March 6th, 2004|Contemporary Sports Issues, Sports Exercise Science, Sports Management, Sports Studies and Sports Psychology|Comments Off on Consumer Experience Tourism and Brand Bonding: A Look at Sport-Related Marketers

The Study of Physiological Factors and Performance in Welterweight Taekwondo Athletes

Abstract

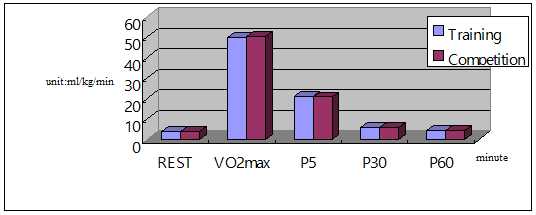
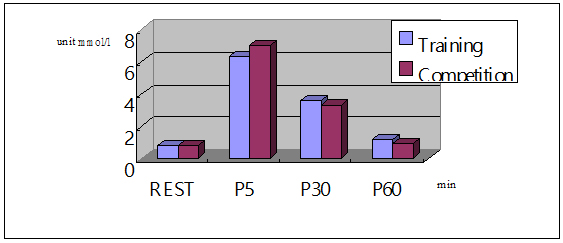
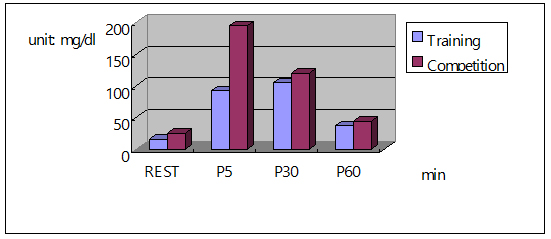
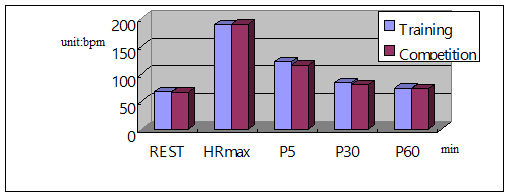
The purpose of this research was to investigate the variation in heart rate, oxygen consumption and blood lactic acid for taekwondo athletes during training and competition. Ten taekwondo athletes from a Division I university volunteered for the research. The average age of the subjects was 19.5±0.5 .4 yr, the height was 174.6±2.8 cm, the weight was 63.6±1.4 kg, the black belt rank was 2.5±0.5, and the average training period was 6.4±1.0 years. The competition was of university class. During the experiment, each subject rode the bicycle ergometer until complete exhaustion at a speed of 60 RPM and power of 120W that increased by 30W every two minutes. The investigation focused mainly on the variations during the rest period and the three recovery periods after exercise (5th, 30th and 60th minute). Wireless heart recorder (POLAR), Vmax29 gas analyzer, YSI2300 lactic acid analyzer and DAIICHI analyzer were used to analyze heart rate, oxygen consumption, blood lactic acid and urobilinogen. According to the statistical analysis on one-way ANOVA with Repeated Measures and a Scheffe Post Hoc test, the results showed that:

1.There was no difference at the cardiac respiratory functioning between training and competition period. The players can’t recovery quickly for sixty minutes.
2. There was a significant difference at the BLA on the competition period higher than training period (7.0±1.3 vs. 6.3±1.2 mmol/l, p<.05).
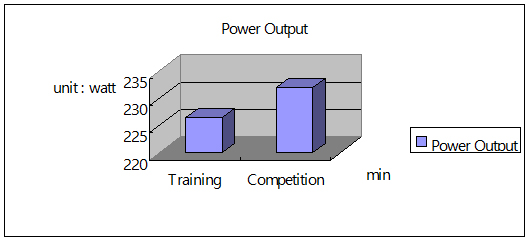
3.There was no difference at the URO between training and competition period in the post-exercise 60 minute and rest.4. There was a difference on the output power at training period higher than competition period (232.7±14.5 vs. 226.5±14.7 watt, p< .05).

To recover the rest state more time and improve intensive training in the blood lactic acid system and power output. It’s a benefit and helpful for the players and coaches to investigate the reference during the contest and sport science training.

I. Introduction

According to the theory of Periodization of Strength, gains in muscular strength (M*S) during the M*S phase should be transformed into either muscular endurance (M-E) or P during the conversion phase so athletes acquire the best possible sport-specific strength and are equipped with the physiological capabilities necessary for good performance during the competitive phase. To maintain good performance throughout the competitive phase, this physiological base must be maintained (Bompa, 1999). The determination of physiological variables such as the anaerobic threshold (AT) and maximal oxygen uptake (VO2max) through incremental exercise testing, and relevance of these variables to endurance performance, is a major requirement for coaches and athletes (Bentley, Mcnaughton, Thompson, & Batterhan, 2001).

According to the theory of Periodization of Strength, gains in muscular strength (M*S) during the M*S phase should be transformed into either muscular endurance (M-E) or P during the conversion phase so athletes acquire the best possible sport-specific strength and are equipped with the physiological capabilities necessary for good performance during the competitive phase. To maintain good performance throughout the competitive phase, this physiological base must be maintained (Bompa, 1999). The determination of physiological variables such as the anaerobic threshold (AT) and maximal oxygen uptake (VO2max) through incremental exercise testing, and relevance of these variables to endurance performance, is a major requirement for coaches and athletes (Bentley, Mcnaughton, Thompson, & Batterhan, 2001).

Heller, et al. (1998) pointed out that Taekwondo could not only improve human cardio respiratory endurance but also enhance practitioners’ martial arts spirit, and form good exercise and self-defense exercise. It also is classified as a high-strength anaerobic capacity exercise. Shin (1993) reported that excellent international Taekwondo athletes must have high speed and power for them to win the international games. The energy system of anaerobic power and anaerobic capacity mainly comes from ATP and Glycolsis system. Taekwondo practice had positive impact on the improvement of human cardio respiratory and physical ability (Pieter et al., 1990).

Heller et al (1998) found that the maximum oxygen consumption volume was 57.0 ml/kg/min in Spanish international Taekwondo athletes and 53.8 ml/kg/min in Czech international athletes. The maximum oxygen uptake in Taekwondo black-belt athletes is 44.0 ml/kg/min (Drobni et al., 1995). Bompa (1999) investigated boxing and martial arts, a quick and powerful start of an offensive skill prevents an opponent from using an effective action. The elastic, reactive component of muscle is of vital important for delivering quick action and powerful starts.

The purpose of this study is to investigate the change of heart rate, oxygen consumption, blood lactate, and urine urobilinogen in resting phase, and in post exercise recovering phase at 5 min, 30 min and 60 min after a total 10-week period including training and competition phases.

II. Study Methods and Procedures

Selection of the Subjects

Ten male TaekwonDo athletes were recruited as volunteer subjects in this study. The mean age, body height, weight, rank, and training experience of these subjects were 19.3±0.5 years, 174.6±2.8 cm, 63.6±1.4 kg, 2.5±0.5, and 6.4±1.0 years, respectively.

Time and Venue

The whole study was completed in the Sports Physiology Lab of Chinese Culture
University, Taiwan. The research of training phase was done from May 11 to 12, 2002. The research of peak phase was done from May 25 to 26, 2002.

Study Methods and Procedures

According to the training content completely controlled by the coach, the training duration is 10 weeks, once every morning for 1.5 hours and every afternoon for 2 hours. The research method was to arrange the subjects to pedal on a bicycle to exhaustion at cycling rate 60 RPM and initial workload 120 W with 30 W increase every 2 minutes. The post-exercise physical changes (heart rate, oxygen consumption, blood lactate, and urine urobilinogen value) were measured in baseline phase, training phase and competition phase, collecting 3 samples in each phase.

(1) Informed consent forms were obtained after the study procedures and potential effects were explained to the subjects, and were understood by the subjects. The status of subjects’ general health was also recorded.

(2) Subjects who were in a bad mood and not in good physical condition were not allowed to perform the test, and were scheduled to return at another time.

(3) 30 minutes before the experiment, the experimental equipment started to warm up, and experimental material was prepared. The subjects were arranged on a bicycle to start pedaling to exhaustion at cycling rate 60 RPM and initial workload 120 W with 30 W increase every 2 minutes. The physical changes (heart rate, oxygen uptake, blood lactate, urine urobilinogen value)were measured at 1. Resting phase 2. First minute of post exercise recovering phase 3. 5th minute of post exercise recovering phase 4. 30th minute of post exercise recovering phase 5. 60th minute of post exercise recovering phase.

(4) During the experiment, the research staff recorded the information obtained from the instruments. When the first experiment ended, the subject would be informed of the time of next experiment.

(5) Study Equipment and Instruments: The following items were utilized in this research:

  1. SENSOR MEDICS Vmax29 Gas Meter
  2. YSI2300 PLUS Lactate Analyzer
  3. DAIICHI 701 Analyzer
  4. 586 PIII computer and Laser printer
  5. (POLAR) Mobile heart rate recorder
  6. Stopwatch
  7. Hygrometer

Data Management

(1) All data collected from the study were analyzed using 3 statistical software programs: Microsoft Excel 8.0, SPSS/PC 10.0, and SPSS for Windows.

(2) Multiple variants were analyzed by ONE-WAY ANOVA and subsequent Scheffe’ way for post-hoc analysis.

(3) Significant difference was set at α=. 05.

III. Results and Discussion

1.Assessment of Cardio respiratory function

(1)The result of heart rate measurements. There were no statistically significant differences for heart rate between training and competition period(188.7±2.8 vs. 189..6±1.6 bpm , p>.05) (Table 3-1)(Figure3-1). The results showed no overstraining of the heart rate between training and competition period. Arja & Uustitalo(2001) reported overstraining syndrome as a serious problem marked by decreased performance, increased fatigue, persistent muscle soreness, mood disturbances, and feeling ‘burn out ‘ or stale.

Lin & Kuo (2000) found Tae-kwon-Do competition with 3 runs (3 min per run), and 1-min break in every game, the score decides who is the winner. During a game, their heart rates would increase to 165 time/min. Some may reach 192 time/min. It shows that Tae-kwon-Do is a high-intensity exercise, which has greater impact on circulation and respiratory systems. Related to this study, the athletes in different grades of technique and body weight have different fitness physical conditions. Guidetti, Musulin, & Baldari (2002) reported eight elite amateur boxers’ HRmax at 195±7 bpm. The measurement of maximum heart rate is important because it is often used to determine the intensity of cardiovascular training zone. In reality, a larger size athlete would tend to have a lower HRmax value than the predicted value (McArdle et al., 2001). Melhim (2001) et al. found that Tae-kwon-Do exercise could improve children’s cardio respiratory function, improve practitioners’ attack and defense skills and enhance self-health adjusting ability. The result shows that the resting heart rate did not have significant difference after aerobic power training; Anaerobic power and anaerobic capacity had a significant difference, 28% and 61.5% increase respectively; Before and after the training, there was no significant difference in resting heart rate (80.0±6.0 vs. 77.0±9.0 time/min, p>. 05) and in maximum oxygen uptake (VO2 max ) (36.3±9.2 vs. 38.2±7.8 ml/kg/min, p>.05). In 80-second Tae-kwon-Do competition, VO2max is 68/ml/kg/min. There was no difference at the heart rate in the training period between post-exercise 60 minute and rest (73.6±3.7 vs. 67.6±3.2 bpm , p>.05). There was no difference at the heart rate in the competition period between post-exercise 60 minute and rest (72.9±3.7 vs. 67.0±2 .0 bpm , p>.05).

Table 3-1 Heart rate comparisons between training and competition n=10 (unit: bpm)

Rest Hrmax post-5 p-30 p-60
Training 67.6±3.2 188.7±2.8 121.3±7.0 84.2±3.2 73.6±3.7
Competition 67.0±2.0 189.6±1.6 115.7±13.2 80.4±5.8 72.9±3.7

* means significant different between training and competition

The elite athlete can recover quickly to a rest state and have low a heart rate. Heart rates of general athletes at rest, before and after exercise, were 71, 59, 36 time/min, and their maximum heart rates were 185, 183, 174 time/min, respectively(Jack & David, 1999). The results showed the athletes didn’t recover to the rest period for sixty minutes in the post-exercise between training and competition period. Maybe the players need more time to improve the recovery state. It’s important for the coach and players to improve the recovery system on time because the players have to keep peak performance to success. Prevention is still the best treatment, and certain subjective and objective parameters can be taken by athletes and coaches to prevent over training between practice and competition periods.

Zen-Pin Figure 1

Figure 3-1 Heart rate comparisons between training and competition

(2)The result of VO2max There was no difference at the VO2max between training and competition period (49.6±3.3 vs. 50.3±3.0 ml/kg/min, p>.05)(Table3-2)(Figure3-2). Drobnic(1995)discussed recreational Tae-kwon-do athletes had a mean VO2max about 44.0 ml/kg/min; however, the VO2max values for elite athletes would be significantly higher than the athletes of recreational level. The National Taekwando Team of China had an average of VO2max of 57.57 ml/kg/min. The mean VO2max value of the Korean National Team, the perennial dominant power of this event, was about 59.56 ml/kg/min (Hong, 1997).Heller et al(1998) reported the average VO2max of the black-belt athletes on the Spanish national squad was 57.0 ml/kg/min, and as for the Czech Republic Team, the value was 53.8 ml/kg/min. Based on the results of previous research, it was suggested that male and female contestants with VO2max of 65 ml/kg/min and 55 ml/kg/min respectively, had a better chance to win Olympic medals. Intensive aerobic training could improve the physiological functions of highly trained sport contestants (Cooke et al., 1997).

Macdougall, Wenger & Green(1990)found ranges of VO2max reported for international athletes in male wrestling, soccer, basketball, and untrained. Their result were 50-70 ml/kg/min, 50-70 ml/kg/min, 40-60 ml/kg/min, 38-52 ml/kg/min. Guidetti, Musulin, & Baldari (2002) examined the physiological characteristics of the middleweight class boxers. Their VO2max at the individual anaerobic threshold was about 46.0±4.2ml/kg/min and their VO2max was 57.5±4.7 ml/kg/min. In addition, their hand-grip strengths and wrist girths were measured and compared to other combat-sports athletes.

In a competitive Olympic (non-professional) boxing match, boxers must fight for a total of 11 minutes. The fight is structured for three 3-minute rounds with a 1-min rest interval between each round. An athlete must have a high anaerobic threshold level and aerobic power level to meet the demand of this sport (Guidetti et al., 2002). Zabukovec & Tiidus(1995) investigated the physiological characteristics of kickboxers .Professional male middleweight (73-77 kg) and welterweight (63-67 kg) kickboxers were determined to have relatively higher aerobic capacities (VO2max, 54-69 ml/kg/min) than previously reported for many other power or combat athletes.

Table 3-2 Oxygen consumption comparisons between training and competition n=10 (unit: ml/kg/min)

Rest VO2max post-5 p-30 p-60
Training 3.9±0.3 49.6±3.3 20.8±1.1 5.9±0.3 4.3±0.1
Competition 3.8±0.4 50.3±3.0 20.7±0.9 5.9±0.3 4.2±0.1

*means significant different between training and competition

The results showed lower VO2max than elite players. Therefore, to monitor the phenomena of physiological characteristics to improve the efficiency in the sport science, there was no difference at the VO2max in the training period between post-exercise 60 minute and rest (4.3±0.1 vs. 3.9±0.3 bpm, p>.05). There was no difference at the VO2max in the competition period between post-exercise 60 minute and rest (4.2±0.1 vs. 3.8±0.4 ml/kg/min, p>.05). The result showed similarly between post-exercise 60 minute and rest in the training and competition period , but need more time to recovery in the rest period.

Zen-Pin Figure 2

Figure 3-2 Oxygen consumption comparisons between training and competition

2. The result of blood lactic acid measurement. There was difference at the BLA on the competition period higher than training period (7.0±1.3 vs. 6.3±1.2 mmol/l, p<.05)(Table 3-3)(Figure 3-3). Heller et al (1998) reported that in male and female international TKD competitions, peak blood lactate after 143 seconds could reach the highest, 11.4 mmol/l. The change in the blood lactate has a close relationship with the TKD competition intensity and competition performance (Hultman & Sahlin, 1980). The result showed lowered blood lactic acid than others to improve the intensive training to the player between training and competition period. Hetzler et al (1989) pointed out that excellent martial players should have the characteristics of very good physical ability, high speed and great strength, blood lactate ranging from 1.51-3.23 mol/100 ml, and blood pH value decreasing from 7.39 to 7.34 mg/dl. TKD players not only must have anaerobic metabolism with greater explosive power, but also have very good aerobic endurance; therefore, TKD athletes must have very good anaerobic ability and demand for higher aerobic metabolism capacity (Ho, 1997).

Table 3-3 Blood lactic Acid comparisons between training and competition n=10 (unit: mmol/l)

Rest post-5 p-30 p-60
Training 0.8±0.0 6.3±1.2 3.6±1.1 1.2±0.2
Competition 0.8±0.0 7.0±1.3 * 3.3±0.7 0.9±0.1

* means significant different between training and competition

Jack & David (1999) found that the resting blood lactate are 1.0 mmo/l、1.0 mmol/l、1.0mmol/l respectively for ordinary athletes, and international athletes before and after exercise; maximum blood lactate are 7.5、8.5、9.0 mmo/l respectively.

Ho., Chiang & Tsai(1998) found that in 1998 Asia Games, having 4 TKD athletes participate in the winning competition in the training team, the results showed that their maximum blood lactate was 6.74 mmol/l, and BUN tended to increase gradually after competition. From these results, we know although the time of TKD games is short, it may cause the damage in muscle fiber. To excellent athletes, if the quality and quantity of training intensity, cardio respiratory function, energy consumption, and blood lactate system during training can be well controlled, furthermore to well control their body weight and physical ability, the athletes can elaborate their potential and maintain peak performance. It is very important to coaches and athletes (Hiroyuki et al., 1999).

Zen-Pin Figure 3

Figure 3-3. Blood lactic Acid comparisons between training and competition

3. The result of URO There was no difference at the URO between training and competition period (92.0±91.1 vs. 195.0±158.4 mg/dl ,p>.05).(Table3-4)(Figure3-4). Urine biochemistry tests can be the evaluation index of nutrition assessment and test exercise intensity (Robert & David, 1993). There was no difference at the URO in the training period between post-exercise 60 minute and rest (36.5±37.2 vs. 15.8±10.4 mg/dl, p>.05).There was no difference at the URO in the training period between post-exercise 60 minute and rest (43.5±35.5 vs. 25.0±12.6 mg/dl , p>.05). The greater the fatigue, the greater the negative training aftereffects such as low rate of recovery, decreased coordination, and diminished power output (Bampa,1999). Related to this study, probably 10-week peak phase of training over-exhausts the physical function and elevates urine protein level that will take longer to recover. Lin(1996)discussed that the factors affecting exercise urine protein included: 1.urine protein and physical function.2.quantity and intensity of training.3.age and environments.4.the effect of emotion on urine protein.

Table 3-4 URO comparisons between training and competition n=10(unit:mg/dl)

Rest post-5 p-30 p-60\
Training 15.8±10.4 92.0±91.1 105.0±126.1 36.5±37.2
Competition 25.0±12.6 195.0±158.4 120.0±73.3 43.5±35.5

* means significant different between training and competition

This finding can be an objective reference factor for contestants in the training and competition. It is possible that nine weeks of training may increase the urine protein level. Urine protein and exercise intensity have strong relationship. Competitive games and high intensity training make urine protein increase. The stronger the exercise intensity, the more the urine protein.

Zen-Pin Figure 4

Figure 3-3 URO comparisons between training and competition

4.The difference of PO(power output) There was difference at the power out at competition period greater than training period (232.7±14.5 vs. 226.5±14.7 watt ,p<.05) (Table3-4) (Figure3-4). It could be training for 10th week to promotion the muscle of power output. Zabukovec & Tiidus (1995) investigated professional male middleweight (73-77 kg) and welterweight (63-67 kg) kickboxers. The results showed relatively anaerobic capacities (8.2-11.2 Watt/Kg) than previously reported for many other power or combat athletes. The results showed lower than Kickboxers’ anaerobic capacities. Hoffman & Kang (2002) investigated a major concern of many of these studies focused on the applicability of a cycle ergo meter test for anaerobic power in athletes that perform primarily sprinting activities. To find the peak power of the football, basketball, wrestlers, male physical education students were 16.8±5.2 w/kg, 21.8±5.0, 18.5±2.7, 18.8±5.6 W/kg. Female group of the soccer and physical education students in peak power is 15.7±4.2 and 12.9±3.0 W/kg. However, the results showed lowered power output than others to improve the athlete’s muscle power to promote the physical state.

Bompa (1999) investigated strength training has become widely accepted as a determinant element in athletic performance. Thus, the main objective of the conversion phase is to synthesize those physiological foundations for advancements in athletic performance during the competitive phase. The determining factors in success of the conversion phase are its duration and the specific methods used to transform M*S gain into sport-specific strength.The power value measured by the simple product of the applied force and the speed developed remains inferior to the real power performed by the subjects since the forces of friction and inertia are not taken into account (Arsac et al.,1996).Thus other factors, such as metabolic and structural properties of taekwon-do players’ muscles, should be considered.

Therefore, martial arts and boxers must be able to react quickly and powerfully to an opponent’s attack. Both aerobic and anaerobic energy is used during a bout. Reactive strength and agility are necessary to respond to an opponent’s strategy. Limiting factors: Power endurance P-E), reactive power, M-E (muscle endurance)medium or long(professional boxer (Bompa,1999).

Taekwon-do exercises the need for stronger power including speed and velocity. Power is the ability of the neuromuscular system to produce the greatest possible force in the shortest amount of time. Power is simply the product of muscle force (F) multiplied by the velocity (v) of movement: P=F*V for athletic purpose, any increase in power must be the result of improvements in either strength, speed, or a combination of the two (Bompa, 1999).

Table 3-4 Power Output comparisons between training and competition n=10 (unit: watt) ; average power: AP

Power Output
Training 226.5±14.7 *
Competition 232.7±14.5

*means significant different between training and competition

The advantage of explosive, high-velocity power training is that it “trains” the nervous system. Increase in performance can be based on neural changes the help the individual muscles achieve greater performance capability (Scale,1986). This is accomplished by shorting the time of motor unit recruitment, especially FT fibers, and increasing the tolerance of the motor neurons to increased innervations frequencies (Hakkinen, 1986; Hakkinen & Komi,1983). The other way, it’s important technology for the coach and player to improve the starting power because it is an essential and often determinant ability in sports where the initial speed of action dictates the final outcome (boxing, karate, fencing, the start in sprinting, or the beginning of an aggressive acceleration from standing in team sports). The athlete’s ability to recruit the highest possible number of FT fibers to start the motion explosively is the fundamental physiological characteristic necessary for successful performance (Bompa,1999).

Zen-Pin Figure 5

Figure 3-4 Power Output comparisons between training and competition

IV. Conclusion

  1. There was no difference of the cardiac respiratory functioning between training and competition period. The players can’t recovery quickly for sixty minutes.
  2. There was a difference at the BLA at the competition period higher than training period. To improve the intensive training to the player between training and competition period.
  3. There was no difference at the URO between the training and competition period in the post-exercise 60 minute and rest.

The competition period was greater than training at the power out, but less than elite athletes in the professional period. Athletes are constantly exposed to various types of training loads, some of which exceed their tolerance threshold. When athletes drive themselves beyond their physiological limits, they risk fatigue (Bompa,1999). Thus, to monitor the physiological characteristics between training and competition period. It’s benefit for the player and coach to manage the peak performance and avoid the over training. To recover quickly and keep a steady state is important for the coach and player.

Reference

  1. Arja, L.T.,& Uusitalo(2001).Overtraining-Making a Difficult Diagnosis
    and Implementing Targeted Treatment. The Physician and Sportmedicine,29(5),1-14.
  2. Bentley, D.J., Mcnaughton, L.R., Thompson, D.,& Batterham, A.M.(2001).
    Peak power, the lactate threshold, and time trail performance in cyclists.
    Medicine Science Sport Exercise. 33(12),2077-2081.
  3. Bompa, T.O.(1999). Periodization training for sport. Champaign,
    IL: Human Kinetics.
  4. Cooke, S.R., Patersen, S.R.,& Quinney ,H.A.(1997). The influence
    of maximal aerobic power on recovery of skeletal muscle following aerobic
    exercise. European Journal of Physiology, 75, 512-519.
  5. Drobnic, F., Nunez, M., Riera, J. et al.(1995). Profil de condition
    fisica del equipo national de Taekwon-Do. In 8th FIMS European Sports
    Medicine Congress
    . Granada, Spain.
  6. Guidetti, L., Musulin, A.,& Baldari, C.(2002). Physiological factors
    in middleweight boxing performance. Journal Sport Medicine Physical
    Fitness, 42,
    309-314.
  7. Hakkinen, K.(1986).Training and detraining adaptations in electromyography.
    Muscle fiber and force production characteristics of human leg extensor
    muscle with special reference to prolonged heavy resistance and explosive-type
    strength training. Studies in Sport, Physical Education and Health.
    20.
  8. Hakkinen, K.,& Komi, P.(1983).Electromyographic changes during strength
    training and detraining. Medicine and Science in Sports and Exercise.15,455-460.
  9. Heller, J., Peric, T., Dlouha, R. et al.(1998). Physiological profiles
    of male and female taekwon-do (ITF) black belts. Sports Science. 16:243-9.
  10. Hetzler, R. K., Knowlton, R. G., Brown D. D. et al.(1989). The effect
    of voluntary ventilation on acid-base responses to a Moo Duk Tkow form.
    Research Quality for Exercise and Sports. 60:77-80.
  11. Hiroyuki Imamura, Yoshitaka Yoshimura, Seiji Nishimura et al.(1999).Oxygen
    uptake, heart rate, and blood lactate response during and following karate
    training. Medicine and Science in Sport and Exercise. 31(2):342-346.
  12. Ho, C.F., Chiang, J.S.,& Tsai, M.J.(1998), The impact of Taekwon-Do
    on urine lactate, blood urine nitrogen and serum creatine kinase. The
    essay collection of 1998 International Junior College Coach Conference
    .
  13. Hong, S.L.(1997a), Research in physiologic biochemistry characteristics
    of Korean excellent TKD athletes. Beijing: Sports University College
    News
    , 20 (1), 22-27.
  14. Hong, S. L. (1997b). Physiological and biochemical characteristics of
    excellent Korean contestants of Taekwondo. The Academic Journal of
    Beijing Physical Education University, 20
    (1), 22-29.
  15. Hultman, E.,& Sahlin, K.(1980). Acid-base balance during exercise.
    Exercise and Medicine in Sport Science Reviews. 8,
    41-128.
  16. Jack, H.,W.,& David, L.C.(1999). Physiology of Sport and Exercise.
    Champaign, IL: Human Kinetics.
  17. Lin, G.Y.,& Kuo, Y.A.(2000), Maximum oxygen uptake, blood lactate
    and serum LDH activity of Taekwon-Do athletes before and after competition.
    China Sports Technology
    , 36 (1).
  18. Lin, W.(1996). Biochemistry assessment of Sports Burden. Guang-Dong
    Higher Education Publisher.
  19. McArdle, W.D., Katch, F.I.,& Katch, V.L.(2001). Exercise physiology:
    Energy, nutrition, and human performance
    (Fifth Edition). Baltimore,
    Maryland: Lippincott Williams & Wilkins.
  20. Melhim, A.F.(2001). Aerobic and anaerobic power responses to the practice
    of taekwon-do. British Journal of Sports Medicine. 35(4):231-234.
  21. Pieter, W., Taaffe, D.,& Heijmans, J.(1990). Heart rate response
    to Taekwon-Do forms and technique combinations. Journal of Sports Medicine
    and Physical Fitness. 30
    :97-102.
  22. Sale, D.(1986). Neural adaptation in strength and power training. Human
    Muscle Power
    . Champaign, IL: Human Kinetics.
  23. Shin, J.K.(1993). Train to be a champion. World Taekwon-Do Federation
    Magazine
    .47,63-66.
  24. Zabukovec, R.,& Tiidus, P.M.(1995). Physiological and anthropometrical
    profile of elite kick boxers. Journal of strength and conditioning
    research. 9
    (4).240-242.
2016-10-14T10:29:57-05:00March 5th, 2004|Contemporary Sports Issues, Sports Exercise Science, Sports Facilities, Sports Studies and Sports Psychology|Comments Off on The Study of Physiological Factors and Performance in Welterweight Taekwondo Athletes

Practical and Critical Legal Concerns for Sport Physicians and Athletic Trainers

Abstract

In order to help sport physicians and athletic trainers understand the
legal principles that may be applicable to injury treatment, the writers
examined the areas of liability that physicians and trainers may face
in their delivery of care. Major topics which were covered by this article
included: (1) informed consent and participation risks, (2) physician-patient
relationship, (3) immunity issues, and (4) risk management. In conclusion,
seven protective strategies were recommended for sport physicians and
athletic trainers to insure acceptable service standards. They were: (a)
maintaining a good physician-client relationship with athletes; (b) obtaining
informed consent and insist on a written contract; (c) educating the athletes,
parents and coaches concerning issues of drug abuse, assumption of risks,
confidentiality; (d) performing physical examinations carefully, and be
cautious on issuing medical clearance; (e) formulating a risk management
plan and properly document hazards and records; (f) participating in continuing
education and recognize your qualifications; and (g) maintaining insurance
coverage.

Introduction

The special legal duties and liabilities team physicians have are rapidly
developing areas of law (Collum, 2001). Since 1990, there has been a significant
increase in sports medicine related litigation (Gallup, 1995). The increasing
economic benefits of playing sports, such as college scholarships or multi-million
dollar professional contracts, have inspired injured athletes to seek
compensation for injuries resulting from negligent medical care (Herbert,
1991). As a result, today, many sport physicians and athletic trainers
recognize they need a general understanding of certain legal principles
in order to further protect themselves and their institutions from litigation
(Gieck, Lowe, & Kenna, 1984). Sport physicians and athletic trainers
must become familiar with the acts and policies that regulate the profession.
Physicians and trainers must realize that acquiring the basic knowledge
of legal principles can help improve their professional practice. In order
to help sport physicians and athletic trainers understand the legal principles
that may be applicable to injury treatments and prevention, the writers
examines several areas of liability physicians and trainers may face.
These areas include: (a) informed consent and participation risks, (b)
the physician-patient relationship, (c) immunity issues, and (d) risk
management.

Informed Consent and Participation Risks

A widely recognized legal principle is that the team physician must have
an athlete’s informed consent before providing any medical treatment
(Gallup, 1995; Ray, 2000; Mitten, 2002). Informed consent is a legal doctrine
that requires a sport physician to obtain consent for rendering treatment,
performing an operation, or using many diagnostic procedures after their
clients being furnished with all the known relevant facts (Gallup, 1995;
Briggs, 2001). This requirement is based on the principle of individual
autonomy, meaning a competent adult has the legal right to decide what
to do with his body (Heinemann, 1997).

Consent forms are especially important in the high school setting because
most of these injured student- athletes are minors. No lawsuit has been
successfully tried based on a lack of parental consent, where the treatment
of the minor was non-negligent (Gallup, 1995; Ray, 2000). Recently, many
courts have begun to follow the mature minor rule allowing the young person
(an age of 14-16) to validly consent to the physicians’ treatment
(Holder, 1978). Consent may be implied under the circumstances, such as
when an athlete has been rendered unconscious during play and needs emergency
medical treatment (Mitten, 2002; Hecht, 2002). In these cases, the law
generally assumes that if the injured athlete had been aware of his/her
condition and was mentally competent, then he/she would consent to the
treatment. Based on several experts’ comments (Rosoff, 1991; Gallup,
1995; Briggs, 2001; Mitten, 2002; Sports Medicine Digest, 2002), the authors
have summarized the key points in the consent, which should be disclosed
to athletes:

  1. Physicians and trainers must adhere to customary or accepted sports
    medicine practice in diagnosing athletes’ injuries.
  2. An athlete must understand the kind of treatment to which he is consenting.
  3. A physician must disclose relevant information since his/her failure
    to do so may subject him/her to liability for fraudulent concealment.
  4. Physicians and trainers should propose possible alternative treatments.
  5. Keep in mind that the clients have the “right of refusal.”
  6. Physicians and trainers should explain the cost of the proposed treatment.

It is difficult to judge how far a sport physician should go in determining
whether an athlete actually understand what he/she has consented to or
not. In the 1987 California case of Krueger v. San Francisco 49ers, the
49ers were found guilty of fraudulent concealment, because the team physicians
failed to inform Krueger about the full extent of his injuries, the potential
consequences of the anesthetic steroid injections, and the long-term implications
of playing professional football with a badly damaged knee. If a physician
wishes to avoid the liability of negligence or fraud, he/she must show
that approving athletic participation is not medically unreasonable and
the athlete actually understands the risks.

“Assumption of risk” is a legal defense that attempts to
claim that an injured plaintiff understood the risk of an activity and
freely chose to undertake the activity regardless of the hazards associated
with it (Ray, 2000). It is one of the most common defenses that educational
institutions, athletic trainers and sport physicians may employ to avoid
legal liability. Two conditions must be met in order to establish the
defense of “assumption of risk” (Scott, 1990). (a) The athlete
must fully appreciate and understand the type and magnitude of the risk
involved in participation. (b) The athlete must also “knowingly,
voluntarily, and unequivocally” choose to participate. In interscholastic
sport settings, school districts often use a consent form to prove an
implied assumption of risk. In some cases, courts also have found that
consent forms prove the minor and parents did understand the risks inherent
in the sport and agree to assume them (Vendrell v. School District No
26c Malheur County).

Today, athletes and their parents frequently challenge the return-to-play
decision of the sport physicians and demand their right to participate
(Ray, 2000). In this case, one approach sport physicians or athletic trainers
may take is to request athletes (and their parents in the case of minors)
to sign exculpatory waivers. An “exculpatory waiver” or “risk
release” is a contract signed by a participant, which relieves the
school, university, or team physician from any liability to the individual
who executes the release (Gallup, 1995). It acts as an “express
assumption of risk” indicating that the participant fully understands
and voluntarily chooses to encounter the risk. The participant further
agrees in advance not to hold the defendant liable for the consequences
of conduct that would ordinarily amount to negligence (Keeton, Dobbs,
Keeton, & Owen, 1987). Some courts uphold releases of liability from
future negligence, but not culpable conduct such as intentional, reckless,
or grossly negligent torts (Keeton et al, 1987; Cotten, 2001; Mitten,
2002). However, courts have also invalidated contracts releasing physicians
from liability for negligent medical care of their patient, because such
contracts violates public policy (Tunkl v. Regents of University of California,
1963; Ray, 2000). In general, a waiver signed by the minor alone will
not be enforced (Cotten, 2001). Even if an exculpatory waiver is established,
the court may evaluate its validity individually.

In general, if an injured athlete is found to be contributory negligent,
he/she may not be able to successfully sue a team physician or an athletic
trainer (Hebert, 2002; Gallup, 1995). In the past, plaintiffs might lose
the case due to their contributory negligence, because the court’s
decision was determined on an “all or nothing” basis (Hoffman
v. Jones, 1973). However, this type of ruling is not a dominant trend
anymore. In Perez v. McConkey, a plaintiff’s contributory negligence
no longer was a “complete bar to recovery”; rather, it was
to be considered in “apportioning damages only” (Wanat, 2001).
Today, the courts often use the doctrine of comparative negligence to
determine if the liability should be divided between the plaintiff and
the defendant(s) (Ray, 2000; Gallup, 1995). In most states, plaintiffs
can collect damages only if their comparative culpability is less than
50% (Ray, 2000). Physicians and trainers may compensate their patients
in proportion to their fault.

Physician-patient Relationship

When a university or a professional sports team hires the team physicians,
a duty is created not only between the physicians and the athletes, but
also to the hiring entity. Although the well-being of athletes should
be the most important concern of physicians and trainers who render medical
service, it is not always easy for physicians and trainers to make their
decisions based on this principle due to the intense pressure from the
coaches, management, the press, and even the motivated athletes themselves.
In general, if physicians who are hired by professional teams act in a
negligent manner and cause their patients (athletes) to lose a contract,
scholarship, or future earnings, they may ultimately be found liable for
those damages (Gallup, 1995). Under the doctrine of “vicarious liability”,
a university or professional team may also be liable for the actions of
the team physician who it hired (Berry & Wong, 1986). However, if
the physician is an independent contractor, the entity may not be held
liable for the physician’s negligence (Cramer v. Hoffman, 1968).
The key factor to determine whether the physician is an independent contractor
or not is relying on the amount of control the hiring entity exercises
over the independent judgment of physician (Berry & Wong, 1986).

The issue of confidentiality is often a complicated problem in professional
and collegiate sports. Releasing an athlete’s medical condition
to third parties (i.e., media) violates a physician’s ethical obligation
to maintain confidentiality (Mitten, 2002). However, it may seem appropriate
for physicians or trainers to discuss athletes’ condition with the
management of collegiate or professional teams, because they have the
access to athletes’ medical records anyway (Berry & Wong, 1986).
Collegiate and professional physicians and trainers must remember that
they owe athletes confidentiality, and should be careful about releasing
information to the press. In Chuy v. Philadelphia Eagles Football Club
(1979), the defendant, Chuy, sought the compensation from the Philadelphia
Eagles because the team physician released his medical condition to the
press without his consent. Based on the impact of this case, it is ideal
for the physician to obtain the athlete’s permission (a publicity
waiver form) before disclosing any medical information to team officials
or press. An essential act that physicians must apply is informing the
athletes that they are acting on behalf of the team (Mitten, 2002). Readers
may refer to the Health Insurance Portability and Accountability Act from
official website of the Department of United States Health and Human Services
(2003) for more information concerning standards for protecting the privacy
of personal health information.

Immunity Issues

In some instances, physicians may be immune from legal liability for
malpractice claims brought by athletes (Mitten, 1995). Several states
have enacted legal statutes immunizing volunteer sport physicians from
negligence liability for rendering emergency medical care to athletes
(Mitten, 2002). In addition, some states have expended their Good Samaritan
laws to specify immunity for those who provide medical services at athletic
events (Gallup, 1995; Todaro, 1986). However, statutory immunity only
covered physicians or trainers who provide emergency care to an athlete
with an apparent life-threatening condition in good faith, not with wanton
emergency treatment or gross negligence (Todaro, 1986).

As shown in the case of Sorey v. Kellett (1988), it was found that sport
physicians employed by public universities might be protected by state
law immunity. Furthermore, state workers’ compensation laws may
also bar claims of professional athletes against team physicians for negligent
medical care (Mitten, 2002; Gallup, 1995). Other than the Good Samaritan
laws, the workers’ compensation laws are other legal statues that
preclude professional athletes suing team physicians or trainers for negligence.
In Hendy v. Losse (1991), the court interpreted that workers’ compensation
law bar tort suits between co-employees for injuries caused within the
scope of employment. One must keeps in mind that workers’ compensation
laws are not uniform, and may vary from state to state (Gallup, 1995).

Risk management

Risk management is the key for preventing lawsuits in sports medicine.
As sport physicians and athletic trainers have involved more managerial
responsibilities along with their clinical duties, the broader construct
of risk management became more important. Risk management is a process
intended to prevent financial, physical, property, and time loss for an
organization (Culp, Goemaere, & Miller, 1985; Ray, 2000; Streator
& Buckley, 2001). According to Gallup (1995), a well-designed risk
management program should cover four essential elements; compassion, communication,
competence and charting. Sports physicians and athletic trainers must
demonstrate a deep concern for athletes and build a good rapport with
athletes. Maintaining clinical competence and keeping accurate medical
records are other important means to avoid liability for malpractice.
In fact, studies show that 70% of the medical litigations are due to poor
communication and attitude problems presented by physicians or trainers
(Gallup, 1995).

To apply appropriate techniques and management principles for reducing
the likelihood of risk, the Department of Sport and Recreation of Australia
(2003) provided some guidelines for handling the potential risks. Those
guidelines included: (a) establishing the context of a risk management
program (objectives, resources, and assessment criteria, etc.), (b) risk
identification, (c) risk assessment, (d) treatment and control, and (e)
monitoring and review. While applying the above principles in the sport
medicine field, Rankin and Ingersoll’s (1995) recommendation can
further help to control risk. In terms of risk identification and assessment,
physicians and trainers can administer pre-participation physical exams,
monitor fitness levels, assess activity areas, monitor environmental conditions,
maintain equipment, use proper instructional techniques, and provide adequate
work-rest intervals. Advice for treatment and control include: (a) have
a physician supervise all medical aspects of the program; (b) evaluate
and treat injuries correctly and promptly; and (c) supervise student athletic
trainers or intern physicians.

Effective documentation is vital for sport physicians and athletic trainers
because 35% to 40% of all medical malpractice suits are rendered indefensible
by problems with the medical record (Michigan Medicine, 1983). Sport physicians
should record their activities for the following reasons (Ray, 2000; Briggs,
2001; Streator & Buckley, 2001): (a) personal use; especially for
personal protection in the event of litigation; (b) legal, ethical and
professional requirements; (c) statistical records; (d) educational, research
and insurance purposes; (e) information for further planning, treatment,
rehabilitation and training; (f) aids for assisting other practitioners
taking over/involved in treatment (i.e. a multidisciplinary approach);
and (g) information for techniques and standards involved in treatment/rehabilitation.

In general, sport physicians and athletic trainers should file two types
of records properly, medical records and program administration records
(Ray, 2000). Medical records are cumulative documentation of a patient’s
medical history and health care interventions. The administration records
may include physical examination forms, injury evaluation and treatment
forms, reports of special procedures, emergency information, permission
for medical treatment forms, release of medical information, insurance
information and communication from other professionals (Ray, 2000; Streator
& Buckley, 2001).

Conclusion

The authors examined the variety, complexity, and importance of legal
issues, which sport physicians and athletic trainers may encounter. Many
of the legal outcomes are strongly influenced by advances in medicine,
medical evidence, and reviews of legal precedents (Gallup, 1995; Opie,
2002). The authors attempted to synthesize opinions of experts and information
derived from some lawsuits to propose practical guidelines for the physicians
and trainers. As Ray (2000) mentioned, the best legal defense against
malpractice lawsuits is still to provide high-quality medical services
consistent with the standard of care. The concepts and suggestions, which
were illustrated in this article, might not be interpreted as absolute
legal principles; rather, they should be treated as aids to help physicians
and trainers prevent negligence lawsuits. The following protective strategies
were suggested to insure the acceptable service standard (Graham, 1985;
Ray, 2000; Gallup; Opie, 2002; Mitten, 2002).

  1. Maintain a good physician-client relationship with athletes.
  2. Obtain informed consent and insist on a written contract.
  3. Educate the athletes, parents and coaches concerning issues of drug
    abuse, assumption of risks, confidentiality.
  4. Perform physical examinations carefully, and be cautious on issuing
    medical clearances.
  5. Formulate a risk management plan and properly document hazards and
    records.
  6. Participate in continuing education and recognize your qualifications.
  7. Maintain insurance coverage.

References

  1. Berry, R., & Wong, G. (1986). Application of legal principles
    to persons involved in Sports. In R. Berry & G. Wong, Law and
    business of the sports industries: Common issues in amateur and professional
    sports
    (2nd ed.) (p. 303). Westport, CT: Greenwood Press.
  2. Briggs, J. (2001). Legal, professional ethical, moral and practice
    management issues. In J. Briggs (Eds.), Sports therapy: theoretical
    and practical thoughts and Considerations
    (pp. 299-320). Chichester,
    England: Corpus Publishing Limited.
  3. Chuy v. Philadelphia Eagles Football Club, 595 F.2d 1265 3rd
    Cir
  4. Collum, J. (2001). Legal developments regarding injuries related to
    participation in and/or affiliation with athletic events. Sports,
    Parks and Recreation Law reporter, 14
    (4), 56-58.
  5. Cotten, D. J. (2001). An update on the validity of waivers when the
    injured party is a Minor. Sports, Parks and Recreation Law Reporter,
    15
    (3), 44-47.
  6. Cramer v. Hoffman, 390 F. 2d 19 (2nd Cir. 1968).
  7. Culp, B., Goemaere, N.D., & Miller E. (1985). Risk management:
    An integral part of Quality assurance. In C. G. Meisenheimer, Quality
    assurance: A complete guide to effective programs
    (pp. 169-192).
    Rockville, Maryland: Aspen.
  8. Department of Sport and Recreation, Government of Western Australia
    (2003). Risk Management kit. Retrieved August 8, 2003, from http://www.surfcam.dsr.wa.gov.
    au/organizations/risk.asp
  9. Department of United States Health and Human Services (2003). Medical
    privacy – National Standards to protect the privacy of personal health
    information. Retrieved February 22, 2004, from http://www.os.dhhs.gov/ocr/hipaa/finalreg.html
  10. Gallup, E. M. (1995) Law and the team physician. Champaign,
    IL: Human Kinetics.
  11. Gieck, J., Lowe, J. & & Kenna, K. (1984). Trainer malpractice:
    A sleeping giant. Athletic Training, 19(1), 41-46.
  12. Graham, L. S. (1985). Ten ways to dodge the malpractice bullet. Athletic
    Training, 29
    (2), 117-119.
  13. Herbert, D. L. (2002). Professional hockey player sues team and team
    doctor. Sport Medicine Alert, 8(6), 42-43.
  14. Herbert, D. L. (1991). The death of Hank Gathers: An examination of
    the legal issues. Sports Medicine Standards and Malpractice Reporter,
    2
    (3), 41-46.
  15. Hecht, A. N. (2002). Legal and ethical aspects of sports-related concussions:
    the Merril Hoge story. Seton Hall Journal of Sport Law, 12(1),
    17-64.
  16. Heinemann, R. A. (1997). Pushing the limits of informed consent: Johnson
    v. Kokemoor and physician-specific disclosure. Wisconsin Law Review,
    5
    , 1079-1081.
  17. Hendy v. Losse, 54 Cal.3d 723, 734.
  18. Hoffman v. Jones 280 So. 2d 431, 437 (Fla. 1973).
  19. Holder, A. R. (1978). Minors’ rights to consent to medical care. Journal
    of American Medical Association, 257
    (24), 3402.
  20. Keeton, W., Dobbs,, D., Keeton, R. & Owen, D. (1987). Prosser
    and Keeton on the law of torts
    (5th ed.). St. Paul: West.
  21. Krueger v. San Francisco 49ers et al., 234 California Reporter at
    584.
  22. Michigan Medicine. (1983). Good records can be strongest malpractice
    defense. Michigan Medicine, 6-8.
  23. Mitten, M. J. (2002). Emerging legal issues in sports medicine: A
    synthesis, summary, and analysis. St. John’s Law Review, 76(5),
    7-86.
  24. Mitten, M. J. (1995). Medical malpractice liability of sports medicine
    care providers for injury to, or death of athlete. Alabama Law Review,
    33
    (5), 619.
  25. Opie, H. (2002). Australian medico-legal issues in sport: The view
    from the grandstand. Marquette Sports Law Review, 13(1), 113-148.
  26. Ray, R. (2000). Management strategies in athletic training
    (2nd ed.). Champaign, Illinois: Human Kinetics.
  27. Rankin J. M., & Ingersoll, C. (1995). Athletic training management:
    Concepts and applications
    . St. Louis: Mosby.
  28. Rosoff, A. A. (1991). Treatise of health care law section 17.01(1).
    In M.G. MacDonald, R.M. Kaufman, & A.M. Capron (Eds.), Consent
    to medical treatment
    . New York: Mathew Bender.
  29. Scott, R. W. (1990). Health care malpractice. Thorofare, NJ:
    Slack.
  30. Sorey v. Kellett, 849 F.2d 960, 962 (5th Cir. 1988).
  31. Sports Medicine Digest. (2002). Withholding relevant information may
    be fraudulent. Sports Medicine Digest, 24(1), 3.
  32. Streator, S., & Buckley, W. E. (2001). Risk management in athletic
    training. Athletic Therapy Today, 6(2), 55-59.
  33. Todaro, G. T. (1986). The volunteer team physician: When are you exempt
    from civil liability? The Physician & Sportsmedicine, 16(7),
    147; 150.
  34. Tunkl v. Regents of University of California, 60 Cal.2d 92, 383 P.2d
    441
  35. Venderll v. School District No 26c Malheur Country, 233 Oregon. 1,
    376 p. 2d at 409.
  36. Wanat, D. E. (2001). Torts and sporting events: Spectator and participant
    injuries-using defendant’s duty to limit liability as an alternative
    to the defense of primary implied assumption of the risk. University
    of Memphis Law Review, 31
    (2), 237-279.
2016-10-12T14:43:37-05:00March 4th, 2004|Contemporary Sports Issues, Sports Coaching, Sports Exercise Science, Sports Facilities, Sports Management, Sports Studies and Sports Psychology|Comments Off on Practical and Critical Legal Concerns for Sport Physicians and Athletic Trainers
Go to Top