The Effects of the Speed Function on Some Technical Elements in Soccer

Abstract

The purpose of this study was to examine the effects of the speed function on some technical elements (dribbling, slalom and agility) in soccer, and to determine the effect ratio of these elements on one another. Some information regarding the purpose of this research is given by means of literature review. The subjects of the study, 177 soccer players selected from the 1st, 2nd, and 3rd League, amateur and two youth teams in Ankara, Turkey, has undergone a performance test including one each of a sprint 0-15-30 m, slalom 0-15-30 m, and dribbling 0-15-30 m, and an agility test. Sprint, slalom and dribbling tests were applied twice, with the players resting between each trial. Finally, the agility test was performed. The reliabilities of the tests (Sprint = .74; Slalom = .61; Dribbling = .76; Agility = .81) were determined for the players (n=40). The performance values of the subjects examined showed that while speed function does affect the agility competency, it had no effect on slalom and dribbling competency. The other findings showed that slalom and dribbling competencies affect each other positively.

Introduction

In soccer, in addition to mental, psychological, physiological and coordinational features, the improvement of conditional features is important as well. Peak conditional features in soccer players provide an advantage. Much of what affects the results of a match occurs during or after the high intensity sprint. Analysis of the specific movements and activities performed by football players during games can provide much relevant information on which suitable training programs can be designed (Dawson, 2003).

Success in soccer is dependent upon a variety of factors including the physical characteristics and physiological capacities of the players, their level of skill, their degree of motivation, and tactics employed by them against the opposition. Some of these factors are not easily measured objectively, but others can be tested using standardized methods and can provide useful information for coaches (Mosher, 1985).

In soccer, speed plays an important role; the accelerated pace of the game calls for rapid execution of typical movements by every member in a team. In many instances, successful implementation of certain technical or tactical maneuvers by different team members is directly related with the degree of velocity deployed (Kollath & Quade, 1991).

According to the Dawson study (2003), the large majority of sprints performed in soccer take six seconds or less to complete, over distances of only 10-30 meters, and many of the sprints involve at least one change of direction.

As running speed increases, longer strides are taken. In this instance, the swing phase involves greater knee flexion and hip extension, and greater hip flexion in the latter part of the phase (Howe, 1996).

During soccer games, many actions affect the result of games. These actions are characterized by intermittent and multi-directional movements, as well as the movements of changing intensity and time.

Reilly and Ball (1984) stated that each game typically involves about 1000 changes of activity by each individual in the course of play, and each change requires abrupt acceleration or deceleration of the body or an alteration in the direction of motion.

Specific physical and physiological characteristics of soccer players can be used by coaches to modify training programs and to help players prepare for the game strategy. The modern soccer relies on the ability of all players to attack and defend whenever necessary. Therefore, it is important that all players achieve a high level of performance in the basic skills of kicking, passing, trapping, dribbling, tackling and heading. Analysis of the physical and physiological characteristics of the players and determination of the specific requirements for optimal performance are thus a necessity (Tiryaki et al., 1996).

Technique refers to the relationship and harmony a player demonstrates with the ball and describes the performance of a solitary action in isolation from the game, e.g. pass or dribbling (Bate, 1996).

Dribbling a ball was chosen in this study as this represents one of the most exciting aspects of the game for spectators, and a great deal of time is devoted in training to its practice (Reilly & Thomas, 1979).

When running with a ball, much shorter strides are taken as the player must be ready to change direction and speed. At the toe-off phase, the leg may not be as extended heel stride may not be as pronounced, rather the foot may land in a more neutral position or be plantarflexed (Howe, 1996).

It is known that players with sprint skills have advantage over other players. However, the degree of effect has not been determined. In this study, we wanted to determine the degree of effect of sprint on technical elements. In other words, the purpose of this study was to examine the effects of the speed function on some technical elements in soccer, and to determine the effect ratio of these elements on one another. Thus, soccer-training programs could specify and propose the degree, frequency, intensity and volume of sprint and technical elements.

Methodology

Participants

This investigation was performed during the 1999-2000 season and included players from different league group teams competing in Ankara, Turkey (177 soccer players selected from 1st, 2nd, 3rd League, amateur and two youth teams). All subjects were informed about the purpose of the study and of its voluntary nature, and all provided their consent to participate. The study involved analyses of performance of these players. We examined the literature for related investigations.

Apparatus and Task

To establish reliability, the tests were applied to 40 players in ‘on season’ and ‘off season’. Paired sample t – test statistical tests were used. The reliability values were determined as follows:

According to match analysis, in match situation maximum sprint distance is approximately 20 – 30 m. However, the soccer players run about 100 sprints in the match (Kelly et al., 1982).

The subjects ran 30 m to measure their sprint performance. Crossing values (15 m and 30 m) were recorded by photocell (sprint 0 – 15; = .67 ; sprint 0 – 30; =.74).

The subjects ran between nine slalom sticks located 1.5 m apart. With photocell, 15 m and 30 m crossing values were recorded. Slalom – dribbling tests established by Kunts were applied (1991). Van Rossum practiced the test over 15 m, and reliability was determined as approximately .51. In this investigation, we determined reliability for slalom 0 -15 m as = .53; and for slalom 0 -30 m as = .61. The subjects dribbled the ball between the nine slalom sticks located 1.5 apart. With photocell, 15 m and 30 m crossing values were recorded, and reliability for dribbling 0 -15 m was determined as = .68; and for dribbling 0 -30 m, = .76.

“Agility refers to the capability to change the direction of the body abruptly. The ability to turn quickly, dodge and sidestep calls for good motor coordination and is reflected in a standardized agility run test.” (Reilly, 1996). Agility tests comprise different directional movements with changes between 35 m and 142 m in area (Haywood, 1986). Wilmore (1992) has defined agility as the ability to change movement direction, and it constitutes conjunction of sprint, strength, stability and coordination factors.

The agility test used was that developed by Lindquist and Bangsbo (1994), and its formation and dimension included the football penalty area. The reliability was found as .81 (n=20). We conformed to the elements of this agility test, in which the athletes ran as fast as possible through the tests with this sequence: sprint (40 m), back sprint (8.25 m), sprint (8.25 m), sprint (8 m), slalom (70 m), sprint (8 m), side sprint (8.25 m), side sprint – opposite direction (8.25 m).

Testing Procedure

The tests included one each sprint 0-15-30 m, slalom 0-15-30 m, and dribbling 0-15-30 m, followed by the agility test. Sprint, slalom and dribbling tests were applied twice, with the players resting between trials. Finally, the agility test was performed. Descriptive statistics of the subjects are presented in Table 1.

Data Analysis

The acquired data was transferred to the computer and evaluated with SPSS (Statistical Package for Social Sciences). The descriptive statistics (f, %) and Pearson Moments Multiple Correlation and Paired sample t-test statistical tests were used. Significance level was determined at .05.

Results

All participants completed the test procedure. Results attained from the subjects were classified according to the mean, standard deviation, minimum, maximum and range, and are presented in Table 2.

Correlations between sprint, slalom, and dribbling were tested with bi-variate Pearson Moments Multiple Correlation, and results are given in Table 3. As can be seen, statistically significant positive (p.05) correlation was determined between the following: agility and sprint 15; agility and sprint 30; dribbling 15 and dribbling 30; slalom 15 and slalom 30; sprint 15 and sprint 30; dribbling 15 and slalom 15; dribbling 30 and slalom 15; dribbling 30 and slalom 30; and dribbling 15 and slalom 30.

Apart from the above, other relation among the variables was statistically insignificant. No statistically significant relation was determined between sprint and dribbling and slalom values, but there was a positive correlation between slalom and dribbling.

Discussion

We determined participants’ mean age as 23.72 3.4 years, mean height 179 6.5 cm, mean weight 72.4 6.7 kg, and mean training years as 8.5 3.4 years. In this study 0-15 m sprint value was approximately 2.25 sec, 15-30 m 1.85 sec and 0-30 m 4.14 sec. Winkler (1991) reported 0-15 m sprint value as approximately 2.43 sec, 15-30 m as 1.71 sec, and 0-30 m as 4.14 sec. These findings support our study.

In subjects with good sprint values, agility values were significantly more meaningful (r = .49) (P < .05). Although according to Balsom (1994), soccer players who have good sprint ability cannot also be skilled in agility. In this study, players having good sprint values also had significantly more meaningful agility values. Similar results were also found in the study done by Herm (1993). He found that there was a correlation between 30 m sprint value and agility (r =.65), and this data support our findings.

According to the Little & Williams study (2003), there is a significant correlation between maximum speed and agility ( r = 0.34 p< 0.05). There is a notion that maximum speed and agility are distinctly specific attributes. The specificity may be attributable to differences in the musculature utilized strength qualities required and complexity or of motor control, between the different speed components.

To find the relationships between dribbling and slalom, one study was conducted by Van Rossum and Wijbenga (1991). According to the statistical analysis, correlation value was found (r=.59). In this investigation, a statistically meaningful relationship (r=.55) was determined between dribbling and slalom. High perception skills are needed in slalom and dribbling skills; however, perception does not affect sprint and agility skills. The participants who did well in the slalom test also performed well in dribbling tests. This high correlation between slalom and dribbling can be explained by the similarity among step frequencies, movement and dynamic changes, and specific and compulsive concentration.

No significantly meaningful relation was found between sprint and dribbling and slalom values. According to the definitions of sprint and dribbling elements (Howe, 1996), it is seen that while the anatomical movements resemble each other, angle and velocity of the extremities differ. We assume this is why speed had no affect on dribbling.

According to the study, it is seen that performance of acyclic speed and dribbling are affected by performance of cyclic speed run. In soccer, the importance of cyclic running has decelerated because of changes in the structure of play. Because action is limited to a narrow field, acyclic speed and dribbling can be more important in taking opponents out of play and gaining an advantage. It is suggested that speed drills should be formatted with both acyclic and different dribbling, which more directly supports the necessary qualities of modern soccer.

References

  1. Balsom, P. (1994). Sprint performance in soccer. Science and Football, III, (pp. 16-19). London: E & FN Spon.
  2. Bate, D. (1996). Soccer skills practice. In T. Reilly (Ed.), Science and Soccer (p. 228). London: E & FN Spon.
  3. Dawson, B. (2003). Speed, agility and quickness in football. World Congress on Science and Football-5: Book of abstracts. Lisbon: Faculty of Human Kinetics, Technical University of Lisbon.
  4. Haywood, K. M. (1986). Life span, motor development. Illinois: Human Kinetics Publishers.
  5. Herm, K. P. (1993). The evidence of sport anthropology in training of young soccer players. In T. Reilly, J. Clarrys, & A. Stibbe (Eds.), Science and football II. London: E & FN Spon.
  6. Howe, T. (1996). Functional anatomy. In T. Reilly (Ed.), Science and soccer (p. 20). London: E & FN Spon
  7. Kelly, L., Mariric, Z., Wasilewski, S., & Withers, R. T. (1982). Match analysis of Australian professional soccer players. Journal of Human Movement Studies, 8, 159-176.
  8. Kolath, E., & Quade, K. (1993). Measurement of sprinting speed of professional and amateur soccer players. In T. Reilly, J. Clarrys, & A. Stibbe (Eds.), Science and football II (pp. 1-36). London: E & FN Spon.
  9. Kunts, R., & Van Rossum, J.H.A. (1991). The usage of skills tests by trainers of youth teams: Tests of physical fitness and technique. In T. Reilly, J. Clarrys, & A. Stibbe (Eds.), Science and football II (pp. 319-323). London: E & FN Spon.
  10. Lindquist, F., & Bangbo J. (1991). Do young soccer players need specific physical training. In T. Reilly, J. Clarrys, & A. Stibbe (Eds.), Science and football II. London E & FN Spon.
  11. Mosher, R. E. (1985). Interval training: The effects of 12-week programme on elite, prepubertal male soccer players. Journal of Sports Medicine and Physical Fitness, 25, 84-86.
  12. Reilly, T. (1996). Fitness assessment. In T. Reilly (Eds.), Science and soccer (pp. 42-43). London: E & FN Spon.
  13. Reilly, T., & Ball, D. (1984). The net physiological cost of dribbling a soccer ball. Research Quarterly for Exercise and Sport, 55, 267-271.
  14. Reilly, T., & Thomas, V. (1979). Estimated daily energy expenditures of professional association footballers. Ergonomics, 22, 541-548.
  15. Tiryaki, G., Tuncel, F., Yamaner, F., Agaoglu, S. A., Gmsdag, H., & Acar, M. F. (1996). Comparison of the physiological characteristics of the first, second and third league Turkish soccer players. In T.Reilly (Eds.), Science and Football III (p. 32). London: E & FN Spon.
  16. Wilmore, J. H. (1992). Training for sport and activity: The physiological basis of the conditioning process. Boston: Allyn and Bacon.
  17. Winkler, W. (1991). Computer-controlled assessment and video – Technology for the diagnosis of a player’s performance in soccer training. In T. Reilly, J. Clarrys, & A. Stibbe (Eds.), Science and football II (pp. 73-80). London: E & FN Spon

Appendices

Table 1. Height, Weight and Training Years of the Football Players

Variable ( n = 177 )Height (cm)Weight (kg)Training (year) Mean (sec.)1.7972.48.55 SD (sec.).066.753.40 Min. (sec.)1.6560.01.0 Max. (sec.)1.9892.020.0 Range (sec.).3332.019.0

Table 2. Agility, Sprint, Slalom and Dribbling Results,

Variables ( n = 177 )AgilitySprint 0-15Sprint 15-30

Sprint 0-30

Slalom 0-15

Slalom 15-30

Slalom 0-30

Dribbling 0-15

Dribbling 15-30

Dribbling 0-30

Mean (sec.)41.902.251.85

4.14

4.48

4.92

8.88

7.59

7.72

15.31

SD (sec.)2.93.12.09

.17

.56

.89

1.31

.78

.72

1.17

Min. (sec.)35.871.981.67

3.72

3.13

3.51

7.06

6.07

6.15

13.04

Max. (sec.)51.862.502.11

4.94

6.28

6.76

12.92

9.69

9.90

17.98

Range (sec.)15.99.52.44

1.22

3.15

3.25

5.86

3.62

3.75

4.94

Table 3. Correlation Results

Agility Dribbling15 Dribbling30 Slalom15 Slalom30 Sprint15 Sprint30
Agility ———– .33p.117 .35p.107 .36p.105 .35p.107 .45*p.019 .49p.011
Dribbling15 .33p,117 ———– .67*p.000 .53*p.000 .45*p.019 .31p.119 .29p.201
Dribbling30 .35p.107 .67*p.000 ———– .51*p.001 .55*p.000 .26p.227 .35p.107
Slalom15 .36p,105 .53*p.000 .51*p.001 ———- .84*p.000 .33p.117 .26p.227
Slalom30 .35p.107 .45*p.019 .55*p.000 .84*p.000 ———– .29p.201 .34p.112
Sprint15 .45*p.019 .31p.119 .26p.227 .33p.117 .29p.201 ———– .74*p.000
Sprint30 .49*p.011 .29p.201 .35p.107 .26p.227 .34p.112 .74*p.000 ———-

*(P< .05)

2016-04-01T09:49:40-05:00June 8th, 2005|Contemporary Sports Issues, Sports Coaching, Sports Exercise Science, Sports Studies and Sports Psychology|Comments Off on The Effects of the Speed Function on Some Technical Elements in Soccer

Outdoor Recreation Participation: An Application of the Theory of Planned Behavior

Summary

Behavioral factors were investigated in a real outdoor setting, in order to explain one’s intention and actual behavior of participating in outdoor recreational programs. This paper used an extended model of the Theory of Planned Behavior, with the addition of the self-identity variable, aiming to predict intention to participate and then actual participation in a specific outdoor recreation program including activities like: lake canoe/kayaking, orienteering, and archery. Three hundred and twenty-nine adult individuals participated in the study. Manifold correlations existed between all the variables of the study. The results also indicated that perceived behavioral control, role identity, and attitudes toward participation significantly predicted individuals’ intention to participate in the specific outdoor recreation program (R = .597; p < .001). Furthermore, intention toward participation was a significant predictor of the actual behavior (R = .390; p < .001). These findings are discussed with reference to academic literature, the improvement of outdoor activity programs by emphasizing the need of suiting customers’ needs and the practical implications for recreation programs’ provision.

Introduction

The popularity of outdoor recreation has been rapidly increased the last years, as more and more people are realizing the multiple benefits of outdoor recreation participation (Priest & Gass, 1997). It is widely accepted that outdoor recreational programs contribute to participants’ physical and psychological health by offering opportunities for excitement, new challenges, risks, growth and human development, as well as opportunities for social interaction.

A variety of theoretical approaches have been applied for the study of outdoor recreation participation, with the objective to identify the factors that facilitate or limit participation in outdoor recreational activities (Holden, 2003; Kyle, Graefe, Manning & Bacon, 2003). In the present study, we used an extended version of the Theory of Planned Behavior (TPB) with the inclusion of the role identity variable, aiming to test the degree to which intention to participate as well as actual participation can be predicted by the elements of the theory.

According to the TPB (Ajzen, 1988; Ajzen & Madden, 1986), human behavior is a function of an individual’s intention to perform the behavior in question. In its turn, intention is determined by a combination of three conceptually independent factors: (a) attitude toward the specific behavior, (b) subjective norms, and (c) perceived behavioral control. More specifically, the model proposes that behavior is a function of beliefs, which are related to the behavior. Attitudes are defined as one’s positive or negative predisposition towards a specific behavior, and determined by an individual’s behavioral beliefs toward the behavior (Ajzen, 1988). On the other hand, subjective norm expresses the social pressure that is placed on the individual to perform the specific behavior. Perceived behavioral control has been introduced to enhance the prediction of behaviors in which volitional control may be incomplete (Ajzen, 1988). Irrespectively of a person’s intention, there may be some obstacles preventing him / her from caring out the behavior. These obstacles may be internal factors, such as, skills, abilities, knowledge, and adequate planning, as well as, external factors, such as, time, opportunity, and cooperation with other people (Ajzen & Madden, 1986), and expresses individual beliefs about the ease or difficulty in performing a specific behavior. The TPB postulates that perceived behavior control influences behavior both directly and indirectly through an independent effect on behavioral intention (Ajzen & Madden, 1986). The more it is perceived that the behavior in question is not under control, the more it is expected that a direct link, between perceived behavioral control and behavior, not mediated by intention, will be present.

In the context of outdoors, the more positive attitude an individual holds, the higher the societal pressure placed on him. Furthermore, when the behavior is perceived to be controllable, behavioral intentions are more likely to be positive. Participation in outdoor recreation programs has unique characteristics, since it requires for individuals to invest time, effort and energy. Furthermore, there are many internal (e.g., injury risk and perceived fitness and skill levels) and externals factors (e.g., weather conditions, transportation, availability of opportunities) that limit individuals’ choices and make perceived behavioral control an important variable (Godin, 1993; Michels & Kugler, 1998).

Several researchers applied the theoretical framework of planned behavior to examine intention to participate in sporting activities (Courneya & Friedenreich, 1999; Papaioannou & Theodorakis, 1996; Theodorakis, 1992; 1994). In most of the studies, attitudes toward a behavior appeared to be a stronger determinant of intention (Biddle, Goudas & Page, 1994), whereas subjective norm was a weaker one (Bourdreau, Godin, Pineau, & Bradet, 1995; Courneya & McAley, 1995; Dzewaltowski, 1989). These results were not supported by studies using children and teenagers (Theodorakis, 1992).

While there have been plenty of studies that used the TPB, very few researchers applied the model in the context of outdoor recreational participation, and especially in a real-life outdoor setting. Ajzen and Driver (1991; 1992), who conducted two of the very few studies, used a laboratory setting, which limits the application of their findings. In these two studies, Ajzen and Driver (1991; 1992) reported that individuals’ beliefs and active participation in outdoor activities, such as running, biking, climbing and sailing, were not strong determinants of one’s intention towards participation in these activities.

Theodorakis (1994) extended the theoretical model of planned behavior, by adding a new variable, named role identity. The entry of the role identity variable was based on the theories of ‘identity’ and ‘symbolic interaction’ (Burke, 1980). It was first used in a study conducted by Theodorakis (1994), who attempted to predict adolescent women’s participation in a recreational exercise program. Role identity pertains to an individual’s behavior which, appears to be in accordance with a set way, as it is part of the person’s identity, his/her role within the society, as well as it is an element of him/herself. Theodorakis (1994) concluded that the Planned Behavior model was slightly more successful in predicting exercise behavior with the inclusion of the role identity variable. This variable has not been used by previous studies in the context of recreation participation. We argue that it is meaningful in this setting, considering that behavior / participation in outdoor recreational activities can be developed through an individual’s role.

In the present research, we attempted to investigate how behavioral factors influence an individual’s decision to participate in an outdoor recreational program, which included lake canoe/kayak, orienteering, and archery. The Planned Behavior Model enhanced with the role identity variable provided the theoretical framework for our investigation.

Methodology

The data were collected in two stages:

a) Data collection about intention to participate in the outdoor program In order to recruit participants, a series of presentations were made by the researchers in a University campus targeting University students, in a local fitness clubs, and in a local cultural association. Three hundred and twenty nine (N=329) individuals attended these presentations. They were informed about the program, the place, the activities included (lake canoe/kayak, orienteering, and archery), and the dates, and were invited to participate. They also completed the questionnaire with the elements of the TPB, and they were asked to report if they intend to participate in the programs.

b) Data collection about actual participation One hundred and eighty seven (N=187) individuals of those reported intention to participate (56%) showed up at Lake Plasteera, where the program took place. This was the sample of the second stage of the study.

Assessment of Variables

The variables from the planned behavior model were based on the original work of Ajzen and Madden, (1986), modified for the Greek language and culture by Theodorakis (1992; 1994), and re-modified by the researchers for the purposes of this research project.

Attitude towards Participation, in outdoor activities was assessed with one item: “For me to participate in next week’s excursion at Lake Plasteera which, includes canoe, archery, and orienteering activities, is..” Responses were given on a 7-point scale, using ten (10) bipolar adjectives (e.g., good-bad, healthy-unhealthy, interesting -boring, useful – of no-use, pleasant – unpleasant, wise – foolish). Cronbach’s reliability coefficient was .72.

Subjective Norms, were determined with four items. Example: “If I participate in next week’s excursion at Lake Plasteera which, includes canoe, archery, and orienteering activities, individuals who are important to me.”. Responses were given on 7-point scales, ranging from ‘will disagree’ to ‘will agree’. Cronbach’s a reliability coefficient was .81.

Perceived Behavioral Control. The total score of three items was used to estimate participants’ perception of control on the specific behavior. Examples: “If I wanted to, I could participate in next week’s excursion at Lake Plasteera which, includes canoe, archery, and orienteering activities”, “How much control do you exert over your participation in next week’s excursion at Lake Plasteera which, includes canoe, archery, and orienteering activities?”. Participants’ responded on 7-point scales, ranging from ‘likely’ to ‘unlikely’ and ‘complete control’ to ‘no control’, respectively. Cronbach’s a coefficient was .73.

Role Identity. This variable was added to the model by Theodorakis (1992). Seven items were used to measure role identity. Examples: “It’s in my character to participate in next week’s excursion at Lake Plasteera which, includes canoe, archery, and orienteering activities”, “Generally, I am the type who is going to participate in next week’s excursion at Lake Plasteera which, includes canoe, archery, and orienteering activities”. Responses were given on a 7-point scale, ranging from ‘strongly agree’ to ‘strongly disagree’. Cronbach’s a was .86.

Behavioral Intention. The mean score of three items estimated participants’ intention to exhibit the behavior of participating. Example: “I will try to participate in next week’s excursion at Lake Plasteera which, includes canoe, archery, and orienteering activities.” Responses were given on a 7-point scale, with endpoints labeled ‘possible’ and ‘impossible.’ Cronbach’s a for this subscale was .91. Actual Behavior, was measured by actual participation in the program.

Results

Descriptive statistics are presented in Table 1. Pearson product-moment correlation coefficients were computed for all variables used in this study. Table 2 shows the Pearson Product-Moment correlations among all variables.

Table 1

Descriptive statistics and reliability analysis for the planned behavior scales.

Number of items Mean SD Min Max Coefficient alpha
Attitudes toward behaviorSubjective norms

Role identity

Perceived behavior control

Intention toward behavior

104

7

3

3

5.26.1

5.1

5.5

5.6

.57.85

1.1

1.0

1.5

4.003.25

1.57

1.67

1.00

7.007.00

7.00

7.00

7.00

.72.81

.86

.73

.91


Table 2

Pearson Product-Moment Correlation Coefficients among variables.

Variables 1 2 3 4 5
1. Intention Toward Behavior
2. Attitudes Toward Behavior .431**
3. Subjective Norm .237** .240**
4. Perceived Behavioral Control .536** .465** .184**
5. Role Identity .427** .526** .342** .392**
6. Behavior .390** .137* .057 .265** .206**

* p < .01, ** p < .001

Significant correlations existed between intention toward the behavior of participation and the following variables: attitude towards participation (r = .431, p < .001), subjective norm (r = .237, p < .01), perceived behavioral control (r = .536, p < .001), role identity (r = .427, p < .001), and the actual behavior of participation (r = .390, p < .001). Actual behavior of participation also significantly correlated with attitudes towards the behavior (r = .137, p < .01), perceived behavioral control (r = .265, p < .001), and role identity (r = .206, p < .001). Moreover, significant correlations existed between perceived behavioral control and attitudes, perceived behavioral control and role identity, attitudes and role identity, subjective norm and role identity.

Prediction of Intention

Stepwise multiple regression analysis was used to predict intention for participation. The variables from the planned behavior model served as predictors (i.e., independent variables). The results are presented in Table 3. The analysis showed that perceived behavioral control, role identity factor, and attitudes toward the behavior were significant predictors of participants’ intention towards the behavior. More specifically, in step 1, perceived behavioral control contributed to the prediction, R = .53, (F = 132.1, p < .001). In step 2, role identity increased predictability to .58, (F = 85.1, p < .001). In step 3, attitudes toward behavior further increased the prediction to .59 (F = 60.0, p < .005). Hierarchical regression analyses were also performed. The results matched the stepwise analysis.

Table 3.

Stepwise Multiple Regression Analysis for Prediction of Intention.

Variables R F Change p
1. Perceived Behavioral Control2. Role Identity

3. Attitude Toward Behavior

4. Subjective Norm

.53.58

.59

.59

132.1285.17

60.07

.373

.001.001

.005

.542

Prediction of Behavior

Stepwise multiple regression analysis was also used to predict actual behavior of participation. The results of this analysis are presented in Table 4. In step 1, intention toward the behavior contributed to the prediction, R = .39 (F = 58.6, p < .001). Perceived behavioral control, attitudes toward the behavior, and role identity did not contribute to the prediction beyond intention. Once again, a hierarchical regression analysis was performed and results matched the stepwise analysis.

Table 4.

Stepwise Multiple Regression Analysis for Prediction of Behavior.

Variables R F Change p
1.Intention Toward Behavior2.Perceived Behavioral Control

3.Attitudes Toward Behavior

4.Role Identity

Excluded Variables

1. Subjective Norm

.39.39

.40

.40

58.61.6

1.2

1.2

.001.198

.266

.264

Discussion

Explaining participation in outdoor recreational activities appears to be a complex task. The primary purpose of this study was to predict intention towards participation as well as actual participation in outdoor recreational activities. Role identity was included as an extra variable in an effort to strengthen the prediction of intention and actual participation.

The results provided support for the applicability of the TPB in the context of outdoor recreation. First of all, actual behavior was significantly predicted by participants’ intention. It should, however, be noted that the prediction was not very strong. Almost half of the individuals that reported intention to participate in the activity did not turn up, and did not participated in the program. This finding shows the difficulties in predicting outdoor recreation participation. Individuals reported intention to participate but for some reasons did not. It is of theoretical and practical importance to find out these reasons. This is where constraints research could give answers and clarify the lack of correspondence between intention and behavior (Alexandris & Carroll, 1997a). Future research should be conducted in this direction. As previously discussed, outdoor recreation participation requires considerable investment by individuals in terms of time, effort, and resources. It is subsequently expected that individuals should overcome a variety of constraints in order to reach to participation.

These arguments are supported by the important role of perceived behavioral control in predicting intention to participate. It was shown to be the most important contributor. This is in line with the majority of the previous studies in sport and exercise settings (e.g., Ajzen & Driver 1992; Courneya & Friedenreich, 1999; Dzewaltowski, 1989; Michels & Kugler, 1998; Papaioannou & Theodorakis, 1996; Theodorakis, 1994) that reported perceived behavioral control as the most important determinant of intention to participate in sport and exercise activities. Once again, it is of practical important to further explore the personal meaning of this variable. For some individuals it might mean perceived constraints (e.g., perceived lack of time), while for some others it might mean real constraints (e.g., lack of financial resources). The meaning of perceived behavioral control is personal but it is also contextual. It is expected that different factors will limit individuals’ participation in exercise activities in comparison with outdoor activities.

The results also supported the inclusion of role identity within the model since it significantly predicted intention to participate. As previously discussed, role identity refers to an individual’s behavior, which appears to be in accordance with a set of specific images and an individual’s role within the society. It is an interesting finding, since role identity has not been included in previous studies in the area of outdoor recreation. It clearly has a personal meaning, and further research is required in order to clarify how this identity is formed, and what are the factors that influence it. Positioning outdoor recreation based on customers’ self-identity might be a good suggestion for those working on the promotion and marketing of the programs. Subsequently, further clarifying the role of identity and its meaning is of practical importance, since it could help program providers to design more effective marketing strategies.

Attitude was the last variable that contributed in the prediction of intention. Individuals with more positive attitudes are more likely to express a positive intention towards participation in outdoor recreational programs. This supports findings of previous studies in sport setting (Michels & Kugler, 1998; Theodorakis, 1994). Attitudes are usually formed on the basis of previous experience or by information that is provided by formal (e.g.,advertising) and informal (e.g., friends) sources.

Finally, subjective norm did not have a significant role in explaining one’s intention to participate in outdoor activities. Once again, this finding is in line with previous research. The majority of previous studies (Boudreau at al., 1995; Courneya & McAuley, 1995; Dzevaltowski., 1989; Godin, 1993) did not report significant relationships between subjective norm and intention to participate. Ajzen & Driver (1992), and Dzewaltowski, (1989), argued that social influence-pressure has a small effect on one’s intention to exercise. It seems however that the age of the participants might play a significant role. We used a sample of adult individuals, where the influence of the social environments seems not to be important. Previous studies that used adolescents, however, led to different results. Theodorakis (1992), for example, found that subjective norm was the stronger predictor of intention to participate in sport activities among young students.

In conclusion, the present study applied the TPB in an outdoor recreation setting. The results provided support for the value of the theory. They also indicated the difficulties in predicting actual participation in outdoor recreation based on intentions to participate. Future research should focus on the identification of the factors that intervene between intention and actual participation. Perceived behavioral control, attitudes towards outdoor recreation and role identity were the three variables that significantly contributed to the prediction of intention.

References

  1. ALEXANDRIS, K. AND CARROLL, B. (1997a). An analysis of leisure constraints based on different recreational sport participation levels: Results from a study in Greece. Leisure Sciences, 19: 1-15.
  2. AJZEN, I. AND MADDEN, T. J. (1986). Prediction of goal-directed behavior: Attitudes and perceived behavioral control. Journal of Experimental Social Psychology, 22: 453-474.
  3. AJZEN, I. AND DRIVER, B. L. (1991). Prediction of leisure participation from behavioral, normative, and control beliefs: An application of the theory of Planned Behavior. Leisure Sciences, 13:185-204.
  4. AJZEN, I. AND DRIVER, B. L. (1992). Application of the theory of Planned Behavior to leisure choice. Journal of Leisure Research, 24:207-224.
  5. BIDDLE, S., GOUDAS, M. AND PAGE, A. (1994). Social-psychology predictors of self-reported actual and intended physical activity in a university workforce sample. British Journal of Sport Medicine, 28: 160-163.
  6. BOUDREAU, F., GODIN, G., PINEAU, R. AND BRADET, R. (1995). Health risk appraisal in occupational setting an dits impact on exercise behavior. Journal of Occupational and Environmental Medicine, 37: 1145-1150.
  7. BURKE, P. J. (1980). The self: Measurement requirements from an interactionist perspective. Social Psychology Quarterly, 43: 18-29.
  8. COURNEYA, K. S. AND FRIEDENREICH, C. M. (1999). Utility of the theory of planned behavior for understanding exercise during breast cancer treatment. Psychooncology, 8:112-122.
  9. COURNEYA, K. S. AND MC ALLEY, E. (1995). Cognitive mediators of the social influence-exercise adherence relationship; a test of the theory of planned behavior. Journal of Behavioral Medicine, 18:499-515.
  10. DZEWALTOWSKI, D. A. (1989). Toward a model of exercise motivation. Journal of Sport & Exercise Psychology, 11: 251-269.
  11. KYLE, G., GRAEFE, A., MANNING, R. AND BACON, J. (2003). An examination of the Relationship between Leisure Activity Involvement and Place Attachment among Hikers Along the Appalachian Trail. Journal of Leisure Research, 35: 249-273.
  12. GODIN, G. (1993). The theories of reasoned action and planned behavior: Overview of findings, emerging research problems, and usefulness for exercise promotion. Journal of Applied Sport Psychology, 5: 141-157.
  13. HOLDEN, A. (2003). Investigating trekkers’ attitudes to the environment of Annapurna, Nepal. Tourism Management, 24: 341 – 344.
  14. MICHELS, T. C. AND KUGLER, J. P. (1998). Predicting exercise in older Americans: using the theory of planned behavior. Military Medicine, 163: 524-529.
  15. PAPAIOANNOU, A. AND THEODORAKIS, Y. (1996). A test o three models for the prediction of intention for participation in physical education lessons. International Journal of Sport Psychology, 2: 383-399.
  16. PRIEST, S. AND GASS, M. (1997). Effective Leadership in Adventure Programming. Champaign, IL: Human Kinetics.
  17. THEODORAKIS, Y. (1992). Prediction of athletic participation: A test of planned behavior theory. Perceptual and Motor Skills, 74: 371-379.
  18. THEODORAKIS, Y. (1994). Planned behavior, attitude strength, role identity, and the prediction of behavior. The Sport Psychologist, 8: 149-165.
2016-04-01T09:49:08-05:00June 7th, 2005|Contemporary Sports Issues, Sports Studies and Sports Psychology|Comments Off on Outdoor Recreation Participation: An Application of the Theory of Planned Behavior

Predictors of Academic Achievement Among Student-Athletes in the Revenue-Producing Sports of Men’s Basketball and Football

Abstract

Researchers have examined input or precollege and individual characteristics of student-athletes and on this basis have attempted to predict the student-athletes academic success. Much of this work has attempted to relate these predictions to demographic factors. Some studies suggest that differences in academic performance are influenced by academic criteria, while other studies reveal that psychological factors have a greater impact on the variation in academic achievement among student-athletes. Although these studies yield a considerable amount of relevant information with regards to selected predictors of academic performance among college student-athletes, few scholars have examined how student-athletes are impacted by the environmental influences within their college experience. The present study examines interaction with faculty measures as predictors of college Grade Point Average (GPA) for male student-athletes in revenue-producing sports. Data are drawn from the Cooperative Institutional Research Program’s 2000 Freshman Survey and 2004 Follow-Up Survey. The sample includes 459 football and basketball players attending predominantly white institutions. Regression results indicate that the impact of the contact or interaction between faculty and student-athletes is to some extent contingent upon the specific nature of the interaction. For example, faculty who provided help in achieving professional goals makes a relatively strong contribution to student success whereas faculty who provided encouragement for graduate school did not benefit male student-athletes equally for this study. Finally, the implications of these findings should be discussed among student-athletes, faculty, and advisors in order to improve the communication between faculty members and male student-athletes, enrich student-athletes’ academic productivity as well as their overall college experience.

Introduction

A substantial amount of research in past years has been conducted in an effort to determine significant predictor such as demographic, academic criteria, and psychological variables of academic achievement among student-athletes (Adler & Adler, 1985; Lang, Dunham, & Alpert, 1988; Lawrence, 2001; Purdy, Eitzen, & Hufnagel, 1985). Although these studies yield a considerable amount of relevant information with regards to selected predictors of academic performance among college student-athletes, few studies examine the life experiences or environmental factors that influence the academic success of the student-athlete while on campus (Comeaux & Harrison, 2001; Sellers, 1992). The environment encompasses all that happens to student-athletes during the course of their educational programs, which may affect and influence the desired intellectual outcome-to matriculate and graduate (Astin, 1993a).

The present study thus examines both demographic (input) and environmental variables in the prediction of academic achievement for student-athletes in the revenue-producing sports of men’s basketball and football. Specifically, this study examines selected demographic and faculty interaction measures of academic achievement among male student-athletes in revenue-generating sports. The results of the analysis are discussed in terms of their demand for future investigation on how demographic and interaction with faculty measures influence student-athletes’ academic success, as well as implications for present and future National Collegiate Athletic Association (NCAA) programming and policy.

Methodology and Research Design

Sample

The data in this study are drawn from the Cooperative Institutional Research Program (CIRP) 2000 Student Information Form (SIF) and 2004 College Student Survey (CSS) that is sponsored by the Higher Education Research Institute (HERI) at the University of California at Los Angeles (UCLA) and their Graduate School of Education and Information Studies. Although the reliability of the instrument has not been formally measured “during the past 30 years the CIRP has generated an array of normative, substantive, and methodological research about a wide range of issues in American higher education” (Sax, Astin, Korn, Mahoney, 1996). Research based on CIRP data was found to be most widely cited in American higher education research (Budd, 1990).

The specific sample analyzed for this study included 459 football and basketball student athletes attending predominantly white institutions. Given the longitudinal nature of this study only students who completed all items of interest (demographic and environmental measures) on both surveys were included. The sample was composed only of students attending four-year, predominately white institutions. While the sample was not randomly selected and is not nationally representative of the population, it does represent a large number of students from various higher education institutions.

Data Analysis

This study employs the Input-Environment-Outcome (I-E-O) model for studying college impact variables on students (Astin, 1993). “Inputs” refer to the students’ entering characteristics, “environment” is that which the student is exposed to during college, (i.e., faculty, peers, diverse views, etc.) and “outcomes” are the students’ characteristics after interacting with the environment (Astin, 1993). The power of Astin’s I-E-O model is its ability to allow researchers to measure student change during college by comparing outcome characteristics with input characteristics. In short, this framework examines the impact of various college environments on student outcomes, by controlling for inputs or students’ entering characteristics and environmental experiences.

Block stepwise regression was conducted to separate both input and environmental characteristics as the independent variables for the dependent measure, which is academic achievement. Within each block, (significant at p < .05) variables entered the regression in a stepwise fashion. The value of using a stepwise procedure design is that it allows for an examination of changing beta coefficients as each variable enters the equation.

Outcome Variable

The outcome variable focused on in this study is college Grade Point Average (GPA), a quantitative measure for academic achievement. Although there is only one dependent variable used, college GPA is a crucial variable for the purpose of this study, and a common outcome when investigating student and student-athlete achievement in higher education (Astin, 1993a; 1993b).

Input Variables

Achievement and academic characteristics (Block 1) consist of students’ characteristics before entrance to college. Achievement measures include the Verbal and Math SAT and high school grades, followed by an academic measure, studying and homework (pre-test). This is seen as an important input variable after previous exploratory analysis using study and homework as an intermediate outcome (See appendix A for variable list).

Demographic characteristics (Block 2) include measures on race and family background. For race, this study includes whites and African-American/black. Controlling for these two races was imperative, as there are a disproportionately high number of these races involved in revenue generating sports. Of the two races, blacks are expected to have the most significant effect on academic achievement compared to whites (Sellers, 1992). For family, measures include parental status (defined as the number of parents in the household of student). In addition, parental income is included as a measure, which is defined as an estimate of parents’ income by the student. Lastly, the mother’s and father’s education is included as a measure, which is defined as a composite of the mother’s and father’s educational attainment. It is anticipated that these input characteristics would have an influence on academic achievement among male revenue athletes because of strong indications from previous research (Sellers, 1992).

Environmental Variables

Measures of environmental characteristics (Block 3) are categorized into two groups: faculty support and academic characteristics (see appendix A for a complete description of the faculty and academic variables).

Table 1


Predicting Academic
Achievement (College GPA) among Male Revenue Athletes (N = 459 Freshmen
Entering in 2000)

BETA AFTER STEP
STEP VARIABLE R SIMPLE r 1 2 3 4
Input Entering:
1 High School GPA 47 47 47 39 36 36
2 SAT Verbal 50 35 21 21 21 20
Environment Entering:
3 Faculty provided help in achieving pro goals 54 22 18 18 18 14
4 Faculty provided respect 55 25 18 17 13 13
Not Entering:
Studying/HW (pretest) 13 04 04 04 04
Race: White 00 00 -03 -05 -05
Race: Black -08 -04 -02 -01 -01
Status of Parents 06 05 03 04 03
Parental Income -06 -01 -06 -05 -06
Father’s Education 09 05 00 00 00
Mother’s Education 09 06 01 02 01
SAT Math 26 08 -03 -02 -02
Studying/HW 21 11 16 08 06
Talking W/Teachers Outside Class 4
Studied W/Other Students 11
Faculty Provided Encourage for Grad School 22 18 15 09 07
Faculty Gave Advice About Education Program 15 12 11 01 -03
Faculty Provided Assistance W/Study Skills 02 04 06 -02 -04


Data Source: 2000 Freshman Survey (CIRP) & 2004 College Student Survey (CSS); Higher Education Research Institute, UCLA

Findings

Input Effects

This study represents an attempt to investigate the relative input characteristics on academic achievement among male revenue athletes enrolled in colleges and universities. Table 1 lists the input characteristics which reveals that high school GPA is the most powerful predictor of college GPA, a proxy for academic achievement (r = .47). This suggests that student with high GPAs in high school tend to get high GPAs in college. Such a finding was not surprising since high school GPA is the indicator that is more similar to college GPA in its composition. Moreover, the data reveals that the Verbal score on the SAT continues to have an influence on college GPA (r = .35). Similar to high school GPA, the data suggests that student-athletes who score high on the SAT Verbal tend to achieve higher academically in college. These two input variables do not change much as each step entered the regression. This indicates that these variables, as stated previously, are important in predicting academic achievement on male revenue athletes. Although SAT Math had a strong association to college GPA (r = .26), it did not enter the regression equation. However, once high school GPA entered at step 1 it dropped from (.26 to .08), suggesting the strength of high school GPA. Black students also did not enter the regression equation (r = -. 08), however, the data reveals that black student-athletes generally tend to enter college less prepared than whites (r = 0) in revenue generating sports.

It is of interest to note that parental status and income, and father’s and mother’s education, these variables did not enter the regression equation. The data suggests that there were no significant affects of these variables on academic achievement. Interestingly enough, the findings on mother’s and father’s educational attainment go against previous findings by Lang and her colleagues (1988).

Environmental Effects

Listed in Table 1, the entry of environmental experiences indicates some impact on academic achievement. This was largely because much of the effect of the environment is already accounted for by the input characteristics. However, the faculty support characteristics does give meaning to its relationship with academic achievement.

The data reveals that the environmental variable, faculty provided help in achieving professional goals, had a positive relationship with college GPA (r = .22). This suggests that students’ who receive assistance from faculty in achieving professional goals tend to performance higher academically in college. In addition, the data shows that there was a positive relationship between the environmental variable, faculty provided respect, and college GPA. This suggests that students’ who were respected by faculty tend to do better academically in college. While others faculty characteristics did not enter the regression equation, two variables did have strong relationships with college GPA (see table 1). Lastly, the academic characteristics, studying and homework, had a strong relationship with college GPA (r = .26), however, after step 1, it dropped (from .26 to .08), indicating the strength of high school GPA.

Conclusions

The present investigation provides evidence that both input and environmental characteristics do impact academic achievement among male revenue athletics participation in intercollegiate sports. Both high GPA and Verbal scores on the SAT continued to be strong predicators of academic achievement in college for both athletes and nonathletes. Moreover, this study showed that the impact of the contact or interaction is to some extent contingent upon the specific nature of the interaction. For example, faculty who provided help in achieving professional goals makes a relatively strong contribution to student success whereas faculty who provided encouragement for graduate school did not benefit male student-athletes equally for this study.

Given the relationship between input variables, academically oriented interactions and student-athletes’ success, the results have important implications for program design that can be used to assist college and university-level student-athletes in improving their academic performance. Beyond that, this study argues for institutions encouraging a wide range of forms of faculty communication and mentoring that are responsive to the needs of male student-athletes of different abilities. When developing such programs attention must be paid, within the structures, practices, and processes of the programs, to specific factors. Since some student-athletes enter college performing at lower academic levels than their peers, faculty, advisors and administrators must be well advised to appreciate their situation and work closely with these students in identifying factors that may impede or facilitate their academic talent development and/or self-identity. It is apparent, moreover, that programs in this area should involve faculty members as possible mentors to student-athletes to offer support and instructions about the importance of their academic pursuit. Further, since the quality and nature of formal and informal communication and faculty interactions with student-athletes is also essential to both academic achievement and overall college experience, mandatory academic and social activities (e.g. research projects, faculty attendance at sporting events and team lunches, etc.) between student-athletes and faculty members should be encouraged (Comeaux and Harrison, 2001). In doing so, faculty members will become more exposed to the culture of this special population of students and begin to cultivate meaningful relationships.

References

  1. Adler, P., & Adler, P. (1985). From idealism to pragmatic detachment: The academic performance of college athletes. Sociology of Education, 58, 241-250.
  2. Astin, A.W. (1993a). Assessment for Excellence. Phoenix, AZ: American Council on Education & The Oryx Press.
  3. Astin, A.W. (1993b). What matters in college? San Francisco: Jossey-Bass.
  4. Budd, J. M. (1990). Higher education literature: Characteristics of citation patterns. Journal of Higher Education, 61(1), 84-97.
  5. Comeaux, E. & Harrison, C.K. (2001). Ecological predictors of academic achievement among male student athletes in revenue- generating sports: A study of football and basketball participants’ interaction with faculty in higher education. A paper presented at the North American Society for the Sociology of Sport Annual Meeting in San Antonio, Texas.
  6. Lang, G., Dunham, R.G., & Alpert, G. P. (1988). Factors related to the academic success and failure of college football players: The case of the mental dropout. Youth and Society, 20, 209-222.
  7. Lawrence, S. M. (2001). The African-American athlete’s experience with race and sport: An existential-phenomenological investigation. Paper presented at the North American Society for the Sociology of Sport Annual Meeting in San Antonio, Texas.
  8. Purdy, D. A., Eitzen, D. S., & Hufnagel, R. (1985). The educational achievement of student-athletes using SAT and non-cognitive variables. Journal of Counseling & Development, 70, 724-727.
  9. Sax, L. J., Astin, A. W., Korn, W. S., & Mahoney, K. M. (1996). The American Freshman: National Norms for Fall 1996. Los Angeles: Higher Education Research Institute, UCLA.
  10. Sellers, R. M. (1992). Racial differences in the predictors of academic achievement of student athletes of Division I revenue-producing sports. Sociology of Sport Journal, 1 46-51.

Appendix A

Dependent Variable: College GPA

I. Input Block
Academic Background Characteristics

  • High School GPA
  • SAT verbal
  • SAT math
  • Studying/HW (pretest)
  • Talking w/ teacher outside class (pretest)
  • Studied with other students (pretest)

II. Input Block
Demographic Characteristics

  • Race: white
  • Race: black
  • Parental status
  • Parental income
  • Father’s education
  • Mother’s education

III. Environment Block
Faculty & Academic Support Characteristics

  • Study/HW
  • Faculty encouragement toward grad school
  • Faculty gave advice about educational program
  • Faculty respect
  • Faculty assistance with study skills
  • Faculty helped in achieving pro goals
2015-03-24T10:00:17-05:00June 6th, 2005|Contemporary Sports Issues, Sports Management, Sports Studies and Sports Psychology|Comments Off on Predictors of Academic Achievement Among Student-Athletes in the Revenue-Producing Sports of Men’s Basketball and Football

Compatibility of Adaptive Responses With Hybrid Simultaneous Resistance and Aerobic Training

ABSTRACT

The purpose of this investigation was to examine the effects of a hybrid, simultaneous, resistance and aerobic training program on aerobic power and muscular strength. Free-weight 1RM elbow flexor strength and cycle ergometer maximal aerobic power (CE VO2 max) were assessed for 15 untrained subjects. All tests were performed prior to and following a six-week training program. Subjects were randomly assigned to three training groups: an aerobic-training group, a strength-training group, and a simultaneous-training group. All training was performed three times per week. Aerobic training consisted of five to six, three-minute bouts of high-intensity exercise performed on a calibrated Monark cycle ergometer. All training intervals occurred at 85 to 100% of the subject’s CE VO2 max. Training intervals were separated by three minutes of rest. Strength training consisted of performing arm-flexion exercise with the subject’s dominant arm using a free-weight dumbbell. The strength training protocol consisted of performing four working sets of exercise per session separated by three minutes of rest. The first two weeks of training consisted of four sets of 10RM, the third week at 8RM, the fourth at 6RM, the fifth at 4RM, and the sixth at 2RM. The simultaneous training group performed both the aerobic and strength training protocols simultaneously. The aerobic and simultaneous groups significantly (p< 0.05) increased aerobic power 33.6 ± 6.1 to 39.1 ± 6.8 and 36.2 ± 3.7 to 42.3 ± 5.4 ml×kg-1×min-1 respectively. There was no significant difference in aerobic power increase between the aerobic and simultaneous training groups. The strength and simultaneous training groups significantly (p < 0.05) increased 1RM strength 11.36 ± 3.2 to 16.81 ± 5.1 kg and 13.81 ± 5.13 to 17.72 ± 6.15 kg respectively. There was no significant strength difference between the strength and simultaneous training groups. In conclusion, simultaneous high-intensity, cycle ergometer, aerobic training and one-arm, free-weight, strength training can be effectively utilized to increase maximal aerobic power and dynamic elbow-flexor strength. This study shows that the concept of simultaneous, high-intensity, aerobic and strength training is viable and that this approach to training may perhaps become a conditioning option for athletes and non-athletes.

INTRODUCTION

Strength and endurance training serve as the cornerstone of both athletic training and basic fitness regimens. A seemingly endless variety of modes, methods, and techniques are routinely utilized to achieve greater performance and fitness. At the forefront of these training methods is concurrent training. Concurrent training generally refers to the performance of both aerobic and anaerobic exercise within a fitness or athletic training program. To that end, strength and endurance training are applied in varying sequences within the same workout, daily, or weekly schedule. Athletes as well as popular and commercial fitness applications capitalize on these basic themes and supply the consumer with unlimited exercise options. Included within this variety are techniques which combine both resistance and aerobic training at the same moment in time, not separately. Such techniques are now very popular and are most commonly utilized in group-exercise settings in which individuals utilize barbells or dumbbells with the upper body and some kind of aerobic movement with the lower body at the same moment in time. For clarity, this type of training will be referred to as simultaneous training.

Currently, available research does not document simultaneous training as defined above. However, numerous studies have investigated the interactions of strength and aerobic training on muscular strength and aerobic power resulting from traditional same day or different day simultaneous training. These investigations often report mixed results (Abernethy & Quigley, 1993; Dudley & Djamil, (1985), Gravelle & Blessing, 2000; Hennessy & Watson, 1994; Hickson, 1980; Hunter, Demment, and Miller, 1987, McCarthy, Pozniak, and Agre, 2002; McCarthy, Agre, Graf, Pozniak, and Vailas, 1995). In all reviewed investigations, experimental training groups that performed concurrent training had no impairment in the magnitude of aerobic power increase as compared to those training groups that performed aerobic training only. The numerous physiological and structural adaptations resulting from aerobic training appear to be unaffected when combined concurrently with strength training. Some studies in which concurrent training was performed showed significantly less increase in muscular strength as compared to those experimental groups that performed strength training only (Dudley & Djamil, 1985; Hennessy & Watson, 1994; Hickson, 1980). Then again there are a number of studies which show little, if any, impairment in the magnitude of strength gain (Abernethy & Quigley, 1993; Hunter et al. 1987, McCarthy et al., 2002; McCarthy et al, 1995, Volpe, Walberg-Rankin, Webb-Rodman, and Sebolt, 1993). Most investigations reporting strength decrement report that strength gain decrement is isolated to the same muscle group that was utilized during the aerobic training portion of the study. Currently there is a lack of consensus among investigators as to the exact cause(s) of strength gain impairment as a result of concurrent training

Regardless of the degree of compatibility concurrent training may afford to increases in muscular strength and aerobic capacity, each of the aforementioned studies utilizes unique training methodologies and experimental designs. These key differences make it difficult to discern the degree of effectiveness and optimal application of concurrent training. Simultaneous training further complicates training and training outcomes due to its hybrid nature. This type of training is physically complicated and requires full body coordination. Since it does not involve a separation of the two modes of training and is relatively difficult to effectively coordinate, the efficacy of this training is unclear in either laboratory or group-exercise settings. The objective of this experiment was to examine the efficacy of synchronizing strength and endurance training and its effect on muscular strength and aerobic power.

METHODS

Subjects

Fifteen subjects, nine women and six men, ranging in age from 18 to 28, were recruited for this study (Table 1). Prior to data collection, subjects had not participated in a regular exercise program for a period of six months. All subjects were required to fill out a medical history questionnaire for the purpose of screening for contraindications to participation. The Southern Illinois University at Carbondale Human Subjects Committee granted approval for this study. Subjects were informed of the risks associated with participation in the study and subsequently signed an informed consent prior to data collection.

Table 1. Subject characteristics (mean ±SD )
Variable Women (n = 9) Men (n = 6)
Age (y) 21.1 ± 2.6 21.2 ± 1.5
Height (cm) 158.5 ± 16.6 180 ± 6.7
Weight (kg) 69.8 ± 7.7 88.0 ± 20.7
Body Fat (%) 26.1 ± 5.2 15.2 ± 5.5

Experimental Design

Subjects were assigned to one of three training groups. Each training group was randomly assigned three women and two men. The first training group was a strength-training group (STG) only, the second was an aerobic-training group (ATG) only, and the third was a simultaneous-training group (SNTG). All subject testing occurred one week pre- and one week post-training. Subjects in all three training groups performed both strength and aerobic testing. All training was conducted three times per week at regular intervals, typically on an alternating daily basis. The duration of the training period was six weeks. All pre-testing took place within one week prior to and following the training period.

1RM Testing

A one repetition maximum (1RM) elbow flexion (bicep curl) test was performed unilaterally using the subject’s dominant arm. A plate loaded dumbbell was utilized for 1RM testing. Subjects were seated with their feet on the floor. Bicep curling was performed with the hand in the supinated position throughout the lift’s range of motion. A 1RM protocol consistent with NSCA guidelines was utilized prior to maximal testing (Baechle & Earle, 2000). A maximal lift was determined when the subject could complete only one repetition in strict form.

Aerobic Power Testing

A calibrated Monark cycle ergometer (Varberg, Sweden) was utilized for all aerobic power testing. Maximal cycle ergometer oxygen consumption (CE VO2max) was measured using a Parvo Medics, True Max 2400 Metabolic Measuring system (Concentius Technology). Subjects wore a Polar heart rate monitor during all testing. A five-minute submaximal warm-up period preceded commencement of the aerobic power testing protocol. A pedaling rate of 60 rpm was maintained throughout the test. An initial work load of 60 Watts (W) was performed for one minute. At the beginning of each minute following the first minute, pedaling intensity was increased by 30 W. Heart rate was annotated at the end of each respective workload. Cycle ergometer VO2max was determined by the occurrence of one of the following; a plateau or decrease in oxygen consumption with a subsequent increase in workload, obtaining age predicted maximum heart rate or volitional fatigue. A brief cool-down period followed test termination.

Strength Training

Strength training was performed unilaterally with the subject’s dominant arm. A plate-loaded dumbbell was used to perform elbow flexion (bicep curl) exercise. As with the 1RM trial, strength training was performed in the seated position. The first and third training sessions of each week were designated “heavy” training days while the second was a “light” training day. Pilot testing revealed that muscular and joint soreness were an issue with three heavy training sessions per week. A brief warm-up period, consisting of two to three sets of 12-15 repetitions at about 50% of the subject’s 1RM, preceded each training session. Four working sets were performed during each training session following the warm-up period. The strength-training protocol was periodized by RM loads over the course of the six-week training program. The first two weeks of training consisted of performing arm flexion exercise at the subject’s 10RM load. The third week was performed at the subject’s 8RM load. The fourth was performed at the 6RM load, the fifth at 4RM, and the sixth at 2RM. Training loads were adjusted as needed throughout training sessions to achieve target repetitions across all sets. Light-day training sessions were performed at approximately 75 to 80% of the heavy training loads. All working sets were separated by three minutes of rest.

Aerobic Training

Aerobic training was performed on a Monark (Varberg, Sweden) cycle ergometer. Cycles were calibrated each week. A heart-rate monitor was worn by each subject during training to monitor exercise intensity during training. Following a brief warm-up period consisting of five to 10 minutes of light, sub-maximal pedaling, aerobic training commenced. Training sessions consisted of five, three-minute exercise intervals separated by three minutes of rest. All training intervals were performed at a pedaling rate of 60 rpm. Exercise bouts were performed at power outputs corresponding to the subject’s 85 to 100% CE VO2 max. Beginning the fourth week of training a sixth training interval at 85 to 100% VO2 max was added. Percentages of the subject’s CE VO2 max were calculated using the Karvonen method (American College of Sports Medicine [ACSM], 2000).

Simultaneous Training

Simultaneous training consisted of both the strength and aerobic training protocols performed at the same time. Upon initiating the aerobic training protocol and achieving the desired pedaling rate of 60 rpm, subjects were handed an appropriately loaded dumbbell. Subjects continued pedaling while curling the dumbbell until the desired repetition number for that set was achieved. Coordination of simultaneous exercise activities was achieved quickly by each subject. Upon completion of the set the dumbbell was removed and the subject completed the aerobic interval.

Statistical Analyses

All statistical analyses were performed using the SIUC mainframe Statistical Analysis Systems (SAS) program. Measures of central tendency and spread of data were represented as means and standard deviations. The experimental protocol employed a repeated measures design. A two by three repeated measures analysis of variance (ANOVA) was performed to analyze within and between group differences. Between- and within-group analyses consisted of the following for each group: 1) pre- and post- training 1RM and 2) pre- and post-training aerobic power measurements. The criterion alpha level was set at p < 0.05. All statistically significant interactions were analyzed to determine if either of the training groups had greater increases in either aerobic power or muscular strength from pre- to post-training than other training groups. Differential effects, a post-hoc technique, were utilized to analyze significant interactions between training groups (Khanna, 1994).

RESULTS

Muscular Strength

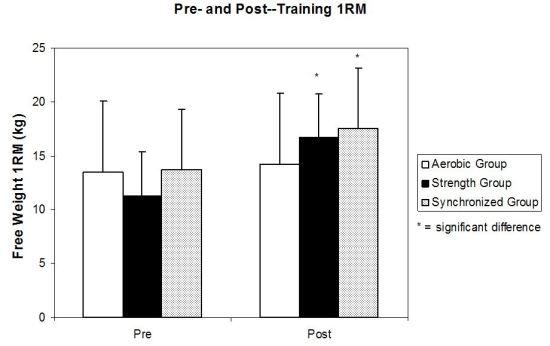
There was a significant increase in 1RM for the simultaneous training group from pre- to post-training (13.81 ± 5.13 to 17.72 ± 6.15 kg), an increase of 28.29%. There was a significant increase in 1RM for the strength training group from pre- to post-training (11.36 ± 3.20 to 16.81 ± 5.1 kg), an increase of 48.0% (Figure 1.). There was no significant difference in muscular strength increase between the simultaneous and strength training groups. The aerobic training group had no significant increases in muscular strength.

Figure 1. Changes in muscular strength pre-training to post-training.

Figure One

Aerobic Power

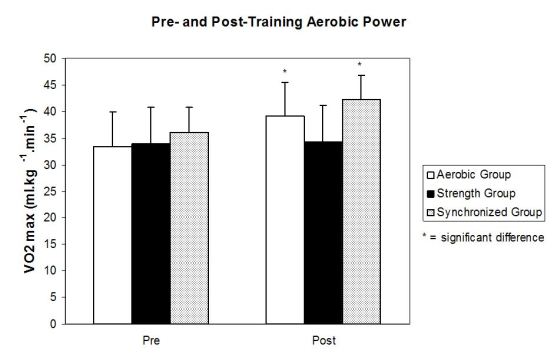
The simultaneous training group significantly increased CE VO2max from pre- to post-training (36.2 ± 3.7 to 42.3 ± 5.4 ml · kg -1 · min-1), an increase of 16.75%. The aerobic training group significantly increased CE VO2max from pre- to post-training (33.5 ± 6.1 to 39.1 ± 6.8 ml · kg -1 · min-1), an increase of 16.49% (see Figure 2.). There was no significant difference in the magnitude of increase of the CE VO2max between the aerobic and simultaneous training groups. There was no significant increase in aerobic power for the strength training group.

Figure 2. Changes in aerobic power, pre-training to post-training.

Figure Two

DISCUSSION

In the present study, simultaneous training induced significant increases in both aerobic power and muscular strength. The independent strength and endurance training programs produced significant increases in both muscular strength and aerobic power respectively. Results indicate that hybrid simultaneous training, consisting of strength training and high-intensity aerobic training is capable of inducing significant increases in both muscular strength and aerobic power.

In simultaneous exercise, especially in group settings, the upper body is most benefited by resistance training since the lower body is performing the primary aerobic movement. Therefore, the greatest muscular strengthening occurs in the musculature of the upper body. Kraemer et al. (1995) referred to this effect as compartmentalization in which the upper body muscle groups are essentially unaffected by any negative effects of aerobic training. Group simultaneous exercise typically involves the use of relatively light barbells, dumbbells, or power bands. Training sessions persist up to an hour and include a variety of aerobic and resistance training movements. In the current study, utilizing lighter weights and a variety of movements was not practical. A primary goal of this study was to explore the efficacy of applying the two types of training so that the respective aerobic and resistance training stimuli occurred at the same time as in group settings. Given the results of the current investigation, it is reasonable to presume that group-style simultaneous training is a viable form of training.

Changes in aerobic capacity represent a durable adaptation in concurrent training. Superficially, it appears as if many physiological and structural adaptations that occur as a result of performing aerobic and strength training exercise may be antagonistic to each other. The specific adaptations common to endurance training include increases in capillary density, myoglobin, mitochondria, and oxygen uptake (Holloszy & Coyle, 1984). Aerobic training also has a tendency to decrease myofibrillar protein production in the muscle (Hoppeler, 1986). Strength training, however limits mitochondria, capillary supply, and production of aerobic enzymes (Luthi, Howald, Claassen, Vock, and Hoppeler, 1986; MacDougall, Sale, Moroz, Elder, Sutton, and Howald, 1979). According to Hurley, Seals, and Eshani (1984) while peripheral changes are important in the development of aerobic power, adaptations of the central circulatory mechanisms such as cardiac output and stroke volume are not affected by strength training. With respect to aerobic and strength training independently, this demonstrates that some physiological and structural adaptations to exercise have a more profound effect on the magnitude of the increase or decrease than others. The lack of significant difference in VO2max increases between the endurance and concurrent groups in several studies demonstrate that the development of aerobic capacity is independent of muscular strength increase (Dudley and Djamil, 1985; Hickson, 1980, Hunter et al. 1987; McCarthy et al. 2002; McCarthy et al., 1995; Volpe et al., 1993). The aerobic results of the current study were in agreement with those of the concurrent training studies.

Resistance training in its various forms elicits increases in muscular hypertrophy, increased stores of ATP and PCr, force generation, and anaerobic enzymes (Costill, Coyle, Fink, Lesmes, and Witzmann, 1979; Fleck & Kraemer, 1988; MacDougall, Sale, Elder, and Sutton, 1982; MacDougall et al., 1979). However, the greatest issue surrounding any type of simultaneous training regimen is strength gain inhibition. In some concurrent investigations in which the lower body was involved in strength and aerobic training, the lower body strength gains in the concurrent training groups were inhibited (Dudley & Djamil, 1985; Hennessy & Watson, 1994; Hickson, 1980). In Leveritt and Abernethy’s (1999) investigation, the ability of subjects to perform strength training was reduced following aerobic training. The strength inhibition experienced in the lower body demonstrates the susceptibility of the legs in general to strength gain impairment in response to concurrent training. Studies that performed resistance training with the upper body noted few if any problems with upper body strength increase when the legs were used to perform aerobic training. Kraemer et al. (1995) reported that effects of upper body strength training performed with endurance training seem to be generally compartmentalized to the upper body musculature, and did not significantly affect the force production or endurance capabilities of the lower body musculature. Interestingly, this does not appear to be the same relationship with aerobic and strength training performed by the arms. Abernethy and Quigley’s investigation (1993) noted no strength gain inhibition in a concurrent group that performed arm ergometry and isokinetic arm strength training. It was noted that further research will be needed to understand the different strength adaptation patterns in the quadriceps and triceps brachii respectively. The current study is in agreement with concurrent training study observations that show the upper body strength increases are not compromised by the aerobic activity performed by the lower body. Sale, MacDougall, Jacobs, and Garner (1990) noted; whether impairment, compatibility, or synergistic enhancement occur, the application of training volume, intensity, frequency, mode, training status of subjects decides the final outcome.

CONCLUSIONS

In the current investigation, aerobic and strength gain adaptations resulting from simultaneous training group were not negatively impacted. The adaptations of hybrid simultaneous training are much aligned with observations of traditional simultaneous training. While simultaneously achieved, muscular strength and aerobic power adaptations in the present study were likely not achieved due to the respective adaptations functioning in a complimentary capacity, but perhaps a compatible or even independent capacity. This training technique does pose limitations with respect to equipment, coordination, and number of exercises possible in combination. However, this type of training appears to be effective and may be used as a legitimate, but limited mode of exercise or conditioning. This type of training may also be used for off-season and pre-season conditioning for athletes as well. In conclusion, in untrained adults, simultaneous strength and aerobic training are as effective for increasing muscular strength and aerobic power.

References

1. Abernethy, P.J. & Quigley, B.M. (1993). Concurrent strength and endurance training
of the elbow extensors. Journal of Strength and Conditioning Research, 7, 234-240.

2. American College Of Sports Medicine (ACSM) (2000). ACSM’s Guidelines for
Exercise Testing and Prescription. Philadelphia: Lippincott, Williams, and Wilkins.

3. Baechle, T.R. & Earle, R.W. (2000). Essentials of Strength Training and Conditioning.
Champaign, IL: Human Kinetics.

4. Costill, D., Coyle, E., Fink, W., Lesmes, G. & Witzmann, F. (1979). Adaptations
in skeletal muscle following strength training. Journal of Applied Physiology, 46, 96-99.

5. Dudley, G.A., & Djamil, R. (1985). Incompatibility of endurance and strength training
modes of exercise. Journal of Applied Physiology, 59, 1446-1451.

6. Fleck, S., & Kraemer, W. (1968). Resistance training: physiological responses and
adaptations. Physician and Sportsmedicine, 16, 108-119.

7. Gravelle, B.L. & Blessing, D.L. (2000). Physiological adaptation in women
concurrently training for strength and endurance. Journal of Strength and Conditioning Research, 14, 5-13.

8. Hennessy, L.C., & Watson, A.W. (1994). The interference effects of training for
strength and endurance simultaneously. Journal of Strength Conditioning and Research, 8, 12-19.

9. Hickson, R.C. (1980). Interference of strength development by simultaneously training
for strength and endurance. European Journal of Applied Physiology, 45, 255-269.

10. Holloszy, J. & Coyle, E. (1984). Adaptations of skeletal muscle to endurance
exercise and their metabolic consequences. Journal of Applied Physiology, 56, 831-838.

11. Hoppeler, H. (1986). Exercise-induced ultrastructural changes in skeletal muscle.
International Journal of Sports Medicine, 7, 187-204.

12. Hunter, G., Demment, R., and Miller, D. (1987). Development of strength and
maximum oxygen uptake during simultaneous training for strength and endurance. Journal of Sports Medicine and Physical Fitness. 27, 269-275.

13. Hurley, B.F., Seals, D.R., and Eshani, A.A. (1984). Effects of high intensity strength
training on cardiovascular function. Medicine and Science in Sports and Exercise, 16, 483-488.

14. Khanna, R. (1994). An analysis of the teaching, understanding and interpretation of
interaction effects in a factorial design. Unpublished doctoral dissertation. Southern Illinois University, Carbondale.

15. Kraemer, W.J., Patton, J.F., Gordon, S.E., Harman, E.A., Deschenes, M.R., Reynolds,
K., Newton, R.U., Triplett, N.T., and Dziados, J. (1995). Compatibility of high-
intensity strength and endurance training on hormonal and skeletal muscle adaptations. Journal of Applied Physiology, 78, 979-989.

16. Leveritt, M. & Abernethy, P.J. (1999). Acute effects of high-intensity endurance
exercise on subsequent resistance exercise activity. Journal of Strength and Conditioning Research, 13, 47-51.

17. Luthi, J.M., Howald, H., Claassen, H., Rösler, P, Vock, P. & Hoppeler, H.
(1986). Structural changes in skeletal muscle tissue with heavy resistance exercise. International Journal of Sports Medicine. 7, 123-127.

18. Macdougall, J., Sale, D., Elder, G., & Sutton, J. (1982). Muscle ultrastructural
characteristics of elite powerlifters and bodybuilders. European Journal of Applied Physiology, 48, 117-126.

19. Macdougall, J.D., Sale, D.G., Moroz, J.R., Elder, G.C.B., Sutton, J.R. &
Howald, H. (1979). Mitochondrial volume density in human skeletal muscle following heavy resistance training. Medicine and Science in Sports and Exercise, 11, 164-166..

20. McCarthy, J.P., Pozniak, M.A. & Agre, J.C. (2002). Neuromuscular adaptations to
concurrent strength and endurance training. Medicine and Science in Sports and Exercise, 34, 511-519.

21. McCarthy, J.P., Agre, J.C., Graf, B.K., Pozniak, M.A., & Vailas, A.C. (1995).
Compatibility of adaptive responses with combining strength and endurance
training. Medicine and Science in Sports and Exercise, 27, 429-436.

22. Sale, D.G., Macdougall, J.D., Jacobs, I., & Garner, S. (1990). Interaction
between concurrent strength and endurance training. Journal of Applied
Physiology, 68, 260-270.

23. Volpe, S.L., Walberg-Rankin, J., Webb Rodman, K., & Sebolt, D.R. (1993).
The effect of endurance running on training adaptations in women participating in a weight lifting program. Journal of Strength and Conditioning Research, 7, 101-107.

2015-03-24T09:56:47-05:00June 5th, 2005|Contemporary Sports Issues, Sports Coaching, Sports Exercise Science, Sports Management, Sports Studies and Sports Psychology|Comments Off on Compatibility of Adaptive Responses With Hybrid Simultaneous Resistance and Aerobic Training

Considerations for Interscholastic Coaches

Abstract

This study examines coaches’ learning experiences by identifying some of the major obstacles beginning coaches may encounter. It also suggests ways to prevent potential problems by examining the knowledge of more experienced coaches. Head high school football and basketball coaches were surveyed to determine things they would do the same and things they would do differently, if they were starting their careers over again. Based on survey responses, several themes emerged. The emergent themes were in the areas of relationships, professional development, conditioning and training, organization and administration, scheduling, academics, promotion and fundraising, facilities, job choice, and rules and accountability. When asked what they would do differently, the largest numbers of responses were in the areas of relationships (79%), organization and administration (41%), and job choice (28%). When asked what they would do the same, the largest number of responses were in the areas of professional development (72%), relationships (59%), conditioning and training (59%), and rules and accountability (45%). The results of this study are consistent with previous research on coaching and offer implications for those interested in entering the profession of coaching

Loser or Legend: Beginning Considerations for Interscholastic Coaches

Coaching is probably one of the toughest professions in the world. Contrary to the opinion of many, coaching is not a tough profession because of the pressure to win. Sure coaches are fired everyday based on their win-loss records, but most coaches understand the nature of the sport and live for the intense competition. What makes coaching such a difficult profession are the innate complexities of the game and the specialized body of knowledge required to be a good coach (Martens, 2004). What makes coaching a daunting profession is that coaches are expected to possess knowledge across a wide range of domains, including the ability to master the many roles a coach is required to perform that are unrelated to specific practice or game instruction (Lynch, 2001).

It has often been said that hindsight is always twenty-twenty. This is especially true in the profession of coaching, where split-second decisions and inches are what separate loser from legend. Early in his career at Duke University, basketball coach Mike Krzyzewski was considered a loser. So was former football coach Tom Landry, who had a losing record in each of his first six seasons with the Dallas Cowboys. Both of these coaches are now considered legends. At their best, most coaches have win-loss records of .500 or less. However, coaching is about more than wins and losses. At its best, coaching is about teaching life skills through game strategy. The best coaches know this. Still, most coaches never quite master this art and science either.

Given a chance, even the most experienced coaches would do some things differently, if the decisions would result in more victories on or off the field. Since the ability to go back in time is not an option, the ability to reflect on past experiences and then share that coaching wisdom is the next best alternative. According to O’Donnell (1998), coaches learn through experience (trial and error) or by studying other successful coaches. This theory of learning is what makes sport camps and clinics such a popular and lucrative business. Neophyte coaches often seek the knowledge of highly experienced coaches with the hopes that it will translate into the neophyte becoming a better, more knowledgeable and more successful coach.

Florida is one of the most populated and geographically largest states in the union. According to a study published by the National Sporting Goods Association (2002), the state of Florida is one of the leading states when it comes to sports participation. Thus, Florida is an important state to consider when researching and studying coaching.

Research Questions

With the goal of exploring coaches’ learning experiences in interscholastic sports, the purpose of this study was to identify some of the major problems a beginning coach may encounter, and to suggest recommendations to prevent potential problems. Specific research questions which guided the study were:

  1. If you could start your coaching career over from the beginning, what things would you repeat or do exactly the same?
  2. What things would you not repeat if given a chance to begin again as a new coach?

Methodology

Respondents

Respondents for this study were head football and basketball coaches (n=78) of high schools in the Central Florida area. All high schools solicited in this study hold membership in the Florida High School Athletic Association (FHSAA).

Instrumentation

A survey instrument was developed and used in this study to gather demographic data on coaches at high schools in the Central Florida area. A small pilot study using approximately six coaches was conducted to test the validity and reliability of the instrument. Individuals in the pilot study were from two representative high schools within the Orange County School district. Subjects in the pilot study were asked to complete the questionnaire and comment on the thoroughness of the directions provided, ease of completion, and suitability of questions as they pertain to the content. Using the results of the pilot study, the survey instrument was updated to incorporate recommendations. Problems with the instrument were addressed and corrected.

The survey instrument consisted of 10 items containing closed-ended questions and four items containing open-ended questions (see Appendix C for the complete survey). Data was gathered for comparative purposes only. Confidentiality of responses was guaranteed to all respondents. The overall return rate of the survey was 37 percent, which included responses from 29 subjects.

Procedure

During the fall of 2003, head football and basketball coaches (n=78) from high schools in the Central Florida area were mailed a cover letter, consent form, questionnaire, and a stamped self-return envelope. The statistical software package, SPSS 11.0, was used to analyze the descriptive data.

Another method of gathering data was the review of related documents and archival records. Documents used to gather data included individual high school websites, research papers on coaching, and the National Federation of State High School Associations website. This method of data gathering provided complementary information to that obtained in the surveys. In this manner, the researcher could triangulate and cross-check data provided by the survey (Wolcott, 1994).

Results

The major areas of concern and responses, as self-reported by respondents, were in the following 10 categories: (1) relationships, (2) professional development, (3) conditioning & training, (4) organization & administration, (5) scheduling, (6) academics, (7) program promotion & fundraising, (8) facilities, (9) job choice, and (10) rules & accountability.

What Coaches Would Do Differently

Head coaches were asked to identify three things they would do differently if they could start all over again as a new coach. Responses listed below are based on the 10 categories that emerged from the research.

Relationships

23 of the 29 coaches that responded (79%) indicated that, if they had it to do all over again, they would do things differently in the area of relationships. Their responses included ways they would deal differently with assistant coaches, parents, student-athletes, the administration, and their own family.

Professional Development

3 of the 29 coaches (10%) indicated they would do things differently in the area of professional development. Their responses included ways they would enhance their growth by not pigeon holing themselves by positions coached, re-prioritizing their teaching and coaching roles, and working harder to learn the craft of coaching instead of taking it for granted.

Conditioning & Training

5 of the 29 coaches (17%) indicated they would do things differently in the area of conditioning and training. Their responses indicated that they would practice less, work to develop feeder programs, and reverse the way they introduce offensive and defensive strategies.

Organization & Administration

12 of the 29 coaches (41%) indicated they would do things differently in the area of organization and administration. Their responses ranged from issues involving budgets, pre-game meals, delegating responsibilities, getting rid of players, and handling written agreements.

Scheduling

7 of the 29 coaches (24%) indicated they would do things differently in the area of scheduling. Their responses indicated they would: not over-schedule, not schedule back-to-back games, not schedule as many tough opponents, practice more on the weekends, and like to have more control over their schedules.

Facilities

3 of the 29 coaches (10%) indicated they would do things differently in the area of facilities. Their responses indicated they would do more to improve the condition of their facilities.

Job Choice

8 of the 29 coaches (28%) indicated they would do things differently in the area of job choice. Their responses indicated they would: be more careful about the jobs they selected, and not coach as many sports.

Rules & Accountability

4 of the 29 coaches (14%) indicated they would do things differently in the area of rules and accountability. Their responses ranged from being stricter to being more flexible.

What Coaches Would Do the Same

Head coaches were asked to identify three things they would repeat or do exactly the same if they could start all over again as a new coach. Responses listed below are also based on the 10 categories that emerged from the research.

Relationships

17 of the 29 coaches that responded (59%) indicated that, if they had it to do all over again, they would do things the same in the area of relationships. Their responses included ways they would repeat similar behavior with assistant coaches, parents, student-athletes, the administration, school staff, and religious beliefs.

Professional Development

21 of the 29 coaches (72%) indicated they would do things the same in the area of professional development. Their responses included ways they would enhance their personal and professional growth by being life-long learners.

Conditioning & Training

17 of the 29 coaches (59%) indicated they would do things the same in the area of conditioning and training. Their responses indicated that they would: implement strength training programs, set team and individual goals, spend the majority of their time teaching the fundamentals, and work to develop and train young talent.

Academics

6 of the 29 coaches (21%) indicated they would do things the same in the area of academics. Their responses indicated they would: set academic goals, develop academic support programs, assist students with post graduation plans, and continue their own education.

Program Promotion & Fundraising

3 of the 29 coaches (10%) indicated they would do things the same in the area of program promotion and fundraising. Their responses indicated they would work to develop the image of their program.

Job Choice

7 of the 29 coaches (24%) indicated they would do things the same in the area of job choice. Their responses indicated they would: seek out a good mentor, seek out good talent, develop a network, and take any job to get into the profession.

Rules & Accountability

13 of the 29 coaches (45%) indicated they would do things the same in the area of rules and accountability. Their responses ranged from setting to enforcing rules.

Conclusions and Recommendations

This study examines coaches’ learning experiences by identifying some of the major obstacles beginning coaches may encounter. It also suggests ways to prevent potential problems by examining the knowledge of coaches. Specifically, this study looks at best practices in high school coaching and examines what works and what does not work.

Coaching is about more than “Xs” and “Os”. It is about influence and getting things done through other people. Thus, coaching is part art and part science. As such, the profession of coaching requires a specialized body of knowledge more specific to the sport and a more generalized body of knowledge across a wide range and sphere of influence. To be successful, coaches need to be knowledgeable of game strategy. They also need to be knowledgeable of the many roles a coach must undertake. Possessing this knowledge is crucial for a beginning coach.

This study implies that much of this knowledge can be learned from more experienced coaches. It not only identifies some of the major problems a beginning coach may encounter, it also suggests recommendations to prevent potential problems. To help expedite the learning curve of beginning coaches, we offer the following recommendations:

Build and maintain nurturing, supportive relationships. These relationships will include the school administration, assistant coaches, student-athletes, faculty, parents, and the coaches’ family. Work hard to educate everyone about the positive benefits of the athletic program. Communicate with these different groups on a regular basis and keep them informed of what’s going on. Strive to make them your ally. Demonstrate that you are an integral part of the school and a team player. Show them you are as interested in academic performance as you are athletic performance.

Continue the learning process through yearly professional development. Knowledgeable and well-trained coaches are the key to a successful sports program. Attend camps and clinics to keep current on the latest techniques and strategies. Study successful coaches. Find a mentor as early in your career as possible. Join and become an active member of a professional organization

Develop a cutting-edge conditioning and training program. To build a successful program, the coach must focus on developing the athletes to completely maximize their potential. Learn the latest techniques for developing speed, quickness, agility, jumping ability, explosiveness, reaction time, and strength. Set individual goals with each athlete and work with them to achieve their goals. Develop a feeder program that will provide program consistency. Spend the majority of practice time teaching and reinforcing the fundamentals.

Create a smooth-running organization with good administration skills. Beginning coaches must be aware of their wide range of duties. They are responsible for developing policies, scheduling practice and game times, planning budgets, ordering equipment, coordinate facility use, evaluating talent, record keeping and paperwork, arranging travel plans, scouting opponents, and arranging for medical care at events. They must develop a personal philosophy and create a system that will aid them in accomplishing all of their tasks. They must surround themselves with good people and learn how to delegate.

Schedule for success. Most new coaches underestimate the importance of scheduling. Creating a good schedule is extremely important for a coach’s success. Not many coaches get fired for who they played. They get fired for wins and losses. Set realistic goals based on the team’s ability. Contrary to public opinion, coaches should not always try to play the best teams. Sometimes they may need to play a few tune-up games. Every conference has at least four tough games (rivals). Always playing the best teams can quickly put the new coach on the path to becoming a loser. Scheduling is part art and part science. Where possible, work closely with the athletic director to create a favorable schedule.

Place academics first. It is vital that new coaches understand the big picture — the proper role of sports as a part of the total educational program of the school. The athletic program should function as a part of the whole curriculum and strive for the development of a well-rounded individual, capable of taking his or her place in modern society. At no time should the coach place the educational curriculum secondary in emphasis to the athletic program. New coaches should set academic goals, monitor student grades, and conduct an academic support program (i.e., study hall). They should push each student to attend college, regardless of the level. They should demonstrate their commitment to education by continuing their own education.

Increase attendance and revenue through promotions and fundraising. Coaches can get fans to focus on the sport program (i.e., attend more events) by first focus on them. Get their attention and get them involved by creating exciting promotions. Promotions and spirit activities help draw more people to the events. Incorporate fun things that meet the needs of the fans or target audience. Food or cash prizes work well. Conduct contest at half time and during intermissions to eliminate idle time. Make the contest as interactive as possible. Give-aways are a good way to grab attention and boost attendance. Develop a strong booster club to generate revenue and ideas. Have coaches, team members, and booster club members promote and/or participate in activities.

Improve facilities to improve performance. Experienced coaches know that state-of-the-art facilities and equipment can help them take their teams sport performances to the next level. New coaches should be knowledgeable about the latest in facility design and equipment for their sport. They should get involved in the planning of any new athletic facilities or renovations. Give input about weight rooms, showers, locker rooms, equipment rooms, training/therapy rooms, team meeting rooms, multi-purpose rooms, and athletic playing and practice fields and courts. It is especially important for them to attend construction meetings and review drafts and blue prints.

Be proactive in making job choices. New coaches should consider all of the possibilities or alternatives before taking a job. They should not make career decisions hastily, but instead should plan for the future. Look into the future and determine what you want to be doing in 5, 10, 20, and 30 years and set goals. Then prepare for potential opportunities. Several possibilities and alternatives to consider are:

  1. Do you want to be an assistant coach or head coach?
  2. Do you want to coach at the high school level forever or coach at the college level one day?
  3. How long do you want to stay at one location?
  4. Do you have a good network and know the right people?
  5. What type of athletes do you want to coach?
  6. Do you have the support of the administration?
  7. Do you want to teach and coach?

The main point is for a new coach to be aware of all the career coaching possibilities and then to determine priorities.

Don’t have a lot of rules. Most coaches have too many rules. Some coaches don’t like long hair. Some coaches don’t like earrings. Some coaches don’t like tattoos. Duke University coach Mike Krzyzewski (2000) says “Too many rules get in the way of leadership and box you in. I think people sometimes set rules to keep from making decisions.” The most important thing a coach can do early in a season, or when they first take a new job is to establish basic ground rules for what is acceptable and non-acceptable behavior. Don’t have too many rules. Three rules a coach should have are:

  1. be good people,
  2. be on time, and
  3. practice hard and give your best effort

When coaches establish a rule, they must stick to it. On championship level teams, players recognize that the “team” is more important than the “individual”.

References

  1. Krzyzewski, M. (2000). Leading with the heart: Coach K’s successful strategies for basketball, business, and life. New York, NY: Warner Books.
  2. Lynch, J. (2001). Creative coaching. Champaign, IL: Human Kinetics.
  3. Martens, R. (2004). Successful coaching. Champaign, IL: Human Kinetics.
  4. National Sporting Goods Association. (2002). Sports Participation in 2002: State-By-State. Mt. Prospect, IL: Author.
  5. O’Donnell, C. (1998, April). So you want to be a college coach . make sure you are good enough and then become the best coach you can be. Scholastic Coach & Athletic Director, 67 (9), p. 45.
  6. Wolcott, H. (1994). Transforming qualitative data: Description, analysis, and interpretation. Thousand Oaks, CA: Sage.

APPENDIX A

Figure 1. What Coaches Would Do Differently

Figure One


APPENDIX B

Figure 2. What Coaches Would Do the Same

Figure Two


APPENDIX C

Coaching Survey

1.

Gender

_____ Male

_____ Female

2.

Race

_____ African-American

_____ Asian/Pacific Islander

_____ Arab

_____ Chinese

_____ Hispanic/Latino

_____ Indian

_____ Japanese

_____ Korean

_____ Native-American

_____ White/Non-Hispanic

_____ Other (specify) _________________

3.

Age

_____ 18 – 29 years

_____ 30 – 49 years

_____ 50 and over

4.

Education

_____ Doctorate

_____ Masters

_____ Bachelors

_____ Associates

_____ Some college

_____ High School

5.

Income

_____ $50,000 and over

_____ $40,000 – $49,999

_____ $30,000 – $39,999

_____ $20,000 – $29,999

_____ $10,000 – 19,999

_____ $5,000 – $9,999

_____ $2,500 – $4,999

_____ Under $2,500

6.

School Type

_____ Private

_____ Public

7.

School Community Size

_____ Urban

_____ Suburban

_____ Rural

8.

Years in your current coaching position

_____ Under 5 years

_____ 5 – 9 years

_____ 10 – 19 years

_____ 20 – 29 years

_____ Over 30 years

9.

Years coaching (any level)

_____ Under 5 years

_____ 5 – 9 years

_____ 10 – 19 years

_____ 20 – 29 years

_____ Over 30 years

10.

Occupation

_____ Teach and coach at the same school

_____ Teach and coach at different schools

_____ Work in the private sector and coach

11.

Who is your major coaching influence?

12.

If you could start your coaching career over from the beginning, what three things would you repeat or do exactly the same?

13.

What three things would you not repeat if given a chance to begin again as a new coach?

14.

What are the five biggest challenges coaches face today? Please rank order your answers.

2015-03-24T09:51:58-05:00June 4th, 2005|Contemporary Sports Issues, Sports Coaching, Sports Management, Sports Studies and Sports Psychology|Comments Off on Considerations for Interscholastic Coaches
Go to Top