ABSTRACT
The purpose of this study was to examine the effects of a three-week imagery and video imagery intervention program on the throwing accuracy of individual baseball pitchers. A secondary purpose of this study was to investigate whether differences in accuracy response characterize both low- and high-ability imagers. A sample of pitchers (n=30) were asked to take the Movement Imagery Questionnaire–Revised; study participants were randomly selected from the highest and lowest 20% of the group. The participants were obtained from high school and college teams within southeastern Georgia (n= 6). Following the first week of baseline measurements, 2 high-ability and 2 low-ability imagers took part in a three-week video imagery and imagery intervention program. One participant from each group together constituted a control group, which was asked only to try their best when throwing for the study’s accuracy measurements. Results showed that 2 participants demonstrated an increase in performance, while all participants expressed a desire to continue to use imagery for its various effects. Suggestions for future research and further insight are discussed.
INTRODUCTION
Imagery has been shown to be very effective for improving accuracy in sport. Thomas and Fogarty (1997) found that imagery combined with positive self-talk improved not only putting performance, but psychological factors as well. Woolfork et al. (2005) found that positive imagery participants, in comparison to negative imagery training and control group participants, experienced significant increases in putting performance. Moreover, imagery has been shown to positively enhance free-throw shooting among collegiate basketball players. Kearns and Crossman (1992), Shambrook and Bull (1996), Templin and Vernacchia (1993, 1995),Stewart (1997), and Carboni, Burke, Joyner, Hardy, and Blom (2000) have determined imagery to be to some degree effective for most individuals at enhancing free-throw performance.
Much of the research cited above utilized a single subject design. This type of design has proved important in applied sport psychology, demonstrating improvement in individual cases that might be overlooked by traditional group analysis (Shambrook & Bull, 1996). For instance, when a multiple baseline design is used, a conclusion could be drawn that any effects were due to the specific intervention (Bryan, 1987, p. 286). The single subject design, in contrast, allows for individual analysis of the imagery implementation and a way to tailor the intervention to the individual (Stewart, 1997).
Visualization theories have not always been applied to sport performance; they began in the field of cognitive and spatial awareness research. Bess (1909) was among the first researchers of the topic and is credited with developing the measuring system for visualization. The Bess Scale addresses differences in individual imagery ability, drawing on cognitive theory of imagery and tied closely to the understanding of the term kinesthetic imagery(Schiffman, 1995).
A pitcher may be asked to imagine the ball in hand before a throw, to feel the laces and texture on the palm, maybe even to brush the dirt off, as if the ball was just grabbed from the ground. Bess notes that the image should be as clear and detailed as possible, and his Bess Scale measures the vividness of the visualizations practiced with seven classifications of vagueness and vividness. However, Wilson & Barber (1981) found that individuals can vary greatly in their ability to visualize, even when their Bess Scale scores are alike. Moreover, Stoksahl and Ascough (1998) also found that some athletes were very detailed in their imaging, while others were very vague; they concluded that the less vivid images may not be as effective for enhancing performance. Therefore, athletes with lower imagery ability may not reap full performance-enhancement benefits from imagery training. Such findings provide one more reason to investigate the effects of video imagery: Individuals who lack vivid imaging skills may find that a video re-enactment of the task allows them to see the desired performance very clearly, aiding mental preparation for an actual event or task demonstration.
Little research appears in the literature which has examined the effects on performance of internal video imagery, or video depicting an athlete’s internal perspective during performance. However, at least some research has integrated videotape modeling with imagery training. Hall and Erffmmeyer (1983) investigated female high school basketball players who were assigned to a video modeling/imagery group and a relaxation/imagery group. Results can only be attributed to a combination of psychological skills, as they were compounded within the study, but it was concluded that the video modeling/imagery group demonstrated better performance in foul shooting, compared to the relaxation/imagery group. Little research seems to exist exploring internal video imagery in other sports contexts, specifically baseball and, more specifically, pitching accuracy.
While general research on imagery is vast, this study seeks to investigate the effects of cognitive imagery and video imagery on one phenomenon: the throwing performance of baseball pitchers. A secondary purpose of this study is to see whether low-ability imagery and high-ability imagery are associated with distinct performance responses following video and cognitive imagery interventions.
METHOD
Participants
The study participants were 6 baseball pitchers from southeastern Georgia. They were selected from the region’s high schools and colleges. Four males, 2 current college athletes and 2 current high school athletes, took part in the study. The participants’ mean age was 19.8 years, with ages ranging from 16 to 22 years. Only athletes currently on pitching staffs of high school or college baseball teams were utilized. All participants had been baseball athletes for at least the previous 2 years, at either the high school or college level. All were asked to return a signed consent form before participating in the study; participants under 18 years of age were asked to return a parental consent form before participating. The consent form assured participants of confidentiality, briefed them on the study’s purpose, and listed the risks and benefits of participation. Contact was made with each institution, informing participants, parents, and coaches that athletes’ participation was completely voluntary.
Apparatus
A Samsung Sports Camcorder SC-X205L/X210L was used to record all accuracy-measurement sessions, in order to ensure that accurate points were recorded for each pitch. At no time, however, was the pitcher himself captured in these recordings. The Samsung Camcorder SC-X205L/X210L external helmet camera module, used to capture recordings of an accurate pitch from the internal perspective of the pitcher, was used in the video imagery interventions.
Instrumentation
Throwing performance was measured with an Easton© 9-square Strike Zone Target, which was placed on the plate in the visitors bullpen at Georgia Southern University, emulating an actual game. Each section of the target was assigned a point value, ranging from 1 to 10; 10 was the value for the center box, with lower values designated for squares nearer the edges of the target. Point values between the ranges of the surrounding boxes values were assigned to the dividing lines themselves. Each pitching accuracy measurement session was videotaped, allowing the researchers to review each pitch at leisure, ensuring the correct assignment of points; however, only the target and the end result of the pitch were captured on videotape during measurement sessions.
Prior to the study, an imagery ability test was given to a group of 30 high school and college baseball pitchers, to identify athletes with high- and low-ability imagery skills who might become part of the study sample. The Movement Imagery Questionnaire- Revised (MIQ-R) was used to measure the athletes’ imagery ability (see Appendix A). Hall and Martin (1997) developed the MIQ-R, a revision of Hall and Pongrac’s Movement Imagery Questionnaire, or MIQ (1983), in order to assess individuals’ capacity to generate visual imagery and also kinesthetic (or movement) imagery. The present researchers have determined the MIQ- R to be a valid and reliable revision of the original instrument: Earlier work has established significant correlations for the MIQ-R’s visual and kinesthetic scales. For the MIQ, Hall, Pongrac, and Buckholz (1985) obtained a test–retest co-efficiency score of .83; in terms of internal consistencies, a score of .89 was obtained for the visual scale and a score of .88 was obtained for the kinesthetic scale (Atienza et al., 1994).
A Post Study Imagery Questionnaire was distributed to the present study’s participants at the completion of the investigation. This questionnaire sought feedback from each pitcher as to prior experience with imagery, present attitude toward imagery, and likelihood of future imagery use. Moreover, it asked the athletes to think about effects of imagery occurring in dimensions other than performance. The questionnaire asked these questions, specifically: Did you at any time use imagery outside of this study? How do you feel about the use of imagery in general? Do you feel it helped you and how so? Do you feel there was a difference between the two types of imagery and if so what were they? Will you continue imagery use?
Procedures
The pitchers’ completed MIQ-R instruments; later on, their scores were collected and recorded by number, both to protect confidentiality and to help ensure random selection of participants. Pitchers completing the MIQ-R were also given a brief explanation of what the instrument covered and directions for providing answers. A 7-point Likert scale was employed for each question, and the points assigned each question were totaled for each participant. Using the scores obtained, 3 participants were chosen at random from the top 20% of scores, and another 3 were selected randomly from the bottom 20%; the 6 were asked to participate in the study. By omitting participants with middle-ranking scores, the study sought to secure a sample that truly represented high- and low-ability imagery skills. Participants signed a consent form or obtained written parental consent prior to participating.
Participants were asked to meet with an “observer” 5 times during the first week of the study, the period during which a stable baseline was to be established for each pitcher; after a baseline existed (which ideally required 1 week but in fact might have required more time), participant and observer were to meet 4 times during each of the next 3 weeks. The 3 weeks constituted the invention portion of the study. Prior to the intervention, each pitcher’s throwing performance was measured 5 times a week, until he had demonstrated a stable baseline, defined as an average score displaying no more than a 2-point variance in at least 3 consecutive trials. The first-week, baseline portion of the study was followed by imagery interventions beginning in the second week; each imagery intervention required 6 visits, or one and one-half weeks. Measurements were taken 4 times a week, post imagery session, during the imagery and video imagery intervention programs, until the study’s completion. Throwing-performance measurements were determined by averaging a pitcher’s scores for 10 pitches in the visitors bullpen of an NCAA Division I university. The measurement apparatus was placed in front of the bullpen home plate. During the baseline portion of the study, the Samsung Sports Camcorder SC-X205L/X210L was used to create video imagery segments for use during the intervention portion, with each pitcher wearing the “helmet-cam” module (placed aside his head, at eye level) and capturing his own internal perspective on the throwing of an accurate pitch. (At no time was any pitcher himself captured in a recording.) The module is worn comfortably on a headband, and no participate indicated discomfort during its use. The study design incorporated counterbalancing to eliminate sequence effects.
Participant 1 and Participant 4 experienced the cognitive imagery intervention during Week 1 of the intervention portion of the study, followed by video imagery intervention beginning in the middle of Week 2 (the two athletes’ seventh study session). Participant 2 and Participant 5 experienced video imagery sessions as the initial intervention during Week 1 of the study’s intervention portion. They participated in cognitive imagery intervention during Session 7 through Session 12. The throwing accuracy of Participant 3 and Participant 6 was measured 4 times a week, and they received no intervention, serving as a control group.
The university’s Mental Edge Training Facility was used for the video and cognitive imagery sessions, which were conducted individually (rather than in groups) during scheduled time slots. An imagery session was of a 10-minute (approximately) duration. During the video imagery interventions, participants were asked to watch the previously recorded 10-point pitch while imagining accompanying sensations, to include sounds, smells, tastes, and textures, in as much detail as possible. During the cognitive imagery interventions, in contrast, they were asked to imagine the 10-point pitch as vividly as they were able, again using the five senses as much as possible. At the study’s end, each participant completed the Post Study Imagery Questionnaire, providing insights into his attitudes towards imagery generally, as well as his unique responses to imagery practice, performance, or similarly related issue. The Post Study Imagery Questionnaire also attempted to determine whether and why players would continue to practice imagery techniques.
Data Analysis
Data were represented graphically to describe each participant, then reviewed for practical differences in throwing accuracy. Ocular statistics (Carboni et al., 2000) were reviewed by a group of trained researchers to determine actual changes in throwing accuracy and to provide control of the researcher’s bias. Qualitative results of the Post Study Imagery Questionnaire were collected and reported.
RESULTS
Data collected for this study were evaluated using mixed methodological procedures from ocular statistics (Carboni, et al, 200); additionally, they are explored in qualitative terms. Figures 1–6 will illustrate the participants’ throwing performance scores over the length of the study. Figures 7–12 will illustrate perfect pitch count scores over the length of the study.
Table 1 presents the participants’ throwing performance scores, with standard deviations. Table 2 presents a count of perfect pitches thrown by the participants.
| Table 1 Participants’ throwing accuracy scores* |
||||||||||||||||||||||||||||||||||||||||||||||||||||||||||||||||||||||||||||||||||||||||||||||||||||||||||||||||||||||||||||||
|
* Standard deviations in parentheses.
| Table 2 Perfect pitches thrown |
||||||||||||||||||||||||||||||||||||||||||||||||||||||||||||||||||||||||||||||||||||||||||||||||||||||||||||||||||||||||||||||
|
The participants provided qualitative reports concerning imagery effectiveness (with the exception of Participant 3 and Participant 6, the control group receiving no intervention).
Participant 1
Participant 1 initially received cognitive imagery intervention (Cognitive Imagery First). Participant 1 had demonstrated a 2.9 (SD= 4.5, 3.6, 3.9) throwing performance baseline during the first week of the study; with one exception, each of his throwing performance scores fell above that baseline, ranging from 3.2 (SD= 3.9) to 3.9 (SD= 4.6) (See Table 1). The exception occurred in Session 8, for which the participant’s accuracy score was 1.4 (SD= 1.8). While this score was below the participant’s baseline, it was not beyond the margins of implied change set, for this study, at .9 (See Figure 1).
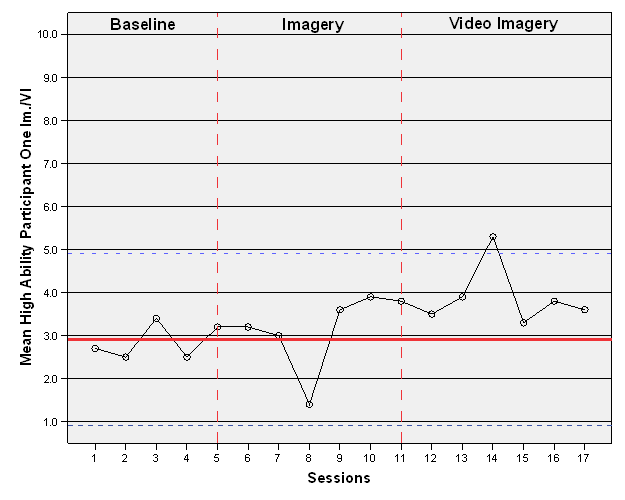
Figure 1. Participant 1 (high-ability): Accuracy scores (imagery/ video Imagery)
As the participant completed subsequent video imagery interventions, the accuracy scores remained above the baseline, ranging between 3.5 (SD= 3.7) and 5.3 (SD=3.7); throwing performance scores in Session 14 reached 5.3 (SD= 3.7), exceeding the margins of implied change, set at 4.9. During the baseline portion of the study, Participant 1 recorded between 1 and 2 perfect pitches (See Table 2), a rate maintained throughout the study, except during the imagery intervention portion, Sessions 6 through 11. During the imagery intervention portion, this participant’s perfect pitch count ranged from 0 to 3 (see Figure 7).
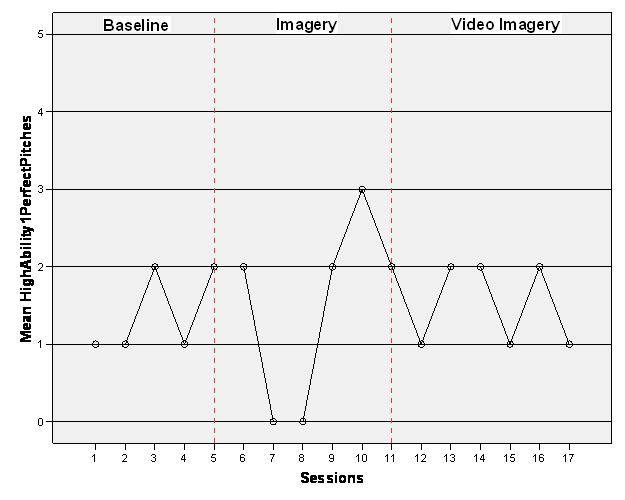
Figure 7. Participant 1 (high-ability): Perfect pitches thrown
Post Study Imagery Questionnaire
Participant 1, who said he had never used imagery prior to entering this study, reported that he used imagery while playing in a game during the period of the study. He stated, “I would like to continue using imagery and practice it more before games. I feel like it really helps when I start rushing.” Participant 1 further reported that breathing techniques included in the relaxation portion of the imagery script helped him manage momentum and refocus his effort. Participant 1 expressed the opinion that video imagery was relatively more helpful in bringing about desired outcomes, although he found it difficult to mentally re-create accompanying sensations during the video imagery sessions.
Participant 2
Participant 2 initially received video imagery intervention (Video Imagery First). Participant 2 had established a baseline score of 1.0 (SD= 1.9) within the first week of the study; his throwing performance scores increased slowly during the first intervention, ranging from 1.4 (SD= 2.3) to 4.1(SD= 5.1) (see Table 1). Each of Participant 2’s throwing performance scores fell above the baseline; during Session 11, his score exceeded the established margins of implied change (see Figure 2).
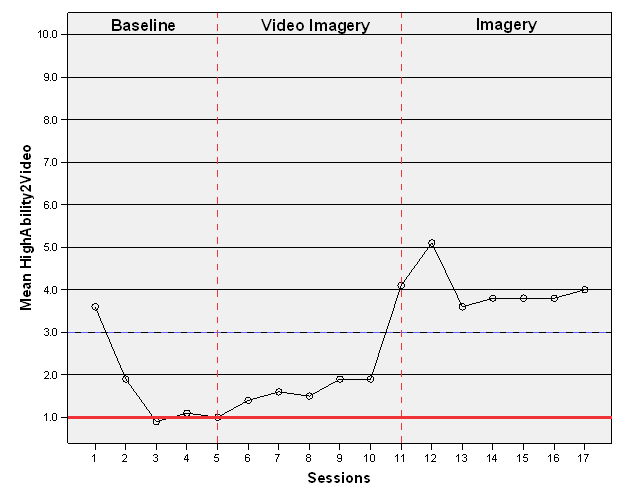
Figure 2. Participant 2 (high-ability): Accuracy scores (video imagery/ imagery)
During Session 12 through Session 17 (the imagery intervention), all of Participant 2’s scores remained above the implied margin of change, which was set at 3.0; his scores ranged from 4.0 (SD= 3.7) to 5.1 (SD= 4.1). While establishing a baseline score during Session 2 through Session 5, Participant 2 recorded from 0 to 1 perfect pitch per session (See Table 2). During the video imagery intervention, his perfect pitch count remained at 0 until Session 10, when he threw 4 perfect pitches; in Session 11, he threw 1 perfect pitch. During the imagery intervention, which was his final intervention, Participant 2 threw either 2 or 3 perfect pitches per session (see Figure 8).
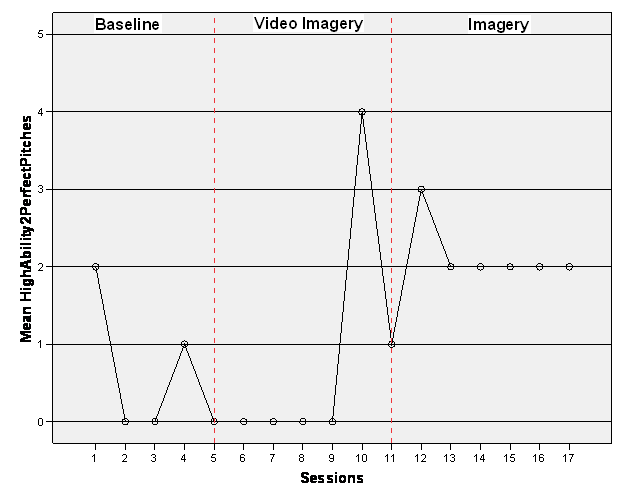
Figure 8. Participant 2 (high-ability): Perfect pitches thrown
Post Study Imagery Questionnaire
Participant 2 reported never having used imagery prior to the study, but said he is currently employing it during games because his pitching performance improved following the start of the study. He stated, “I haven’t walked anybody, it must be working. I started trying to see the ball go where I want it to before I throw the pitch, and it really seems to help.” Moreover, Participant 2 expressed a desire to continue using imagery, for its benefits both to his accuracy and his confidence.
Participant 3
Participant 3 did not participate in any intervention (No Interventions). He had established a baseline score of 3.8 (SD= 3.6) within the first week of the study. During Session 6 through Session 11, his throwing performance scores ranged from 1.0 (SD= 1.9) to 4.1 (SD= 3.9) (see Table 1). All of these scores fell below his baseline score, except the Session 11 score of 4.1 (SD= 3.9). During Session 10, the participant scored 1.0 (SD= 1.9), dropping below the margin of implied change, set at 1.8 (see Figure 3).
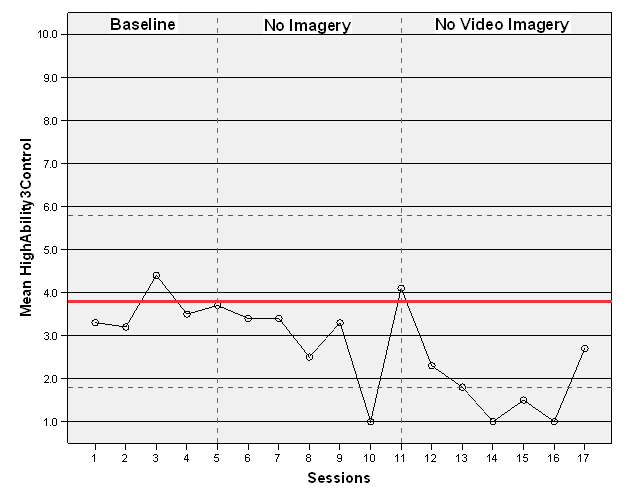
Figure 3. Participant 3 (high-ability): Accuracy scores (control; no intervention)
Participant 3’s throwing performance scores in Sessions 12–17 ranged from 1.0 (SD= 1.9) to 2.7 (SD= 4.3), falling below his established baseline. During Session 13 through Session 16, this participant’s scores descended to the level of the margin of implied change. During the baseline portion of the study, Participant 3 threw either 2 or 3 perfect pitches per session. Across the remainder of the study, however (Sessions 6–17), Participant 3 threw 0, 1, or 2 perfect pitches per session (see Figure 9).
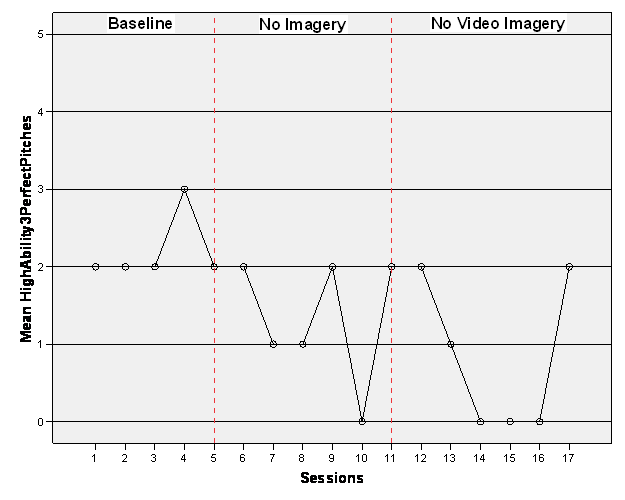
Figure 9. Participant 3 (high-ability): Perfect pitches thrown
Participant 4
Participant 4 received cognitive imagery intervention first (Cognitive Imagery First). Participant 4 had established a baseline score of 4.3 (SD= 3.8) in the first week of the study, and during the first intervention, his throwing performance scores largely fell below that baseline, ranging from 1.8 (SD= 2.4) to 4.5 (SD= 4.7) (see Table 1). Session 11 comprised an exception.
Participant 4’s Session 11 score was 4.5 (SD= 4.7). During Session 7 and Session 8, the participant’s scores were 1.8 (SD= 2.4) and 2.1 (SD= 2.0), respectively, falling below the implied margin of change, which was set at 2.3. During Sessions 12–17, Participant 4 received video imagery intervention. His throwing performance scores for those sessions ranged from 3.3 (SD= 2.4) to 4.5 (SD= 3.5), and most fell below his baseline score, although his scores for Session 16 and Session 17 was 4.5 (SD= 4.1, 3.5) (see Figure 4).
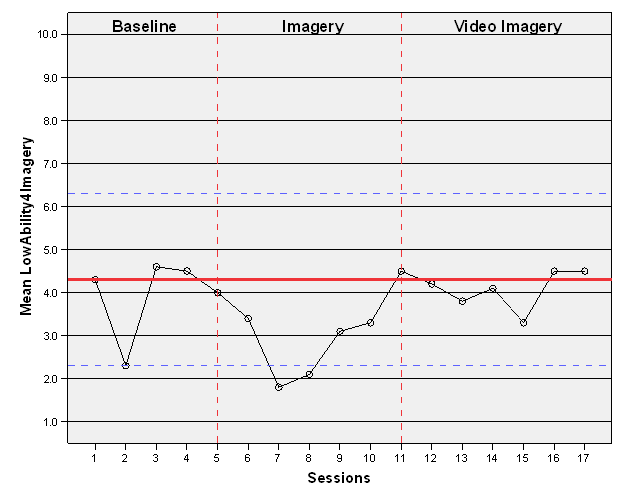
Figure 4. Participant 4 (low-ability): Accuracy scores (imagery/video imagery)
During the baseline portion of the study, Participant 4 threw between 0 and 2 perfect pitches per session, a range he would go on to maintain for the duration of the study, excepting only Session 11, during which he threw 3 perfect pitches (see Figure 10).
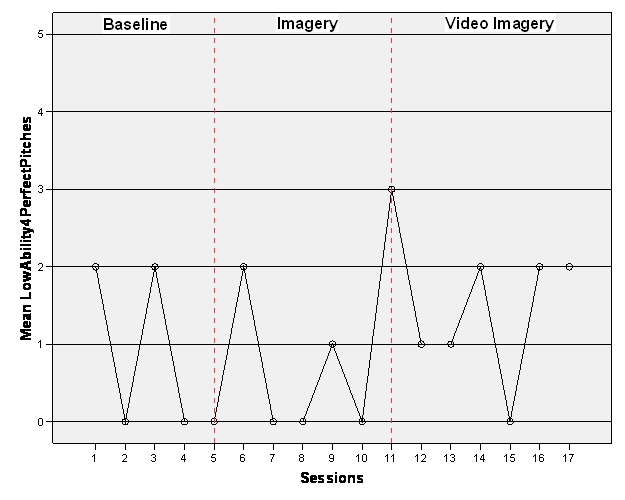
Figure 10. Participant 4 (low-ability): Perfect pitches thrown
Post Study Imagery Questionnaire
Participant 4 reported that he had used imagery prior to this study; he furthermore reported having difficulty sustaining the vividness of imagery. He went on to express a preference for having a detailed imagery script read to him, due to such reading’s capacity to generate vivid images. Participant 4 stated, “I usually do imagery before my games that I know I’m going to be pitching in. It helps me get focused, and I want to get better at it.” Participant 4 expressed a desire to continue imagery use, but made no note of any distinction between the cognitive and video approaches.
Participant 5
Participant 5 received video imagery intervention first (Video Imagery First). Participant 5 had established a baseline score of .8 (SD= 1.3) in the first week of the study. His throwing performance scores during the first intervention ranged from 1.2 (SD= 3.2) to 4.8 (SD= 4.6), above the baseline score he had produced (see Table 1). In Session 8 and Session 9, Participant 5 recorded scores of 3.3 (SD= 4.7) and 4.8 (SD= 4.6), respectively, exceeding the margin of implied change, which was set at 2.8 (see Figure 5).
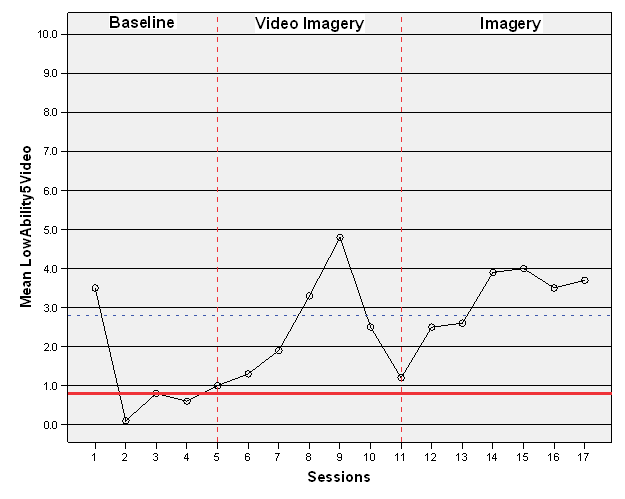
Figure 5. Participant 5 (low-ability): Accuracy scores (video imagery/ imagery)
During Session 12 through Session 17 (the imagery intervention portion of the study), Participant 5’s throwing performance scores ranged from 2.5 (SD= 4.0) to 4.0 (SD= 4.1). All scores thus fell above his baseline score, and his scores in Sessions 14–17 exceeded the margin of implied change, coming in between 3.5 (SD= 4.6) and 4.0 (SD= 4.1). During the baseline portion of the study, Participant 5 threw 0 perfect pitches. During Session 9 in the video imagery portion of the study, he threw 3 perfect pitches; in Session 10 he threw 1 perfect pitch; in Session 11 he again threw 3. Over Sessions 12–17, the participant threw anywhere from 0 to 2 perfect pitches (the 0 was recorded during Session 12; for each of the next 5 sessions, a 1 or 2 score was recorded; see Figure 11).
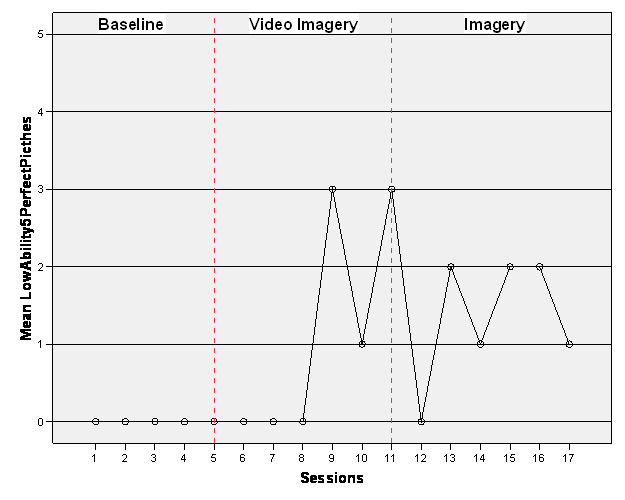
Figure 11. Participant 5 (low-ability): Perfect pitches thrown
Post Study Imagery Questionnaire
Participant 5 reported never having used imagery prior to the study. He reported considering adherence to use of pre-game imagery following conclusion of the research project. Participant 5 reported noticing not only improved throwing accuracy, but increased self-confidence as well. He stated, “When I stop between each pitch, take a breath and see where I want the ball to go, it helps me to refocus. Also, when I do throw a bad pitch, it doesn’t carry over as much. I don’t get caught in a bad momentum. I am more able to release the last pitch and trust the next one, because I’ve seen myself throw it where I want to put the ball (in my head) many more times before. I know I can do it.”
Participant 6
Participant 6 belonged to the control group (No Intervention) and established a baseline score of 3.4 (SD= 3.1) during the study’s first week. His throwing performance scores ranged from 1.0 to 4.4 over Session 6 though Session 11 (see Table 1). With the exception of a 4.4 (SD= 3.4) throwing performance score in Session 9, Participant 6’s subsequent scores fell below his baseline score. During Session 10, Participant 6 recorded a throwing performance score of 1.0 (SD= 1.9), below the set 1.4 margin of implied change (see Figure 6).
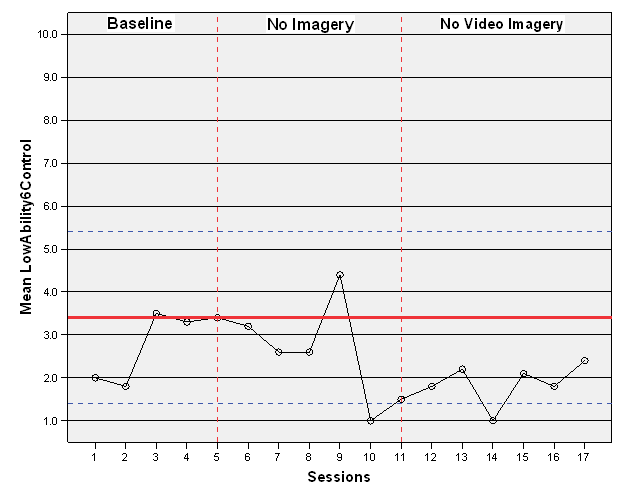
Figure 6. Participant 6 (low-ability): Accuracy scores (control; no intervention)
Participant 6’s throwing performance scores for Sessions 12–17 were between 1.0 (SD=1.9) and 2.4 (SD= 3.6), all falling below the baseline. Moreover, in Session 14, the participant scored a 1.0 (SD= 1.9), which fell below the margin of implied change. While establishing his baseline score for this study, Participant 6 threw 0 perfect pitches. In Sessions 6–11, he threw from 0 to 2 (in Session 9) perfect pitches per session. For the remainder of the study (Sessions 12–17), he threw 0 to 1 perfect pitch per session (see Figure 12).
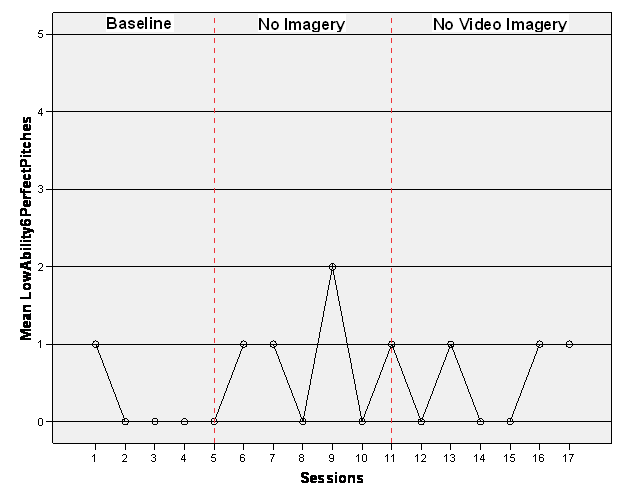
Figure 12. Participant 6 (low-ability): Perfect pitches thrown
DISCUSSION
The purpose of the present study was to see whether imagery would have an effect on the throwing performance of individual baseball pitchers. Further, the present study sought to determine if individual variation in ability to “image” is associated with distinct responses to cognitive imagery interventions and video imagery interventions. By the end of Session 9, study Participants 1, 2, and 5 demonstrated higher scores (as compared to their individually established baseline scores) for throwing accuracy. This result parallels similar single subject sport-and-imagery research (Kearns & Crossman, 1992; Munroe-Chandler, Hall, Fishurne, Shannon, 2005; Shambrook & Bull, 1996; Templin & Vernacchia, 1993, 1995; Stewart, 1997, Carboni et al., 2000;). There should be further investigation into the effectiveness of brief interventions, because no research to date answers the old question of how frequent and how long intervention must be to produce the desired result (Cumming, Hall, Shambrook, 2007; Thelwell, Greenless, & Weston, 2006). The suggestion has been made that, as in the realm of physical skills, psychological-skills practice effects positive change only after an extensive investment of time (Weinberg & Williams, 2001). Thelwell, Greenless , and Weston (2006) found that combining three types of intervention—imagery, self-talk, and relaxation—produced results within a 3-day period, when 1 day of imagery training was provided and when measures were taken once weekly over a 9-match period. Murphy (1990) recommends intervention sessions of no more than 10 minutes’ duration, and Weinberg and Gould (2007) suggest providing intervention 3 to 5 times a week. Bull (1995) found that positive results ensued from a 4-week training period featuring 8 training sessions. Some researchers have examined intervention frequency and length by leaving participation to the discretion of the participant and recording objective reports; sessions as brief as 1 minute were noted (Carboni et al., 2000). Cumming, Hall, and Shambrook (2007) concluded that overall use of imagery could be increased with interventions as brief as a “workshop.” Findings from the present study indicate that, to be effective for specific tasks such as accurate pitching, imagery interventions can be as brief as 10 minutes in length, conducted 4 times weekly for 3 weeks.
The present study did not find participants to be affected distinctly by the two types of intervention (cognitive and video). The higher throwing performance score recorded for the final 6 sessions of the study are believed to reflect the lengthening period of time during which participants had practiced imagery practice, rather than to the type of intervention, since all participants receiving intervention responded similarly, whether they were in the Cognitive Imagery First group or Video Imagery First group. Gordon, Weinberg, and Jackson (1994) found similar results, investigating “internal” as opposed to “external” imagery. Future research into the effects of multiple interventions should seek to determine the relationship between effectiveness and time invested in each intervention.
Research has shown that imagery ability is a large determinant of how an individual’s physical performance will respond to imagery interventions (Hall, 1998). In the present study, however, scores for Participant 2 and Participant 5 (on both throwing accuracy and perfect pitches) improved more than they did among the other participants. That Participant 2 and Participant 5 succeeded more markedly with imagery use cannot, however, be attributable to higher-ability imagery, because Participant 2 was a high-ability imager while Participant 5 was a low-ability imager. Any individual, regardless of imagery ability, can benefit from imagery practice, although those with lower ability may continue to experience greater difficulty creating and controlling vivid imagery (Magill, 2007). Each high school level participant from the present study had a baseline score for throwing accuracy that was lower than the lowest such score established by a college level participant. Isaac and Marks (1994) and Piaget and Inhelder (1971) concur that imagery ability is developed by age 7. Moreover, Payne and Isaacs (1995) report that the highest level of cognition and abstract thinking develops at age 11–12. Participants 2 and 5 had a mean age of 17, beyond the developmental period and ranking them developmentally equal to the college level participants. The distinct intervention responses of Participants 2 and 5, then, are not due to the basic development of ability to image. Research on imagery use has found differences associated with subjects’ athletic competitive levels (Barr & Hall,1992; Salmon, Hall, & Haslam, 1994; Vadocz et al., 1997). These differences seem to be shaped by factors like years of experience, degree of motivation to play, degree of motivation to use imagery, and ability to create and control images.
Thelwell, Greenless, and Weston (2006) discuss ways in which distinct levels of goal orientation affect players’ levels of investment in imagery use. Research also finds that athletes exhibiting moderate to high levels of task and ego orientation become more invested in imagery use, in turn increasing how often they practice imagery (Cumming, Hall, Gammage, & Harwook, 2002; Harwood, Cumming, & Hall, 2003). Bull (1995) examined the effects of a 4-week mental training program on varsity athletes, finding that better-motivated athletes were likelier to adhere to an imagery program, and that less-seasoned athletes were likelier to be the better motivated. It is possible that Participants 2 and 5 in our study, being at one of the earliest stages of an athletic career, were better motivated than Participants 1, 3, and 4, who were playing what they anticipated would be the final season of their careers.
Motivation can also be affected by fatigue and overtraining. The participants in the present study all were at mid-season, obligated to a vigorous training schedule as well as to the study sessions. At least one point during the study, every participant reported feeling fatigue or exhaustion, and this might have affected their concentration and performance. A perceived imbalance between demands on athletes and their response capabilities sometimes creates the negative physical and emotional state known as burnout (Creswell & Eklund, 2006). As Creswell and Eklund (2006) state, insufficient “rest and recovery periods” will also help generate negative experiences. Participants in the present study might possibly have found that study-related testing and intervention consumed the time they normally would use for recovery and rest, which could account, to some degree, for periodic “off” performance, including uncharacteristically low accuracy scores, trending down of accuracy scores, loss of interest in the study, or transfer of effort from the study to some other task. The performance of Participant 3 and Participant 6 support such an interpretation; these two athletes received no intervention and saw their performance fall off over time. “Burnout” may also help describe the expressed attitudes of Participants 1, 3, 4, and 6.
The study’s timing during the athletes’ season may help explain any shortages of focus or concentration on their part, but additional distractions should also be considered. During video imagery intervention sessions, for example, certain participants showed clear difficulty in focusing when they opened their eyes at the conclusion of the relaxation portion in order to view video. The discrepancy arose even though all of the imagery sessions took place in the university’s Mental Edge Training Facility, where each participant was assured of experiencing interventions of identical length. To better maintain focus and a relaxed state, future research might employ a different viewing method (e.g., use a dark room into which video is introduced from outside or use virtual-reality gear). Furthermore, researchers would be well advised to employ a vivid script that helps participants to incorporate as many types of sensation as possible (Thelwell, Greenless, & Weston, 2006). The script used in the present study instructed participants to “see” only the target’s center box, which perhaps explains in part why Participant 2 and Participant 5 were able to throw more perfect pitches (see Figure 8 and Figure 11).
For the present study, throwing performance was defined as a pitcher’s ability to throw a ball at a specified area deemed the target. In measuring throwing performance, the mean score for the 10 pitching efforts made each session was recorded and graphically represented. Perfect pitches were defined as those hitting the center target, and they too were recorded and graphically represented; a perfect pitch received a score of 10 points.
There are various definitions of what performance enhancement actually is. Some individuals may look for greater consistency, more pitches thrown closer to target, when seeking evidence of performance enhancement. Others may see enhanced performance in a combination of more pitches thrown at the actual target, and lower-scoring pitches. For the present study, the mean score and number of perfect pitches thrown for each session were used to measure performance response. During cognitive imagery interventions, participants were asked to envision throwing only to the center box, while during video imagery interventions, they watched tapings of pitches thrown to the center box. An increase in pitches to the center box was, for this reason, said to indicate imagery intervention’s positive effects on throwing performance.
Two limitations on the present study resulted from the data collection process. First, during the intervention sessions, participants were exposed to extraneous noise, although none directly identified this as a distraction. In future studies, areas free of extraneous noise should be employed. Second, when a participant was unable to join in throwing performance measurement or imagery intervention session during daylight hours, the researchers accommodated his schedules by conducting these activities after dark, an inconsistency which, by potentially affecting vision, perhaps also affected success. Furthermore, time of day bears on the level of concentration and fatigue.
Results obtained through the Post Study Imagery Questionnaire describe perceived positive effects imagery wields on athlete performance and confidence. This questionnaire also documents that participants’ appreciation for psychological skills training grew during the study. These findings parallel past research (Carboni et al., 2000; Kearns & Crossman, 1992; Shambrook & Bull, 1996; Templin & Vernacchia, 1993, 1995; Stewart, 1997; Thelwell et al., 2006). Participants 1, 2, and 5 expressed an outlook positive toward the imagery sessions, toward their own confidence concerning tasks, and toward anxiety-reducing effects of mentally re-creating a pitching sequence. This supports numerous findings about imagery’s possible benefits, for example improved self-confidence (Callow, Hardy, & Hall, 2001), better motivation (Callow & Hardy, 2001), improved regulation of arousal (Hecker & Kaczor, 1988), and stronger ability to modify such cognitions as self-efficacy (Feltz & Ressinger, 1990). Imagery, or mental practice, can, the research record demonstrates, be used to control anxiety and to enhance both the strategies and physical movements that will be employed in performing a skill (Magill, 2007).
Suggestions for future research include, again, the deployment of alternative methods of presenting video imagery intervention, to ensure participants’ focus is maintained. In addition, future research should examine how often and for how long interventions are best administered, in terms of performance enhancement.
The baselines established by this study’s participants did not vary more than 1 point, although the criterion we employed for defining baseline and actual change was 2 points (on a 10-point scale). Perhaps future research would benefit from more strict criteria, which would tend to identify more pronounced effects.
Psychological skills training, coaches and athletes often fear, entails a long-term commitment and many field practice hours lost. The present findings, however, imply that imagery training’s effects on at least the one position-specific task studied are observable in as little as twelve 10-minute sessions (4 per week for 3 weeks). Moreover, the study demonstrates that effective intervention may take place during the competetive season and in conjunction with rigorous physical training.
Bull (1991) identified three barriers between athletes and ongoing psychological skills training: time constraints, a disruptive home environment, and an unmet need for individually tailored training. The position-specific intervention employed in this study, together with use of a brief script, alleviate all three problems. Later, in a discussion of how best to implement psychological skills training, Shambrook and Bull (1999) emphasized the importance of time management, of structure, and of integration of psychological skills within existing training. The present study’s findings, past research focusing on workshops (Cummings, Hall, & Shambrook, 2007), and future research will complete the path around the barriers, driving home that intervention programs may be both brief and integrated within established physical training in order to reap positive returns.
Please address all correspondence to:
Dr. Daniel R. Czech, CC-AAASP
Department of Health and Kinesiology
Box 8076
Georgia Southern University
Statesboro, GA 30460-8076
Telephone (912) 681-5267
E-mail drczech@georgiasouthern.edu
REFERENCES
Albinson, J. G., & Bull, S. J. (1988). The mental game plan. London, Ontario, Canada: Spodym.
Betts, G. H. (1909). The distributions and functions of mental imagery. New York: Teachers College Columbia University.
Bryan, A. J. (1987). Single-subject designs for evaluation of sport psychology interventions. The Sport Psychologist,1, 283–292.
Bull, S. J. (1991). Personal and situational influences on adherence to mental skills training. Journal of Sport and Exercise Psychology, 13, 121–132.
Callow, N., & Hardy, L. (2001). Types of imagery associated with sport confidence in netball players of varying skill levels. Journal of Applied Sport Psychology, 13, 1–17.
Callow, N., Hardy, L., & Hall, C. (2001). The effects of a motivational general-mastery imagery intervention on the sport confidence of high-level badminton players. Research Quarterly for Exercise and Sport, 72, 389–400.
Camels, C., Holmes, P., Berthoumeius, C., Paris, F., & Singer, R. (2004). The development of movement imagery vividness through a structured intervention in softball. Journal of Sport Behavior, 27, 307–322.
Carboni, J., Burke, K., Joyner, A. B., Hardy, C. J., & Blom, L. C. (2000). The effects of brief imagery on free throw shooting performance and concentration style of intercollegiate basketball players: A single subject design. International Sports Journal, 6, 60–68.
Carpenter, W. B. (1894). Principles of mental physiology. New York: Appleton.
Corbin, C. B. (1972). Mental practice. In W. P. Morgan (Ed.), Ergogenic Aids and Muscular Performance (pp 93-118). New York: Academic.
Creswell, S. & Eklund, R. (2007). The nature of player burnout in rugby: Key characteristics and attributions. Journal of Applied Sport Psychology, 18, 219, 232
Cumming, J., & Hall, C. (2002a). Deliberate imagery practice: Examining the development of imagery skills in competitive athletes. Journal of Sport Sciences, 20, 137–145.
Cumming, J., & Hall, C. (2002b). Athletes’ use of imagery in the off-season. The Sport Psychologist, 16, 160–172.
Cumming, J., Hall, C., Harwood, C. G., & Gammage, K. (2002). Motivational orientations and imagery use: A goal profiling analysis. Journal of Sport Sciences, 20, 127–136.
Cumming, J., Hall, C., & Shambrook, C. (2007). The influence of an imagery workshop on athletes’ use of imagery. Athletic Insight: Online Journal of Sport Psychology,6, 1.
Driskell, J. E., Copper, C., & Moran, A. (1994). Does mental practice enhance performance? A meta-analysis. Journal of Applied Psychology, 79, 481–492.
Feltz, D. L., & Riessinger, C. A. (1990). Effects of in vivo imagery and performance feedback on self-efficacy and muscular endurance. Journal of Sport and Exercise Psychology, 12, 132–143.
Gordon, S., Jackson, A., & Weinberg, R. (1994). Effect of internal imagery on cricket performance. Journal of Sport Behavior, 17.
Goss, S., Hall, C. R., Buckolz, E., & Fishbourne, G. J. (1986). Imagery ability and the acquisition and retention of movements. Memory and Cognition, 14, 469–477.
Gould, D., Dieffenbach, K., & Moffett, A. (2002). Psychological characteristics and their development in Olympic champions. Journal of Applied Sport Psychology, 14, 172–204.
Gould, D., Petlichkoff, L., Hodge, K., & Simons, J. (1990). Evaluating the effectiveness of a psychological skills educational workshop. The Sport Psychologist, 4, 249–260.
Hale, B. D. (1982). The effects of internal and external imagery on muscular and ocular concomitants. Journal of Sport Psychology, 4, 379–387.
Hall, C. (1998). Measuring imagery abilities and imagery use. In J. Duda (Ed.), Advances in sport and exercise psychology measurement (pp. 165–172). Morgantown, WV: Fitness Information Technology.
Hall, C. (2001). Imagery in sport and exercise. In R. Singer, H. Hausenblas, & C. Janelle (Eds.), Handbook of Sport Psychology (pp. 529–549). New York: John Wiley & Sons.
Hall, E. G., & Erffmeyer, E. S. (1983). The effect of visuo-motor behavior rehearsal with videotaped modeling on free throw accuracy of intercollegiate female basketball players. Journal of Sport Psychology, 5, 343–346.
Hall, C. R., Pongrac, J., & Buckholz, E. (1985). The measurement of imagery ability. Human Movement Science, 4, 107–118.
Hall, C. R., & Pongrac, J. (1983). Movement imagery questionnaire. London, Ontario, Canada: University of Western Ontario, Faculty of Physical Education.
Hecker, J. E., & Kaczor, L. M. (1988). Application of imagery theory to sport psychology: Some preliminary findings. Journal of Sport and Exercise Psychology, 10, 363–373.
Isaac, A. R., & Marks, D. F. (1994). Individual differences in mental imagery experience: Developmental changes and specialization. British Journal of Psychology, 85, 479–500.
Kearns, D. W., & Crossman, J. (1992). Effects of a cognitive intervention package on the free-throw performance of varsity basketball players during practice and competition. Perceptual and Motor Skills, 75, 1243–1253.
Magill, R.A. (2007). Motor learning and control: Concepts and applications. New York: McGraw-Hill
Moritz, S. E., Hall, C., Martin, K. A., & Vadocz, E. (1996). What are confident athletes imaging? An examination of image content. The Sport Psychologist, 10, 171–179.
Munroe, K. J., Giacobbi, P. R., Hall, C., & Weinberg, R. (2000). The four Ws of imagery use: Where, when, why, and what. The Sport Psychologist, 14, 119–137.
Murphy. S., Jowdy, D., & Durtschi, S. (1990). Report on the U. S. Olympic Committee survey on imagery use in sport. In R. Weinberg & D. Gould (Eds.), Foundations of Sport & Exercise Psychology (p. 293). Champaign, IL: Human Kinetics.
Orlick, T. (1990). In pursuit of excellence: How to win in sport and life through mental training. Champaign, IL: Human Kinetics.
Paivio, A. (1985). Cognitive and motivational functions of imagery in human performance. Canadian Journal of Applied Sports Sciences, 10, 22S–28S.
Payne, V. G., & Isaacs, L. D. (1995). Human motor development: A lifespan approach (3rd ed.). Mountain View, CA: Mayfield.
Piaget, J., & Inhelder, B. (1971). Mental imagery in the child. New York: Basic Books.
Salmon, J., Hall, C., & Haslam, I. (1994). The use of imagery by soccer players. Journal of Applied Sport Psychology, 6(1), 116–133.
Shambrook, C. J., & Bull, S. J. (1996). The use of a single-case research design to investigate the efficacy of imagery training. Journal of Applied Sport Psychology, 8, 27–43.
Shambrook, C., & Bull, (1999). Adherence to psychological preparation in sport. In S. J. Bull (Ed.), Adherence issues in sport and exercise (pp. 169–196). New York: John Wiley & Sons.
Shiffman, H. R. (1995). The skin, body and chemical senses. In R. L. Gregory & A. M. Colman (Eds.), Sensation and Perception (pp. 70–96). London: Longman.
Stewart, G. R. (1997). A single subject design to study the effects of a mental imagery intervention on basketball free-throw performance. Tesis de Master: Queen’s University
Stroksahl, K., & Ascough, J. C. (1981). A multiple component of clinical imagery. In E. Klinger (Ed.), Imagery: Concepts, results and applications (pp. 259–274). New York: Plenum.
Templin, D. P., & Vernacchia, R. A. (1995). The effect of highlight music videotapes upon the game performance of intercollegiate basketball players. The Sport Psychologist, 9, 41–50.
Thelwell, R., Greenless, I., & Weston, N. (2007). Using psychological skills training to develop soccer performance. Journal of Applied Sport Psychology,18, 254.
Vadocz, E., Hall, C., & Moritz, S. (1997). The relationship between competitive anxiety and imagery use. Journal of Applied Sport Psychology, 9, 241–253.
Vealey, R. S., & Walter, S. M. (1993). Imagery training for performance enhancement and personal development. In J. M. Williams (Ed.), Applied sport psychology: Personal growth to peak performance (pp. 200–223). Mountain View, CA: Mayfield.
Vealey, R. S., & Greenleaf, C. A. (2001). Seeing is believing: Understanding and using imagery in sport. In J. M. Williams (Ed.), Applied sport psychology: Personal growth to peak performance (4th ed.). Mountain View, CA: Mayfield.
Weinberg, R. S., & Williams, J. M. (2001). Integrating and implementing a psychological skills training program. In J. M. Williams (Ed.), Applied sport psychology: Personal growth to peak performance (4th ed.), pp. 347–377). Mountain View, CA: Mayfield.

