Geographical Effects on College Bowl Games

Abstract

One of the most heated debates in all of college sports centers on the college football postseason. With the goal of creating the best structure for determining a national champion, some parties argue for playoffs, while others advocate that the current bowl system should remain in place. One part of the college football postseason that has been overlooked is the location of the games as a factor in potentially ameliorating the bowl system. Data were conducted to determine if geography gives certain teams advantages in bowl games. Statistical analysis showed that factors such as participant teams’ relative distances to the bowl sites and relative climates are significant in determining the outcomes of major college football bowl games.

Introduction

One of the many traditions of major college football is the unique conclusion to its season. Since 1902, when the forerunner to the Rose Bowl was played for the first time, a series of bowl games has marked the end of the college football season (Bauman, 2009). Unlike most of their other collegiate and professional sports counterparts, college football teams in the NCAA’s Division One Football Bowl Subdivision (formerly Division I-A) conclude each year with the chance to participate, not in a multi-round tournament, but in a bowl game (NCAA Championships, 2008).

In the past fifteen years, the college football bowl system has evolved into an imperfect compromise, balancing tradition with a growing desire to crown an undisputable national champion. The Bowl Championship Series, the most recent manifestation of the struggle between tradition and progress, emerged in the late 1990s. (BCS Background, 2008). At first, the Bowl Championship Series (BCS) consisted of four major bowl games – the Fiesta, Orange, Sugar, and Rose Bowls – with the two most highly ranked teams placed in one of those four games. A fifth BCS game, which was dubbed the BCS Championship Game, was added starting with the end of the 2006 season (Flanagan, 2008).

The BCS, while representing significant progress compared with its predecessors, has been unable to produce a true national champion on a consistent basis. This shortcoming is partially due to the fact that each team can play in a maximum of just one bowl game, as opposed to a multi-round tournament. If, for example, three schools have perfect records following the regular season, the BCS is capable of pairing only two of those three institutions in its “National Championship Game,” while the third school must compete in a different bowl game.

BCS controversy, while never completely dormant between 2005 and the present, returned with a vengeance in 2008 (Lopresti, 2008). Instead of having three undefeated teams vying for the chance to play for a national championship, the end of the 2008 regular season resulted in a top ten with no undefeated major conference teams, seven one-loss major conference teams, and two undefeated non-major conference teams. Three of these one-loss teams were from one particular conference, and only one received a chance to play in the national championship game, while another played in the Fiesta Bowl, and the third did not get an opportunity to play in a BCS game at all (Knight, 2009).

This debate has even become a political issue, as various politicians have spoken out in favor of a college football playoff system (Limon, 2009). As a result of this continued controversy, the increasingly popular solution to the championship problem is a playoff system, which could pit anywhere from four to sixteen teams in a single-elimination tournament. (Withers, 2008). Other collegiate and professional sports, including other collegiate football divisions and the National Football League, already employ such a format. While many agree that this would be a logical change, few have addressed the issue of where these playoff games would be played. That the proponents of maintaining the BCS system believe the bowl games should be played at their traditional locations is a given.

With few exceptions from year to year, bowl games are played on a neutral field and at the same stadium each year (Official Records Book, 2008). While the focus of reforming the bowl system has been on moving from a one-game postseason to more of a tournament system, other elements of the system – such as where the bowl games (or playoff games) are (or will be) played – have been largely overlooked, even though the locations of games could be important in creating a comprehensively fair postseason that crowns a true national champion.

Question Presented

Do geographical factors play a role in determining the results of bowl games? Specifically, do significantly diverse distances between the participating teams’ campuses and the bowl games’ sites affect the outcome of those games? Also, do climates of representative institutions that are significantly disparate between each other and the location of bowl games affect the outcome of those games?

Geographical factors provide some of the many reasons why playing a game at one’s home field is an advantage. Playing in front of a supportive crowd, having a familiarity with the surroundings, and not having to travel to play the game are some other components of what gives the home team an advantage. Unlike regular season games, bowl games are intended to be played on neutral fields; however, many major bowl games are played in locations that are much closer to one of the participant schools than the other. As a result, there is the potential that the game location could unintentionally favor one team over the other. Data were compiled to determine if such a significant, albeit unintentional, advantage exists.

Method

Since the first Bowl Championship Series game at the end of the 1998-99 season, there have been a total of 47 BCS bowl games. Teams from 41 institutions have filled the 94 spots in those games. The following data from these games and schools were collected:

  1. The distances between each school and the host bowl site;
  2. The average temperatures of the homes of the participant schools and the host bowl sites;
  3. The point spread for each game; and
  4. The outcome of each game.

The distances between the locations of each participant institution and the particular bowl games were determined using mapquest.com. The average temperatures of each of the schools and each of the bowl sites were obtained from weatherbase.com. The sites of the bowl games and their outcomes from 1999 to 2008 were obtained from the Official 2008 Division I Football Records Book, which is published by the NCAA. The historical point spread for each game was obtained from goldsheet.com.

Data were grouped into three sections: distances, climate, and favorites. The distances section presents the results of the bowl games by taking into account the distances between the representative institutions and the sites of the games. The climate section shows the results of the bowl games when considering the differences in weather between the teams and the locations of the games. The favorites section reveals how well the favored teams fared against the point spread.

The point spread for each game was collected to help determine the significance of the results of the data. The point spread, which is commonly called the spread or the line, is a method used to weigh each team’s likelihood of winning a game. An oddsmaker, most often Las Vegas Sports Consultants Inc., predicts the outcome of a match-up and publishes the point spread to indicate how the teams will do. The point spread is a prediction of the difference between the final scores. The favorite team is identified by a negative number, and the absolute value of that number identifies the underdog.

In other words, the favorite team is favored to win by the point spread. So, for instance, if a team is favored at -4, the oddsmakers believe that the favorite team will win the game by 4 points. If the favorite team “beats the spread” or “covers the spread,” then it has won the game and has won it by more than the point spread. If the favorite team does not beat the spread or fails to cover the spread, then it has either lost or it has won by tying the point spread or scoring less than the point spread. Therefore, an underdog beats the spread if it wins the game, loses by the amount of the point spread, or loses by less than the point spread.

When determining the spread, the oddsmakers take into account almost every conceivable factor, including records, strengths of schedules, weather, injuries, home field, tradition, motivations, time of day of kick-off, revenge, rivalries, time off between games, starters, playing surface, number of fans in attendance, and historical trends. Comparing the outcomes of games to the spread helps to reveal the significance of the data, since the spread takes into account the geographical factors of weather and location.

Results

The teams from institutions that are closer to the bowl site than their opponents have won 25 of the 47 BCS games, giving them a winning percentage of over 53%. However, the distances between participant schools and the bowl sites are not always significant. For instance, in the 1999 Fiesta Bowl, Tennessee played Florida State, and Knoxville, Tennessee is roughly 1800 miles from Tempe, Arizona, while Tallahassee, Florida is about 1880 miles from Tempe. Tennessee cannot be said to have had a proximity advantage in this game, since both teams had to travel similar distances to Tempe. This game was one of six instances in which the relative distances between the participant schools and the bowl sites were negligible. When disregarding the outcomes of these six games, the closer team has won a slightly greater percentage of the BCS games – just over 56%.

Table 1 – Distance (Straight)

Teams Closer to the Bowl Site
Straight Record

Wins Losses Winning %
25 22 0.5319

Teams Closer to the Bowl Site
Straight Record (without negligible distance differences)

Wins Losses Winning %
23 18 0.5610

The teams from climates more similar to that of the bowl site have won over 60% of the BCS games, winning 28 of those 46 games. (The participants in the 2009 Orange Bowl, Cincinnati and Virginia Tech, are from locations with the same average temperature, so the results do not reflect this game.) In some instances, the relative weather of the participant schools was negligible. For example, when Ohio State and Notre Dame played each other in the 2006 Fiesta Bowl, neither school had a climate advantage. Columbus, Ohio and South Bend, Indiana have average temperatures within four degrees of one another, and neither average temperature is similar to that of Tempe, Arizona. There have been six such match-ups with teams from very similar climates. When disregarding these negligible differences, teams from locations with climates significantly more similar to that of the bowl site than their opponents have won over 62% of the BCS games.

Table 2 – Climate (Straight)

Teams from a Climate More Similar to the Bowl Site
Straight Record

Wins Losses Winning %
28 18 0.6087

Teams from a Climate More Similar to the Bowl Site
Straight Record (without negligible climate differences)

Wins Losses Winning %
25 15 0.6250

The success of teams from locations closer to the bowl site than their opponents is slightly greater when taking the point spread into account. In the BCS era, the closer team has defeated the spread over 55% of the time. When disregarding negligible distance differences, the closer team has defeated the spread in 24 of 41 games for a winning percentage of greater than 58%.

Table 3 – Distance (Spread)

Teams Closer to the Bowl Site
Record Against the Spread

Wins Losses Winning %
26 21 0.5532

Teams Closer to the Bowl Site
Record Against the Spread (without negligible distance differences)

Wins Losses Winning %
24 17 0.5854

The teams from climates more similar to that of the bowl site have had comparable success. Teams from such similar climates have defeated the spread in 60% of BCS games. When negligible climate differences are ignored, the teams from climates more similar to the bowl site have defeated the spread over 62% of the time.

Table 4 – Climate (Spread)

Teams from a Climate More Similar to the Bowl Site
Record Against the Spread

Wins Losses Winning %
28 18 0.6087

Teams from a Climate More Similar to the Bowl Site
Record Against the Spread (without negligible climate differences)

Wins Losses Winning %
25 15 0.6250

The success of teams that are closer to the bowl site or that are familiar with the climate of the bowl site is remarkable when compared to the success of the favored teams. The favored team has won 28 of the 46 – or some 60% – of the BCS games. (One game, the 2007 Rose Bowl, did not have a favored team.) Irrespective of the point spread, this is almost exactly the same as the record of teams from climates more similar to the bowl sites, while it is slightly better than closer teams’ record. However, the favored teams have fared much worse when considering the point spread. In fact, the favored team has a losing record against the spread in BCS games. The favored team has won just 22 games and has lost 24 games against the spread.

Table 5 – Favorites

Favorite Teams
Straight Record

Wins Losses Winning %
28 18 0.6087

Favorite Teams
Record Against the Spread

Wins Losses Winning %
22 24 0.4783

Considering that the point spread already takes into account geographical factors such as climate and location, these results are significant. The teams from locations significantly closer to the bowl site have won over 58% of their games against the spread, while the favored teams have won less than 48% of their games against the spread. Even more dramatic is the difference between the record against the spread of the favored teams and the record against the spread of teams from climates significantly more similar to the bowl site. The teams from climates significantly more similar to the bowl site have won over 62% of their games against the spread, which is almost 15% higher than the favored teams’ record.

Table 6 – Spread Compared

Favored Teams
Record Against the Spread

Wins Losses Winning %
22 24 0.4783

Teams Closer to the Bowl Site
Record Against the Spread (without negligible distance differences)

Wins Losses Winning %
24 17 0.5854

Teams from a Climate More Similar to the Bowl Site
Record Against the Spread (without negligible climate differences)

Wins Losses Winning %
25 15 0.6250

Discussion

Although unintended, the locations of bowl games have impacted the results of these games. A team from an institution with a climate significantly more similar to that of the bowl site than that of the team’s opponent is much more likely to win its bowl game than its opponent. Similar to this, though not quite as strong, is the likelihood that a team from a campus that is significantly closer to the bowl site than that of its opponent will win its bowl game. Understanding these results may be important in determining how to improve the bowl system by considering geographical characteristics of host sites and participant institutions.

With few exceptions from year to year, bowl games are played on a neutral field and at the same stadium. However, the bowl site most often is much closer to the campus and fan concentration of one of the participant schools than it is to the other. Even when the stadium hosting the bowl game is not the home field of one of the participant teams, one team’s campus is frequently much closer to the bowl site than the other team’s home.

Underlying the playoff system movement is the commonly held tenet that college football’s season, like most every other collegiate sport, should result in the crowning of a true national champion. If this is the case, then perhaps more aspects of the postseason should be examined and amended, if necessary – not just the process of selecting teams to play for the title. Geographical factors, such as location and climate, play a role in determining the outcome of bowl games and, ultimately, crowning the national champion.

Future Studies

Future studies may include an examination of the times that games start and the differences between the time zones of participating teams to determine if a more neutral kick-off time should be employed. Additionally, the playoffs for the National Football League have an intended element of home field advantage for all rounds of the playoffs, except for the Super Bowl, which is played at a neutral site. A study of this system’s strengths and weaknesses could help to determine the best arrangement for the college football postseason.

References

BCS Background. Retrieved December 23, 2008, from http://www.bcsfootball.org/bcsfb/about.

Flanagan, K. E. (2008). Factors Affecting Attendance at Bowl Games During the BCS Era. The Sport Journal, 11 (3). Retrieved October 15, 2008, from http://www.thesportjournal.org/ article/factors-affecting-attendance-bowl-games-during-bcs-era.

Goldsheet.com. Retrieved December 12, 2008, from http://goldsheet.com.

Knight, B. (2009, January 8). BCS produces confusion, not a national champion. El Paso Times.

Limon, I. (2009, January 20). Obama: ‘Yes, we can’; BCS: No, we can’t. Orlando Sentinel, D1.

Lopresti, M. (2008, December 11). Bowl backer defends the system. USA Today, 8C.

Mapquest.com. Retrieved November 3, 2008, from http://www.mapquest.com.

NCAA Championships. Retrieved December 23, 2008, from http://www.ncaa.com/champ/index. html.

NCAA. Official 2008 Division I Football Records Book (2008, August). Retrieved October 15, 2008, from http://www.ncaa.org.

Weatherbase.com. Retrieved November 3, 2008, from http://www.weatherbase.com.

Withers, B. (2008, November 7). A BCS crisis may start serious talk about a playoff. The Seattle Times, C1.

2013-11-25T19:47:06-06:00July 10th, 2009|Contemporary Sports Issues, Sports Coaching, Sports Studies and Sports Psychology|Comments Off on Geographical Effects on College Bowl Games

Impact of Cold Water Immersion on 5km Racing Performance

Abstract

Much effort over the past 50 years has been devoted to research on training, but little is known about recovery after intense running efforts. Insufficient recovery impedes training and performance. Anecdotal evidence suggests that cold water immersion immediately following intense distance running efforts aids in next day performance perhaps by decreasing injury or increasing recovery. The purpose of this study was to compare 5 km racing performance after 24 hrs with and without cold water immersion. Twelve well-trained runners (9 males, 3 females) completed successive (within 24 hours) 5 km performance trials on two separate occasions. Immediately following the first baseline 5 km trial, runners were treated with ice water immersion for 12 minutes followed by 24 hrs of passive recovery (ICE). Another session involved two 5 km time trials: a baseline trial and another trial after 24 hrs of passive recovery (CON). Treatments occurred in a counterbalanced order and were separated by 6-7 days of normal training. ICE (20:08 ± 2.0 min) was not significantly different (p = 0.09) from baseline (19:59 ± 2.0 min). CON (19:59 ± 1.9 min) was significantly (p = 0.03) slower than baseline (19:49 ± 1.9 min). ICE heart rate (175.3 ± 7.6 b/min) was significantly (p = 0.02) less than baseline (178.3 ± 9.8 b/min), yet CON heart rate (177.3 ± 6.3 b/min) was the same as baseline (177.3 ± 7.3 b/min). ICE rate of perceived exertion (19.2 + 1.0) was significantly less (p = 0.03) than baseline (19.8 ± 0.5) while CON rate of perceived exertion (19.5 ± 0.8) was not significantly different (p = 0.39) from baseline (19.6 ± 0.8). Seven individuals responded negatively to ICE running a mean 24.0 ± 13.9 seconds slower than baseline. Nine individuals responded negatively to CON by running a mean 17.4 ± 12.1 seconds slower than baseline. Three individuals responded positively to ICE running a mean 20.33 ± 6.7 seconds faster during second day performance. Three individuals responded positively to CON by running a mean 13.3 ± 6.8 seconds faster than baseline. In general, cold water immersion minutely reduced the decline of next day performance, yet individual variability existed. Efficacy of longer durations of cold water immersion impact after 48 hrs and on distances greater than 5 km appear to be individual and need to be further explored.

Key words: cryotherapy, ice water immersion, passive recovery, running

Introduction

Recovery from hard running efforts plays a vital role in determining when a runner can run at an intense level again (Fitzgerald, 2007). Hard training, followed by adequate recovery, allows the body to adapt to the unusual stress and become better accustomed and more prepared for the same stress, should it occur again (Fitzgerald, 2007; Sinclair, Olgesby, & Piepenberg, 2003). Balancing hard efforts with periods of rest is essential in improving performance during endurance efforts.

The recovery process from endurance efforts tends to revolve around repairing damaged muscle fibers and replenishing glycogen stores (Gomez et al., 2002; Nicholas et al., 1997). Methods proposed to enhance recovery, such as cold water immersion, potentially decrease swelling and the severity of delayed onset of muscle soreness (DOMS), which possibly benefits endurance (i.e. running) and anaerobic performance (Higdon, 1998; Vaile, Gill, & Blazevich, 2007).

Cold water immersion is a common practice among collegiate and professional athletes following intense physical efforts. Anecdotal evidence from several National Athletic Trainers’ Association (NATA) collegiate head athletic trainers suggests that cooling the legs after a hard training effort may benefit the next day’s performance. Popular running and athletic magazines (e.g., Runner’s World, Running Times, etc.) have continually suggested that applying cold water to the legs of a runner facilitates a better perceived feeling for the next run on the following day. Yet, despite its widespread use there is no scientific data supporting the notion that cooling the legs after a hard distance running effort will improve performance 24 hrs later.

The use of cold as a treatment is as ancient as the practice of medicine, dating back to Hippocrates (Stamford, 1996). The therapeutic use of cold is the most commonly used modality in the acute management of musculoskeletal injuries. Running is a catabolic process, with eccentric muscle contractions leading to muscle damage. Applying cold to an injured site decreases pain sensation, improves the metabolic rate of tissue, and allows uninjured tissue to survive a post-injury period of ischemia, or perhaps allows the tissue to be protected from the damaging enzymatic reactions that may accompany injury (Arnheim and Prentice, 1999; Merrick, Jutte, & Smith, 2003). The use of cryotherapy, between sets of “pulley exercises” (similar to a seated pulley row), decreased the feelings of fatigue of the arm and shoulder muscles of 10 male weight lifters (Verducci, 2000), while other cryotherapy research involving recovery from intense anaerobic efforts has yielded equivocal results (Barnett, 2006; Cheung, Hume, & Maxwell, 2003; Crowe, O’Connor, & Rudd, 2007; Howatson, Gaze, & Van Someren, 2005; Howatson and Van Someren, 2003; Isabell et al., 1992; Paddon-Jones and Quigley, 1997; Sellwood et al., 2007; Vaile, Gill, & Blazevich, 2007; Vaile et al., 2008; Yackzan, Adams, and Francis, 1984). However, methods of cryotherapy effective for enhancing recovery from distance running efforts have not been examined.

Long duration or high intensity running contributes to muscle cell damage (Fitzgerald, 2007; Noakes, 2003). Edema, a by-product of muscle damage can cause reduced range of joint motion. Because cryotherapy has been shown to decrease inflammation (Dolan et al., 1997; O’Conner and Wilder, 2001), it is logical to assume that this treatment may reduce the severity of DOMS. Less pain may permit an athlete to push themselves harder potentially improving performance. Despite the fact that previous research has shown that 24 hrs alone is not sufficient recovery from 5 km running performance (Bosak, Bishop, & Green, 2008), it might be possible that combining cold water immersion with 24 hrs of recovery could potentially hasten the recovery process. Therefore, the purpose of this study was to compare 5 km racing performance after 24 hrs of passive recovery with and without cold water immersion.

Methods

Participants:

Participants for the study were 12 well trained male (n = 9) and female (n = 3) runners currently engaged in rigorous training. Runners from the local road running and track club, local triathlon competitors, as well as former competitive high school and college runners, were recruited by word of mouth. Participant inclusion criteria included the following: 1) Subjects must have been currently involved in a distance running training program; 2) Their 5 km times previously run had to be at least 16-22 min for male runners or 18-24 min for female runners; 3) They had to be currently averaging at least 20-30 miles (running) per week; 4) They had to have previously completed at least five 5 km road or track races; 5) They had to have a VO2max of at least 45 ml/kg/min (females) or 55 ml/kg/min (males); and 6) They had to provide sufficient data (from running history questionnaires, physical activity readiness questionnaires, and health readiness questionnaires) that reflected good health.

Participants completed a short questionnaire regarding their running background, racing history, and current training mileage. All participants were volunteers and signed a written informed consent outlining requirements as well as potential risks and benefits resulting from participating.

Procedures:

Participants were assessed for age, height, body weight, and body fat percentage using a 3-site skinfold technique (Brozek and Hanschel, 1961; Pollock, Schmidt, & Jackson, 1980). Participants were fitted with a Polar heart rate monitor, and then completed a graded exercise test (GXT) to exhaustion lasting approximately 12-18 min. VO2max, heart rate (HR), and ratings of perceived exertion (RPE) were collected every minute.

All GXTs were completed on a Quinton 640 motorized treadmill. The test began with a 2 min warm-up at 2.5 mph. Speed was increased to 5 mph for 2 min, followed by 2 min at 6 mph, 2 min at 7 mph, and 2 min at 7.5 mph. At this point, incline was increased two percent every 2 min thereafter until the participant reached volitional exhaustion (i.e. they felt like they could no longer continue running at the required speed and grade). Once the participant reached volitional exhaustion, they were instructed to cool down until they felt recovered.

Approximately five days later, participants performed their first 5 km race (performance trial) between the hours of 6:30 am to 7:30 am. The time of day for each performance trial was consistent throughout the entire study. All performance trials were completed on a flat hard-surfaced 0.73 mile loop. Prior to each trial, participants completed visual analog scales, before and after a 1.5 mile warm-up run, regarding their feelings of fatigue and soreness within local muscle groups (quadriceps, hamstrings, gastrocnemius), and for lower and total body muscle groups. Visual analog scales were 15 cm lines, where participants placed an “X” on the line indicating their feelings (with 0 = no fatigue or soreness and 15 = extreme fatigue or soreness). The focus of the visual analog scales was to determine if participants felt the same before the start of every time trial. Participants were also required to rate their perceived exertion (RPE) after the warm-up and prior to the start of each 5 km, during each trial, and at the end of each performance trial to determine if feelings of effort remained consistent between each trial, as well as during each lap and at the end of each trial.

Runners underwent a 1.5 mile warm-up prior to every 5 km performance trial (Kaufmann and Ware, 1977). Participants completed four 5 km performance trials within nine days. Two 5 km performance trials (baseline and CON) were separated by 24 hrs of passive recovery. Passive recovery was deemed as no exercise or extensive physical activity during the allotted recovery hours. Two 5 km performance trials (baseline and ICE) were also separated by 24 hrs of passive recovery, but with 12 minutes of 15.5ºC water immersion immediately following the baseline trial. The two sessions of 5 km performance trials were counterbalanced and were separated by 6-7 days of normal training. Each trial session therefore, had a separate baseline preceded by 24 hrs of passive recovery.

Ideal cryotherapeutic water temperature has not been determined, yet various head collegiate athletic trainers prefer that the water temperature does not dip below 13ºC (55.5ºF) since many people find water temperatures below 13ºC uncomfortable (O’Connor and Wilder, 2001). Also, the duration of ice baths generally lasts 10-15 minutes and is usually applied immediately after a hard training session (Crowe, O’Connor, & Rudd, 2007; Schniepp et al., 2002; Vaile et al., 2008). Hence, in this study, 15.5ºC (60ºF) was the temperature for the cold water and the athletes were immersed for 12 min.

During each time trial, average heart rate and ending RPE were recorded in order to determine if effort for each 5 km was consistent. All participants competed with runners of similar ability to simulate race day and hard training conditions, while verbal encouragement was provided often and equally to each participant. At the end of every performance trial, each runner was instructed to complete a low intensity 1.5 mile cool-down. Each total testing trial required approximately 60 min.

Statistical Analysis:

Basic descriptive statistics were computed. Repeated measures of analysis of variance (ANOVA) were employed for making comparisons between CON and baseline and PAS and baseline performance trials for the following variables: finishing times, HR, RPE, and fatigue or soreness responses. All statistical comparisons were made at an a priori p < .05 level of significance. Data were expressed as group mean + standard deviation and individual results.

In order to evaluate individual responses, data from each participant’s first run was compared to the second run using a paired T-test. The least significance group mean difference (p < 0.05) was determined and group mean finishing time was adjusted to determine the amount of change in seconds needed for significance to occur. The time change between the first trial run and the adjusted trial run baseline was divided by the first trial run and expressed as mean number of seconds or percent for both the ICE (9.3 seconds or 0.8%) and CON (9.5 seconds or 0.8%) trials. The percent values were applied to each individual baseline time in order to determine how many seconds (positive or negative) the second performance trial time had to be over or under the first performance trial, in both CON and ICE conditions, to quantify as a response. Participants were then labeled as non-responders, positive-responders (faster after treatment), and negative-responders (slower after treatment).

Results

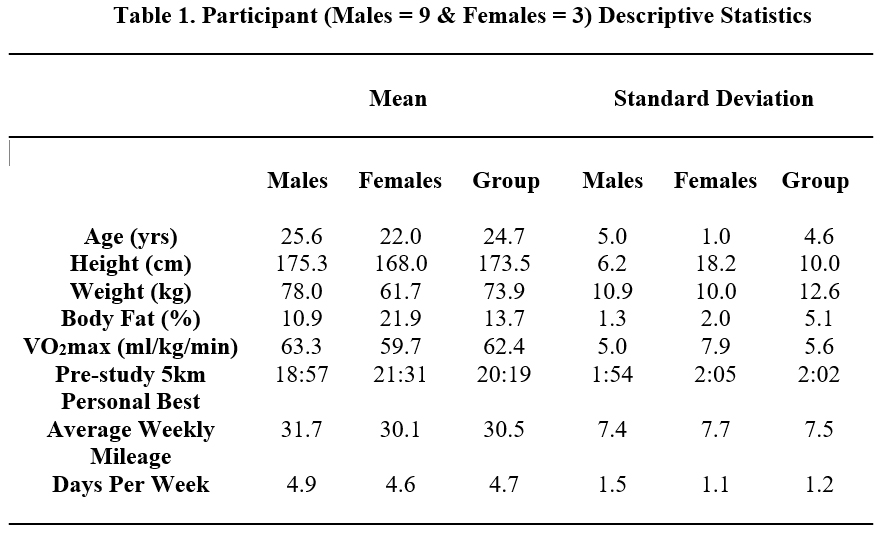
Descriptive characteristics are found in Table 1. The participants were between the ages of 18 and 35 (the majority of subjects were between ages 20-28) years. All participants were trained runners or triathletes (where running was their specialty event).

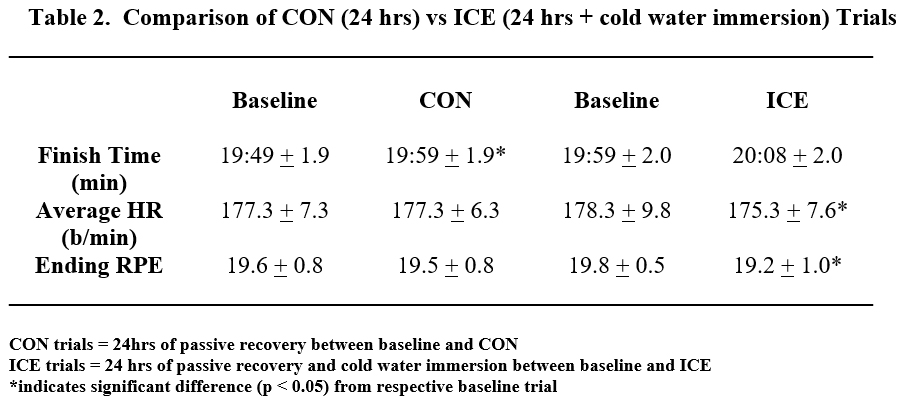
Mean finishing times, HR, and RPE for CON and ICE trials are found in Table 2. CON was significantly (p = 0.03) slower (10 seconds) than baseline, where as ICE was not significantly different (p = 0.09) from baseline. No significant differences were found between CON HR vs. baseline, but ICE HR was significantly (p = 0.01) less than baseline. No significant differences (p = 0.39) were found between CON RPE and baseline, yet ICE RPE was significantly (p = 0.03) less than baseline.

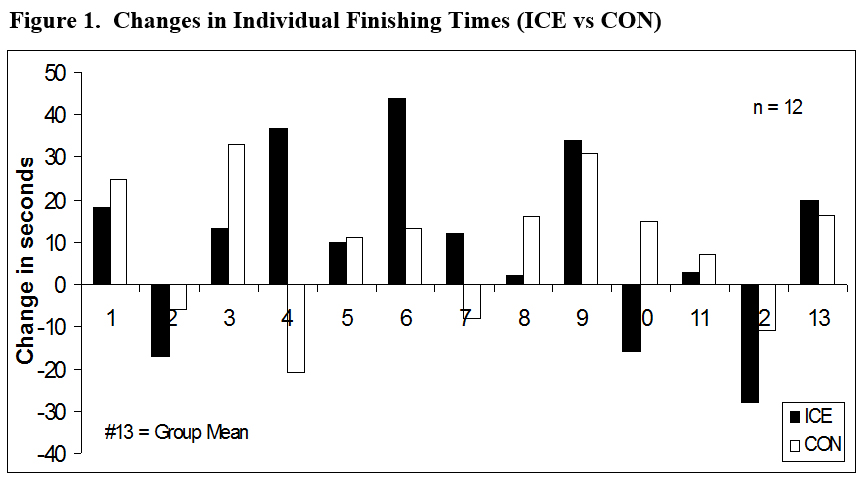
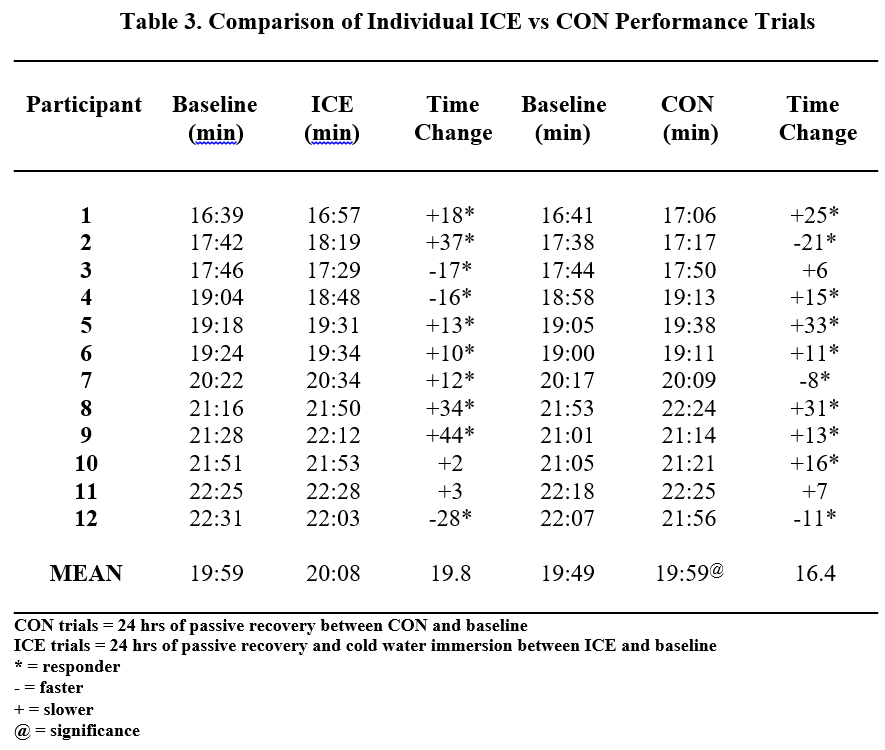
Figure 1 shows individual changes in finishing times for all CON and ICE performance trials. To be considered a non-responder, the individual time change had to fall within 0.8% of baseline performance for ICE and CON. Positive and negative responders (Table 3) were identified when individual time change was greater than 0.8% for CON and ICE trials, with a positive responder being one whose second performance trial time improved (expressed as a negative value) and a negative responder being one whose second performance trial time slowed (expressed as a positive value).

Seven individuals responded negatively to ICE by running a mean 24.0 ± 13.9 seconds slower during the second trial (Table 3). Three individuals responded positively to ICE by running a mean 20.3 ± 6.7 seconds faster than baseline. Two individuals were considered non-responders to ICE with a mean time change of 2.5 ± 0.7secs.

Seven individuals responded negatively to CON by running a mean 20.6 ± 9.0 seconds slower than baseline (Table 3). Three individuals responded positively to CON by running a mean 13.3 ± 6.8 seconds faster than baseline. Two individuals were non-responders to the CON trials with a mean time change of 6.5 ± 0.7 seconds. It is important to note that the seven individuals who were negative responders to ICE were not the same seven participants who responded negatively to CON. Also, the three participants who responded positively to ICE were not the same three individuals who responded positively to CON. Finally, the non-responders to ICE were not the same non-responders to CON.

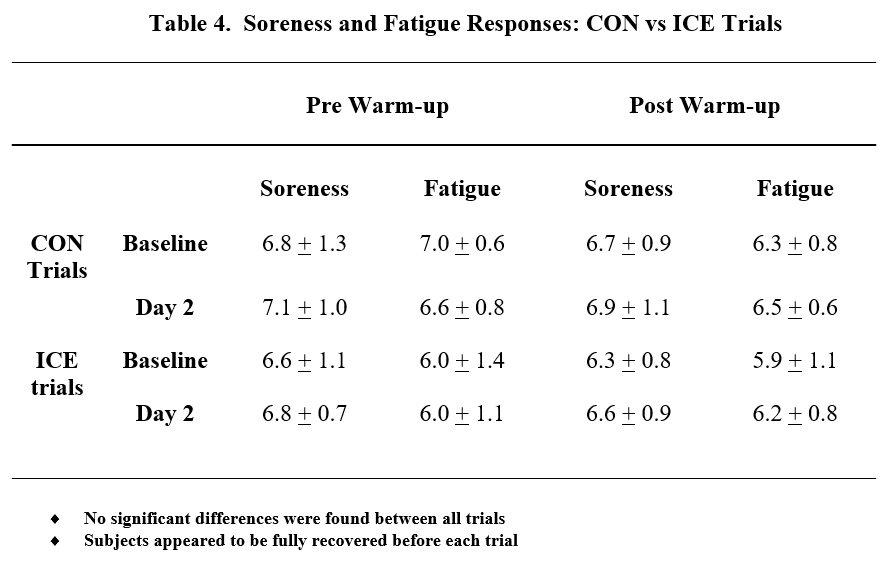
Soreness and fatigue scores (Table 4) on the pre-and post-warm-up fatigue or soreness visual analog scales were not significantly different between CON and baseline versus ICE and baseline.

Discussion

The effects of cold-water immersion on recovery and next day performance in 5 km racing have not been previously evaluated. Therefore, the primary purpose of this study was to compare 5 km running performance after 24 hrs of passive recovery with and without cold water immersion. This study appeared to indicate that cold water immersion does not dramatically help performance (regarding the group of runners as a whole) during second day 5 km trials.

Twenty-four hours of passive recovery may allow for normalization of muscle and liver glycogen, yet muscle function and performance measures may not be fully recovered (Foss and Keteyian, 1998). Hence, 24 hrs of recovery, by itself, may not be sufficient to allow for a return to optimal performance (Bosak, Bishop, & Green, 2008). When racing (e.g., a 5 km distance) on consecutive days, race times may be slower on the second day due to magnified perception of pain and impaired muscle function associated with DOMS (Brown and Henderson, 2002; Fitzgerald, 2007; Galloway, 1984). Since cold water immersion may speed up the recovery process (Arnheim and Prentice, 1999; Vaile et al., 2008) it is logical to assume that cold water immersion immediately after a 5 km race or workout could attenuate soreness potentially minimizing performance decrements on successive days.

There were no significant (p = 0.09) differences in 5 km performance between ICE and baseline, indicating that mean performance during ICE was not significantly slower (9 seconds) than baseline (refer to Table 2). However, CON performance was significantly (p = 0.03) slower (10 seconds) than baseline. Hence, due to significant differences occurring between ICE and baseline, it appears that cold water immersion slightly attenuated the rate of decline on successive 5 km time trial performance. However, the time difference between CON and baseline versus ICE and baseline was a mere second. Therefore, from a practical standpoint, cold water immersion was no more beneficial than CON on successive 5 km performance.

Despite the minimal differences between CON (10 seconds) and ICE (9 seconds) trials regarding mean time change, it is important to focus on the effects of cold water immersion on individual runners (Figure 1). Because some runners ran slower during successive performance trials while other runners ran faster, the mean finishing times do not necessarily give a true impression of the benefits or liabilities of the specific treatments involved in this study. As it is with most ergogenic aids, individual variability suggests what works (e.g., ice) for one person may not work the same for another person. It is possible that the treatment may often not have an effect at all, as similar to what occurred with several prior anaerobic performance studies (Barnett, 2006; Cheung, Hume, & Maxwell, 2003; Crowe, O’Connor, & Rudd, 2007; Howatson, Gaze, & Van Someren, 2005; Howatson and Van Someren, 2003; Isabell et al., 1992; Paddon-Jones and Quigley, 1997; Sellwood et al., 2007; Vaile et al., 2008), which was also the case in this study as two individuals were considered non-responders to ICE with a mean time change of 2.5 ± 0.7 seconds between ICE and baseline, while two other participants were non-responders to CON with a mean time change of 6.5 ± 0.7 seconds between CON and baseline.

Three individuals responded positively (Table 3) to ICE, running a mean 20.33 ± 6.7 seconds faster, indicating that cold water immersion may have actually allowed these individuals to run faster on the second day. However, 3 different individuals responded positively to CON, running a mean 13.3 ± 6.8 seconds faster than baseline. The mechanism by which cold water immersion aids in recovery, from endurance performance, remains somewhat unclear and equivocal (Schniepp et al., 2002; Vaile et al., 2008). Yet, several runners who did run faster during ICE trial, verbally indicated that prior to the second trial, their legs felt better (regarding fatigue and soreness) than they had prior to CON. Thus, the notion of feeling better may have allowed the runners to perform faster.

Seven individuals responded negatively (Table 3) to ICE, running a mean 24.0 ± 13.9 seconds slower. However, they were not the same seven individuals who responded negatively to CON, who ran an average of 20.6 ± 9.0 seconds slower than baseline. As was the case with Schniepp et al. (2002) endurance cycling recovery study and various anaerobic performance studies (Crowe, O’Connor, & Rudd, 2007; Sellwood et al., 2002; Vaile et al., 2008; Yackzan, Adams, & Francis, 1984), it appears ICE may have had a more negative effect, for these individuals, on second day performance compared to CON.

Three individuals responded positively to CON running a mean 13.3 ± 6.8 seconds faster during the second day performance trial. It is unclear why some participants ran faster during CON. There were no consistent patterns of HR and increased or decreased performance with all participants during all CON and ICE trials. As a group, no significant differences were found between CON vs. baseline, regarding HR (p = 1.00) and RPE (p = 0.39), despite significant differences (p = 0.04) occurring in mean finishing time. However, mean finishing times for ICE were similar, yet significant differences were found between ICE vs. baseline for both HR (p = 0.01) and RPE (p = 0.03). Hence, there does not appear to be a consistent pattern between performance times and HR and/or RPE.

It can be assumed that a lower HR may be associated with slower times, since HR and intensity levels tend to be linearly related. However, only participants 1, 5, and 6 consistently ran slower during both CON and ICE second day performances with lower HR during both trials. During the ICE trials, only participants 1, 5, 6, and 9 ran slower and had a lower HR. During the CON trials, only 1, 3, 5, 6, ran slower and had a lower HR. Also, soreness and fatigue scores (Table 4) on the pre and post warm-up fatigue or soreness visual analog scales were not significantly different between CON and baseline versus ICE and baseline. These results indicate that all runners tended to feel the same prior to each second day 5 km trial. Therefore, since inconsistencies exist between HR and performance trials and no significant differences were found regarding RPE and fatigue or soreness visual analog scales, it is assumed that each participant completed each trial with similar effort.

Conclusion

The current findings of this study suggest that cold water immersion does not sufficiently enhance recovery (specifically regarding the group of runners as a whole). However, three runners benefited from cold water immersion. Hence, what works for one person may not work for another person. Thus, it may be beneficial for runners to undergo this protocol in order to see which type of recovery method improves their recovery process. Secondly, the results of the study may give credence to some runners’ perception of feeling better due to cold water immersion after a hard running effort. However, one should remember that individual variability existed in response to treatment (ice immersion) within the current study. Future research is needed to see if a greater length of time or slightly lower water temperature in cold water immersion will decrease the rate of decline more or if the effects of cold water immersion are even more predominant on second day performance of distances greater than 5 km.

References

Arnheim, D. D., & Prentice, W. E. (1999). Essentials of athletic training (4th ed.). Boston, MA: McGraw-Hill.

Barnett, A. (2006). Using recovery modalities between training sessions in elite athletes: Does it help? Sports Medicine, 36 (9), 781-796.

Bosak, A., Bishop, P., & Green, M. (2008). Comparison of 5km racing performance after 24 and 72 hours of passive recovery. International Journal of Coaching Science (In Review).

Brown, R. L., & Henderson, J. (2002). Fitness Running (2nd ed.). Champaign, IL: Human Kinetics.

Brozek, J., & Hanschel, A. (1961). Techniques for measuring body composition. Washington, DC: National Academy of Sciences.

Cheung, K., Hume, P., & Maxwell, L. (2003). Delayed onset muscle soreness: treatment strategies and performance factors. Sports Medicine, 33 (2), 145-164.

Crowe, M. J., O’Connor, D., & Rudd, D. (2007). Cold water recovery reduces anaerobic performance. International Journal of Sports Medicine, 28 (12), 994-998.

Dolan, M. G., Thorton, R. M., Fish, D. R., & Mendel, F. C. (1997). Effects of cold water immersion on edema formation after blunt injury to the hind limbs of rats. The Journal of Athletic Training, 32, 233-238.

Fitzgerald, M. (2007). Brain Training for Runners. New York, NY: Penguin Group.

Foss, M. L., & Keteyian, S. J. (1998). Fox’s Physiological Basis for Exercise and Sport. Ann Arbor, MI: McGraw-Hill.

Galloway, J. (1984). Galloway’s Book on Running. Bolinas, CA: Shelter Publications.

Gomez, A. L., Radzwich, R. J., Denegar, C. R., Volek, J. S., Rubin, M. R., Bush, J.A., Doan, B.K., et.al. (2002). The effects of a 10-kilometer run on muscle strength and power. Journal of Strength and Conditioning Research, 16, 184-191.

Higdon, H. (1998). Smart Running. Emmaus, PA: Rodale Press Inc.

Howatson, G., Gaze, D., & Van Someren, K. A. (2005). The efficacy of ice massage in the treatment of exercise-induced muscle damage. The Scandinavian Journal of Medicine and Science in Sports, 2005, 15 (6), 416-422.

Howatson, G. & Van Someren, K. A. (2003). Ice massage: Effects on exercise-induced muscle damage. The Journal of Sports Medicine and Physical Fitness, 43 (4), 500-505.

Isabell, W. K., Durrant, E., Myrer, W., & Anderson, S. (1992). The effects of ice massage, ice massage with exercise, and exercise on the prevention and treatment of Delayed Onset Muscle Soreness. The Journal of Athletic Training, 27 (3), 208-217.

Kaufmann, D. A. & Ware, W. B. (1977). Effect of warm-up and recovery techniques on repeated running endurance. The Research Quarterly, 2, 328-332.

Merrick, M. A., Jutte, L. S., & Smith, M. E. (2003). Cold modalities with different thermodynamic properties produce different surface and intramuscular temperatures. Journal of Athletic Training, 38, 28-35.

Nicholas, C. W., Green, P. A., Hawkins, R. D., & Williams, C. (1997). Carbohydrate intake and recovery of intermittent running capacity. International Journal of Sport Nutrition, 7, 251-260.

Noakes, T. (2003). Lore of Running (4th ed.). Champaign, IL: Human Kinetics.

O’Conner, F. G., & Wilder, R. P. (2001). Textbook of Running Medicine. New York, NY: McGraw-Hill.

Paddon-Jones, D. J., & Quigley, B. M. (1997). Effects of cryotherapy on muscle soreness and strength following eccentric exercise. The International Journal of Sports Medicine, 18 (8), 588-593.

Pollock, M. L., Schmidt, D. H., & Jackson, A. S. (1980). Measurement of cardiorespiratory fitness and body composition in the clinical setting. Comprehensive Therapy, 6, 12-27.
Schniepp, J., Campbell, T. S., Powell, K. L., & Pincivero, D. M. (2002). The effects of cold water immersion on power output and heart rate in elite cyclists. Journal of Strength and Conditioning Research, 16 (4), 561-566.

Sellwood, K. L., Bruker, P., Williams, D., Nicol, A., & Hinman, R. (2007). Ice-water immersion and delayed-onset muscle soreness: a randomized controlled trial. British Journal of Sports Medicine, 41 (6), 392-397.

Sinclair, J., Olgesby, K., & Piepenburg, C. (2003). Training to Achieve Peak Running Performance. Boulder, CO: Road Runner Sports Inc.

Stamford, B., Giving injuries the cold treatment. (1996). The Physician and Sports Medicine, 23, 1-4.

Vaile, J., Gill, N. D., & Blazevich, A. J. (2007). The effect of contrast water therapy on symptoms of delayed onset of muscle soreness. Journal of Strength and Conditioning Research, 21 (3), 697-702.

Vaile, J., Halson, S., Gill, N., & Dawson, B. (2008). Effect of hydrotherapy on recovery from fatigue. International Journal of Sports Medicine, 29 (7), 5:39-544.

Vaile, J., Halson, S., Gill, N., & Dawson, B. (2008). Effect of hydrotherapy on the signs and symptoms of delayed onset muscle soreness. European Journal of Applied Physiology, 102(4), 447-455.

Verducci, F. M. (2000). Interval cryotherapy decreases fatigue during repeated weight lifting. The Journal of Athletic Training, 35, 422-426.

Yackzan, L., Adams, C., & Francis, K. T. (1984). The effects of ice massage on delayed muscle soreness. The American Journal of Sports Medicine, 12 (2), 159-165.

Appendices

Table 1
Table 2
Figure 1
Table 3
Table 4

2016-10-20T11:11:19-05:00April 24th, 2009|Sports Coaching, Sports Exercise Science, Sports Studies and Sports Psychology|Comments Off on Impact of Cold Water Immersion on 5km Racing Performance

Desirable Qualities, Attributes, and Characteristics of Successful Athletic Trainers – A National Study

Abstract

In an effort to determine the importance of desirable qualities, attributes and characteristics necessary for the success of interscholastic athletic trainers a Likert-type scale survey was mailed to all head athletic trainers of NCAA Division III institutions in the United States. The survey consisted of 24 statements allowing for the following responses: essential, very important, important, not very important, and irrelevant. The qualities that were deemed the most desirable by head athletic trainers were trustworthiness (76.2%), honesty (73.5%), dependability (66.4%), and possessing high ethical standards (66.4%). The two characteristics that were found to be the least essential were being a risk-taker (2.1%) and being a visionary (6.4%).

Introduction

Certified athletic trainers (ATCs) are allied health care professionals who specialize in preventing, recognizing, managing, and rehabilitating injuries that result from physical activity. The ATC works as part of a complete health care team and functions under the direction of a licensed physician and in cooperation with other health care professionals, athletics administrators, coaches, and parents (NATA, 2006c). In order to become a certified athletic trainer, an individual must graduate from a Commission on Accreditation of Athletic Training Education (CAATE) approved Athletic Training program and successfully pass the Board of Certification Examination (NATA, 2006b).

The Board of Certification, Inc. (BOC) regularly conducts a role delineation study among a sample of certified athletic trainers. This study determines the current role, or standards, of the profession. This role delineation study may also be considered a job analysis and determines the minimal competencies to practice as an athletic trainer. It also serves to define the contemporary standards of practice for the athletic training profession (NATA, 2006a). The information gathered by this job analysis is used as a template for the NATA Educational Council to develop the Educational Competencies for Athletic Training. These competencies define the minimum skills and characteristics that entry-level athletic trainers should possess and define the educational content that students enrolled in an accredited athletic training program must master. The competencies are broken down into 12 content areas (Table 1) (NATA, 2006a).

“Athletic trainers are the critical link between the sport program and medical community” (Anderson and Hall, 2000, p. 6) and fulfilling this job requires the athletic trainer to fill many roles. In addition to the educational knowledge outlined by the educational competencies, ATCs must possess other qualities and attributes in order to succeed in the all-encompassing role of athletic trainer. Arnheim and Prentice (2000) describe some of these qualities as stamina and ability to adapt, empathy, sense of humor, communication, intellectual curiosity, ethical standards, and being active in professional organizations. Gaedek, Toolelian & Schaffer (1983) describe communication with other athletic trainers, physicians, physical therapists, and so forth as one of the primary attributes an ATC must possess.

Attaining a position in athletic training and, ultimately, success as an athletic trainer can be dependent upon several factors. Employers look for candidates who have both a formal and informal educational background (including certification from the BOC) as well as a demonstration of other skills and attributes that might have been obtained through experience as well as through formal educational courses (Gaedeke, Toolelian & Schaffer, 1983). When looking at employers’ hiring criteria for athletic trainers, the prevailing criterion predicting employment and salary is the educational status of the applicant (Kahanov and Andrews, 2001). This study by Kahanov and Andrews (2001) found that the four most important criteria for hiring were personal characteristics, educational experience, professional experience, and work-related attributes. Educational experience included a college minor, grade point average, membership in a fraternity, and college reputation. The personal characteristics included self-confidence, maturity, interpersonal skills, assertiveness, enthusiasm, technical skills, ability to articulate goals, oral communication skills, leadership skills, initiative, ambition, problem-solving skills, writing skills and personal appearance. Smith (2006, p.47) states that “certification and experience are important, but possibly even more critical are personality, character, and people skills”. Certified athletic trainers hold the key to a successful program, whether it is a professional team, a school, a physician’s office, a hospital, or a clinic. Thus, it is imperative to hire the right person for the job (Smith, 2006).

Although the literature contains many studies highlighting hiring criteria and desirable knowledge areas for ATCs, very few studies have investigated the personal characteristics and qualities of certified athletic trainers as viewed by employers in specific employment settings. The purpose of this study was to investigate the desired personal qualities, attributes, and characteristics of certified athletic trainers in the division III setting as viewed by head athletic trainers in these settings. To date, this is the only national study that surveyed all of the division III head ATCs asking them what personal qualities, attributes, and characteristics they believed to be important for the success of ATCs.

Methodology

Population:

The population surveyed included head athletic trainers of all NCAA division III colleges and universities. The mailing addresses of the colleges and universities were obtained from the NCAA headquarters located in Indianapolis, Indiana. Of the 410 surveys mailed out, 185 were returned for a return rate of 45.1%.

Survey Instrument:

The survey instrument utilized in the study was approved by the Institutional Review Board at the surveying institution. The instrument was developed based upon the professional literature and as well as communication with experts in the area of athletic training. Twenty-four specific skills and competencies were identified and included in the survey.

Procedures:

After approval of the survey instrument, all surveys were mailed to the NCAA division III head athletic trainers. A return envelope that was pre-stamped, and addressed to the principal investigator, was included in the mailings. Anonymity of the head athletic trainer, as well as the college and university surveyed, was ensured.

The head athletic trainers were asked to provide their opinions as to the level of importance of the personal qualities, attributes, and characteristics included on the survey that were related to the success of the athletic trainers in providing health care to student athletes. By responding to a 5-point Likert scale, essential, very important, important, not very important, irrelevant, the head athletic trainers provided their opinions as to the level of importance of specific skills and competencies found in successful athletic trainers.

Findings

The findings are displayed in Table 2 and revealed varied opinions regarding the importance of personal qualities, attributes, and characteristics that Division III head athletic trainers believed to be essential, very important, important, not very important, and irrelevant in order to be successful as an athletic trainer at the Division III level. Most of the items were identified as either essential or very important; however, some were not viewed as highly.

Six items were reported as the most important personal attributes for successful ATCs. These items had the highest percentage of responses as essential to the success of athletic trainers at the Division III level:

  • Trustworthiness (76.2%)
  • Honesty (73.5%)
  • High ethical standards (66.4%)
  • Dependable (66.4%)
  • Adaptable (62.7%)
  • Communicator (61.6%)

In addition to the attributes reported as essential, three items were reported as being highly desirable (either essential or very important) by 90% of the respondents:

  • Leadership (93.7%)
  • Decisiveness (91.8%)
  • Consistency (91.2%)

Head athletic trainers viewed the following as having the least impact (essential or very important) among all of the selected skills and competencies on success of the Division III ATCs:

  • Risk taker (19.9%)
  • High energy level (45.6%)
  • Visionary (46.9%)

Discussion

This study examined the desirable personal qualities and attributes necessary to be a successful athletic trainer at the Division III level. The most desirable characteristics reported by head athletic trainers in this study, honesty, trustworthiness, and high ethical standards, can be grouped together as ethical qualities. Each of these attributes is important to the ability of the ATC to provide high quality health care to the physically active. All members of the NATA are required to observe the NATA Code of Ethics, which provides an outline of ethical behavior that should be followed in the practice of athletic training. The Code is comprised of 5 principals and presents aspirational standards of behavior that all members should strive to achieve (NATA, 2006c). ATCs typically deal with many controversial and sensitive issues in which honesty, trustworthiness, and high ethical standards are of the utmost importance. Some of these sensitive situations may include athletes with diseases or conditions, such as HIV or hepatitis, athletes with sexually transmitted diseases, athletes with season-ending or career-ending injuries, and athletes that may be using, or are suspected of using, performance enhancing substances. In each of these scenarios, the ATC may find themselves exposed to extremely sensitive and confidential information. Confidential information that is obtained as part of the professional relationship that an ATC has with an athlete might be personal, private, and sensitive. The ATC should handle this sensitive information carefully to avoid ethical, as well as legal, breaches of confidentiality. Another issue related to the ethical standards of athletic trainers is the high profile of athletes and of the athletic industry in our society. The accessibility of the media and the public’s desire to know everything possible about their teams and athletes can be a significant threat to an athlete’s privacy and to the confidentiality of information to which the ATC is privy (Ray, 2005). The fact that the respondents in this study valued the ethical attributes establishes the importance of the Code of Ethics in the daily practice of the ATC.

Trustworthiness is not only important when dealing with the confidentiality issues, but it is extremely important in establishing a good rapport between the athlete and the athletic trainer. The athlete needs to respect the athletic trainer as a person before they can trust the athletic trainer in the rehabilitative setting. The ATC must gain the trust of the athlete before the athlete will follow the protocols and programs designed for them by their athletic trainer (Arnheim and Prentice, 2000).

Other attributes that were deemed highly desirable were adaptability and dependability. Arnheim and Prentice (2000, p. 16) report, “The athletic trainer must be able to adapt to new situations with ease.” This is due to the large number of athletes and teams that they are typically responsible for covering. Practice and game schedules are frequently canceled or modified, depending on factors such as weather, facility availability, team condition, travel schedules, and so forth. In many cases, ATCs are at the mercy of the coaches and administrators in determining these schedules and may not be consulted as to their opinions in those matters. Due to the unique skills which the ATC provides, they are difficult to replace and they must be present at all practices and contests in order to provide the high quality health care that the athletes deserve.

The ability to communicate is an attribute that was deemed essential by 61.6% of the respondents; however, we expected a higher percentage of the head athletic trainers to list this as essential. Athletic trainers are often described as a liaison between athletes, coaches, team physicians, and other allied health care professionals. This role requires the ATC to serve as an educator, psychologist, counselor, therapist, and/or administrator and is dependent upon a constant flow of oral and written communication (Arnheim and Prentice, 2000). Lockard (2005) stressed the importance of having positive relationships by stating that because athletic trainers deal with a variety of people, they need good social and communication skills.

Personal attributes that were deemed desirable by the respondents were decisiveness and leadership. Decisiveness is a characteristic that does not appear in any of the previous literature relating to desirable personal attributes or hiring characteristics for an ATC. During the course of any typical day for an ATC, many situations arise in which the athletic trainer must make important decisions. Referral decisions are an inherent part of the injury management domain of athletic training, especially those dealing with potentially catastrophic injuries. These decisions must be made spontaneously in many cases with the well-being of the athlete at stake.

The importance of leadership in our study is similar to the findings of Kahanov and Andrews (2001). They listed leadership as one of 16 characteristics that were viewed as important by employers when hiring ATCs across different job settings, although leadership was not rated as highly as other characteristics in their study. As mentioned previously, the ATC is typically the leader or coordinator of the sports medicine team (NATA, 2006e). Smith (2006) stated that certified athletic trainers hold the key to a successful program, whether it is a professional team, a school, a physician’s office, a hospital, or at a clinic.

The personal attribute that was reported to be the least important in the Division III setting was being a risk-taker. This finding is not surprising when considering the myriad of legal and ethical issues confronting ATCs today. Risk management is an important term to all ATCs today, and the athletic trainer is intimately involved in developing safe athletic programs in all types of settings. Lyznicki et al. (1999) found the implementation of risk management programs by athletic trainers to be important in that it minimized liability in secondary schools. Chen and Esposito (2004) recognized the importance of risk management and acknowledged the need for athletic trainers to formulate a risk management plan.

Another personal attribute that was not deemed essential to the success of athletic trainers at the division III level was high energy level. Only 16.2% of the respondents reported this to be essential, while 39.4 % rated this as very important. This finding is extremely surprising and is contrary to many commonly described views of the ATC. ATCs typically work extremely long hours and are asked to cover numerous sporting events every day. Arnheim and Prentice (2000, p. 16) state, “Athletic training is not the field for a person who likes an 8-to-5 job. Long, arduous hours of often strenuous work will sap the reserve strength of anyone not in the best of physical and emotional health. Athletic training requires abundant energy, vitality, and physical and emotional stability.” In recent years, the NCAA and other administrators have begun to recognize the long hours and busy days of ATCs and have implemented changes in the sports medicine coverage provided by ATCs. The NCAA recently implemented the guidelines for appropriate medical coverage for intercollegiate athletics (NATA, 2003), which generally increases the number of ATCs required to meet the health care needs of student athletes on NCAA college campuses. This document suggested to collegiate administrators that they need to hire more certified athletic trainers to cover the ever-increasing health care needs of their student athletes. This recently implemented guideline may have in fact alleviated some of the long hours and strenuous days that had become commonplace for the ATC. With the addition of more staff, head ATCs may now feel that having a high energy level is not as important as it was traditionally viewed.

Being a visionary is another characteristic that was not reported as desirable as some of the others. Athletic training is a relatively young profession and the physically active community is just beginning to recognize the role and importance of ATCs in providing health care to the physically active. The recent evolution of athletic training is due to the long-term vision of many early athletic trainers; however there are still many hurdles for ATCs to clear in order for athletic training to become fully integrated into the larger sports medicine field. Some of the important issues currently confronting NATA members are third party reimbursement, expanding employment settings, and refining the educational process. These are issues that many ATCs are concerned with and are highly intertwined with the long-term vision and strategic plan of the NATA. (NATA, 2006d). It is somewhat surprising to the authors that being a visionary is not deemed more desirable by head athletic trainers at the division III level.

Conclusion

The most important personal characteristics and attributes for ATCs at the division III level were related to ethical issues and included honesty, trustworthiness, and possessing high ethical standards. Other highly desirable characteristics were being adaptable, dependable, and a good communicator.

The least important personal attribute was being a risk-taker. Other attributes that, surprisingly, were not deemed as highly desirable were having a high energy level and being a visionary.

Table 1: Athletic Training Professional Competencies Areas

Risk Management and Injury Prevention
Pathology of Injuries and Illnesses
Orthopedic Clinical Examination and Diagnosis
Medical Conditions and Disabilities
Acute Care of Injuries and Illnesses
Therapeutic Modalities
Conditioning and Rehabilitative Exercise
Pharmacology
Psychosocial Intervention and Referral
Nutritional Aspects of Injuries and Illnesses
Health Care Administration
Professional Development and Responsibility

Table 2: Desirable Qualities, Attributes, and Characteristics of Successful Athletic Trainers

Qualities, Attributes, and Characteristics Essential (%) Very Important (%) Important (%) Not Very Important (%) Irrelevant (%)
Honesty 73.5 20.5 1 1 4
Punctuality 45.9 42.1 8 2.1 1.6
Decisiveness 56.2 35.6 4.3 1.8 2.1
Trustworthiness 76.2 17.8 2.8 0 3.2
Consistency 47.5 43.7 5.7 1 2.1
Enthusiastic 12.4 52.4 29.9 2.1 3.2
High energy level 16.2 39.4 40.2 3.7 .5
Role model 28.6 43.2 23.9 2.7 1.6
Leadership 35.6 48.4 11.8 2.1 2.1
Persistence 20 50.4 25.9 2.1 1.6
Helpfulness 26.4 23.2 47.2 .5 2.7
Altruism 12.4 51.5 28.6 5.4 2.1
High ethical standards 66.4 28.9 1 .5 3.2
Visionary 6.4 40.8 44.3 7.5 1
Patience 35.1 45.6 15.6 1.6 2.1
Risk taker 2.1 17.8 44.7 30.8 4.6
Loyal 23.7 43.7 27.3 3.2 2.1
Dedicated 43.7 42.9 8.1 3.2 2.1
Adaptable 62.9 29.9 4 .5 2.7
Diplomatic 24.3 50.5 21 3.7 .5
Professional visual image 30.8 43.7 19.1 3.2 3.2
Communicator 61.8 31.3 3.7 .5 2.7
Empathetic 28.1 50.5 17.2 2.1 2.1
Dependable 66.4 29.9 .5 .5 2.7

Note: The values represent mean percentages of the Likert-type-scale responses.

References

Anderson, M. K., Hall, S. J, & Martin, M. (2000). Sports injury management and the athletic trainer. In Sports injury management. (2nd ed.) Baltimore, MD: Lippincott Williams & Wilkins.

Arnheim, D. D, & Prentice, W. E. (2000). The athletic trainer and the sports medicine team. In Principle of athletic training. (10th ed.) New York, NY: McGraw-Hill.

Chen, S., & Esposito, E. (2004). Practical and critical legal concerns for sport physicians and athletic trainers. Sport Journal, 7(2), Retrieved December 3, 2006, from http://www.thesportjournal.org/2004Journal/Vol7-No2/ChenEsposito.asp

Gaedeke, R., Toolelian D., & Schaffer, B. (1983). Employers want motivated communicators for entry-level marketing positions. Market News. 5, 1.

Kahanov, L., & Andrews, L. (2001). A survey of athletic training employers’ hiring criteria. Journal of Athletic Training, 36(4), 408-412.

Lockard, B. C. (2005). Athletic trainers: Providing healthcare for athletes of all kinds.

Occupational Outlook Quarterly, 49(1), 38-41.

Lyznicki, J. M., Riggs, J. A., & Champion, H. C. (1999). Certified athletic trainers in secondary schools: report of the council on scientific affairs, American Medical Association. Journal of Athletic Training, 34(3), 272-276.

National Athletic Trainers’ Association. (2006a) Athletic training educational competencies. (4th ed.). Dallas, TX: NATA.

National Athletic Trainers’ Association. (2006b). Athletic training education overview. Retrieved on November 20, 2006 from www.nata.org/consumer/docs/educationfactsheet05.pdf

National Athletic Trainers’ Association. (2006c). NATA Code of Ethics. Retrieved on January 30, 2007 from http://www.nata.org/codeofethics/code_of_ethics.pdf

National Athletic Trainers’ Association (2006d). Strategic Plan. Retrieved on January 27, 2006 from www.nata.org

National Athletic Trainers’ Association. (2006e). What is a certified athletic trainer?. Retrieved on November 20, 2006 from www.nata.org

National Athletic Trainers’ Association. (2003). Recommendations and guidelines for appropriate medical coverage of intercollegiate athletics. Retrieved on November 1, 2006 from www.nata.org/statements/support/amciarecsandguides.pdf

Ray, R. (2005). Ethics in sports medicine. In management strategies in athletic training. (3rd ed.) Champaign, IL: Human Kinetics.

Smith, L. (2006, November). Big job small staff. Training and Conditioning, pp. 47-51.

Author’s Note

Timothy J. Henry, Associate Professor and Athletic Training Program Coordinator, The State University of New York at Brockport; Robert C. Schneider, Associate Professor, Department of Physical Education and Sport, The State University of New York at Brockport; William F. Stier, Jr., Distinguished Service Professor and Graduate Director, Department of Physical Education and Sport, The State University of New York at Brockport.

Correspondence concerning this article should be addressed to Timothy J. Henry, Department of Physical Education and Sport, The State University of New York at Brockport, 350 New Campus Drive, Brockport, NY 14420. E-mail: thenry@brockport.edu; Fax: 585-395-2771; Work Phone: 585-395-5357.

2016-10-20T11:37:32-05:00April 16th, 2009|Contemporary Sports Issues, Sports Coaching, Sports Management|Comments Off on Desirable Qualities, Attributes, and Characteristics of Successful Athletic Trainers – A National Study

A New Scale Measuring Coaches’ Unethical Behaviors for Comparison by Gender, Age, and Education Level of Coach

Abstract

An effort to develop a scale measuring coaches’ unethical behaviors included two phases. In the first, factor and reliability analyses were made of potential survey items meant to gather data from athletes describing coaches’ behavior. In the second, select items were incorporated in a survey randomly administered to 221 male and female taekwondo competitors at a national competition in 2006, for comparison of behaviors by coach gender, age, and education. Behavior was not found to differ significantly by gender (n = 219, t = 1.71, p > .05), age (n = 216, t = 1.13, p > .05), or education (n = 217, t = 1.60, p > .05).

A New Scale Measuring Coaches’ Unethical Behaviors for Comparison by Gender, Age, and Education Level of Coach

In coaching, a code of ethics is a tool providing a minimum standard of conduct and behavior expected of the coach as he or she develops into a professional. Many other professions, including medicine and law, also expect members to adhere to a behavior code requiring them to do their best and maintain professional standards (Ring, 1992). Codes established for coaches provide common values and guidelines for performing one’s job.

It has been suggested that there is a sensitive relationship between physical education and moral education. Stoll (1995), who is with the University of Idaho Center for Ethical Theory and Honor in Competitive Sports, emphasized that “physical education and athletic programs could be harmonious in promoting the development of sportsmanlike behaviors, ethical decision-making skills, and a total curriculum for moral character development.” Many studies by philosophers of sport concern the relationship of moral education and competition concepts; many conclude that a completed sports education involving both competition and development of an understanding of fair play effects a moral education (i.e., an education in moral values such as honesty, equality, justice, and respect) (Bergmann, 2000; Carr, 1998; Priest, Krause, & Beach, 1999; Singleton, 2003; Spencer, 1993). Sabock (1985) argued that sports provide students an important opportunity to develop ethical behaviors including honesty and fairness. Bergmann (2000) noted a logical relationship between physical education and moral education, one based on students’ understanding of the concept of success and their acceptance of the importance of competitions. Bergmann added that, through competition, students have opportunities to compare their skills and talents to those of others, which motivates them to gain practical knowledge meeting certain standards.

As role models for athletes, coaches can help them develop fair and ethical behavior by demonstrating how these can be applied in sports. Coaches have the capacity to teach and reinforce ethical behavior by athletes and indeed are central to value development in young people, since they are role models of institutional norms (Wandzilak, 1985).

Today, however, unethical behavior exhibited in the course of coaching is decreasing respect for coaches and for sports. Too many coaches approach their duties without adequate regard for values such as honesty, objectivity, and justice. This is so despite the fact that many sports organizations and communities have published codes of ethics that coaches are expected to uphold (American National Youth Sports Coaches Association, n.d.; American Psychological Association, 1992; Australian Sports Commission, n.d.; British Institute of Sports Coaches, n.d.; Canadian Professional Coaches Association, 2003; International Coaches Federation, 2003; Sports Medicine Australia, n.d.; Sports Coach, n.d.). Figure 1 presents a summary of the standards set out by these codes of conduct, classifying them as either a responsibility of coaches or a form of respect coaches are expected to demonstrate.

Responsibility Respect
1. A coach should provide a healthy environment for competition and practice.2. A coach should always work toward personal development, in order to continuously improve his or her job performance.

3. A coach should provide the media and members of the public with correct information.

4. A coach should direct injured athletes to medical treatment and act in accord with medical professionals’ instructions and suggestions.

5. A coach should help athletes with their personal and family problems.

6. A coach’s support should extend to athletes in need, whether or not they are his or her own athletes.

7. A coach should work cooperatively with any expert who might contribute to the development of athletes.

8. A coach should inform athletes of how they should behave during media interviews.

9. A coach should not use training techniques that are harmful to athletes.

10. A coach should select equipment carefully to ensure athletes’ safety.

11. A coach should have the injured athlete’s well-being in mind when deciding whether to permit a return to competition and should never permit return ahead of complete recovery.

12. A coach should assign athletes appropriate responsibilities in order to contribute to their development.

13. A coach should take a protective stance toward athletes when it comes to harmful drugs, by informing athletes about drugs’ dangers.

14. A coach of nonprofessional athletes should schedule practice and competitions that do not interfere with athletes’ need to develop academically.

15. A coach should develop effective ways of communicating to athletes and their families their rights and responsibilities as part of the team.

16. A coach should emphasize education’s importance to athletes, as well as sports’ importance.

17. A coach should instill in athletes the idea that winning results from good team work.

18. A coach should always ensure that athletes receive an explanation of the objectives of training.

19. A coach who disciplines an athlete through punishment should not, in so doing, harm the athlete’s personality.

20. A coach should always explain for athletes the objectives of any rule that will be applied.

1. A coach should have respect for each athlete’s being.2. A coach should avoid behavior that is likely to diminish the respect afforded him or her by the society.

3. A coach should not exaggerate his or her capabilities.

4. A coach should encourage fair play and sportsmanlike behavior.

5. A coach should keep confidential all personal information on athletes (e.g., personal problems, family problems) and all information about the coach’s job (e.g., budget, recruitment policy), unless disclosure is required by law.

6. A coach should emphasize honesty in competition.

7. A coach should respect the rules of competition.

8. A coach should respect written and unwritten rules of fair play.

9. A coach should respect decisions of referees during competitions.

10. A coach should not encourage athletes or spectators to disrespect referees.

11. A coach should always have his or her behavior under control.

12. A coach should not use negative words to criticize other coaches or organizations.

13. A coach should take responsibility in areas in which he or she feels confident.

14. A coach should not criticize athletes publicly or act to hurt them.

Figure 1. Summary of coaching behaviors mandated by various organizational codes of ethics.

When such standards are ignored, unethical coaching behaviors typically fall into four main categories, according to the United States Olympic Committee (DeSensi & Rosenberg, 1996). They are (a) offending athletes verbally or physically, (b) treating athletes inhumanely, (c) encouraging athletes’ use of performance-enhancing drugs; and (d) ignoring the athletic program’s educational goals. In its various forms, unethical behavior in coaching is becoming an important topic in the physical education literature. The present study’s purpose was to develop a valid and reliable scale measuring the extent of unethical behavior by coaches and then to test whether their unethical behavior was associated with gender, age, or educational level.

Method

Sampling and Research Design

The study collected data in 2006 from 221 competitors in a national taekwondo championship, 86 of whom were female (38.9%) and 135 of whom were male (61.1%). The majority of the sample (76.9%) were ages 17 to 23 years. The mean length of their experience in taekwondo was 7 ± 3 years. The average age at which they began high-performance training (attending training camps and national and international competitions regularly) was 8 ± 2 years.

Instruments and Data Collection

The instrument was developed in three phases. First, from a review of the codes of ethics of the American National Youth Sports Coaches Association (n.d.), American Psychological Association (1992), British Institute of Sports Coaches (n.d.), Canadian Professional Coaches Association (n.d.), International Coach Federation (n.d.), Sports Medicine Australia (n.d.), Sports Coach (n.d.), and several Olympic committees, a pool of 48 survey items was created and subsequently analyzed.

Second, with the 48 items providing a basis, an instrument was developed that used a 5-point Likert-type response scale ranging from 1 (strongly disagree) to 5 (strongly agree) to assess perceived ethical or unethical nature of coaching behaviors (see Table 1). This instrument was administered to a group of 18 taekwondo coaches, taekwondo players, and faculty members or instructors knowledgeable of the sport. They read each item on the instrument and circled a response. The 18 participants unanimously assigned a score of 5 to 35 of the items, so these 35 were accepted by the researcher as describing unethical behaviors (Balci, 1993). The scale was dubbed the Coaches’ Unethical Behaviors Scale, or CUBS.

Table 1

Score Levels Reflected in 5-Point Likert-Type Scale

Choice Score Level
1 Strongly disagree 1.00–1.79
2 Disagree 1.80–2.59
3 Undecided 2.60–3.39
4 Agree 3.40–4.19
5 Strongly agree 4.20–5.00

In the third phase, the final CUBS instrument of 35 items (with 5-point Likert-type response categories) was administered to the 221 taekwondo contestants. Each item posed a scenario involving coaching behavior; respondents circled the numeral indicating how strongly they agreed that they had experienced their coaches demonstrating the unethical behavior.

Statistical Analysis

The construct validity of CUBS was evaluated using exploratory factor analysis (EFA). EFA seeks to identify a factor or factors based on relationships among variables (Kline, 1994; Stevens, 1996; Tabachnick & Fidell, 2001). The reliability of CUBS was assessed using the Cronbach’s alpha coefficient and Spearman-Brown (split-half) correlation. In order to test whether coaches’ unethical behaviors change with gender, age, and educational level, a t test and one-way ANOVA analysis were applied.

Findings

Factor Structure of CUBS: Construct Validity

Results of exploratory factor analysis assessing CUBS’ validity showed 11 of the 35 items to have a factor loading below .45. These 11 were extracted, and the analysis was repeated with the remaining 24 items. Of these, 14 could be classified as pertaining to coaches’ responsibility for athletes, for rules, and for the integrity of the coaching profession; the 14 became Factor 1. The remaining 10 could be classified as forms of respect coaches are charged with upholding (for example, respect for individuals, personalities, gender, and health). These became Factor 2.

For Factor 1, factor loading ranged from .562 to .847, while for Factor 2 it ranged from .561 to .782. Factor 1 accounted for 50.34% of variance, and Factor 2 accounted for 11.31%, so together the factors accounted for 61.65% of total variance (see Table 2).

Item Factor 1 Factor 2 Communalities Variance
1 .562 .466 .533
2 .589 .424 .527
3 .761 .359 .708
4 .674 .426 .635
5 .719 .352 .641
6 .641 .436 .601
7 .758 .155 .599
8 .747 .192 .594
9 .794 .328 .738
10 .833 0.61 .698
11 .811 .228 .710
12 .720 .285 .600
13 .847 .262 .786
14 .834 .281 .774
15 .777 0.46 .606
01 .211 .675 .500
02 .301 .721 .611
03 .377 .561 .456
04 .236 .667 .501
05 .131 .709 .519
06 .191 .737 .580
07 .308 .782 .706
08 0.94 .753 .576
09 .180 .752 .597

Reliability

The reliability of CUBS was assessed using Cronbach’s alpha and the Spearman-Brown correlation. The Cronbach’s alpha coefficients indicate internal consistency; for the two CUBS subscales administered to the 221 athletes, Cronbach’s alpha was .78 for Factor 1 and .77 for Factor 2. The total internal consistency for the scale was .76. The Spearman-Brown correlation yielded .98 for Factor 1 and .93 for Factor 2. Total correlation for CUBS was thus .92.

Corrected item total correlations, which ranged from .63 to .87, are shown in Table 3, along with t-test scores for the items in CUBS. Statistical significance at a level of p < .01 was attained for each item’s mean score.

Table 3

Corrected Item Total Correlations and t Scores for Items in CUBS

Item Factor 1 Factor 2 t p
1 .67 -7,122 .000
2 .70 -8,587 .000
3 .81 -9,341 .000
4 .77 -10,376 .000
5 .79 -10,645 .000
6 .76 -10,468 .000
7 .74 -9,826 .000
8 .75 -11,786 .000
9 .86 -11,590 .000
10 .78 -9,253 .000
11 .82 -12,238 .000
12 .76 -11,763 .000
13 .87 -14,444 .000
14 .86 -9,477 .000
15 .69 -11,574 .000
01 .67 -11,814 .000
02 .74 -9,108 .000
03 .63 -12,701 .000
04 .66 -10,988 .000
05 .74 -10,084 .000
06 .68 -10,174 .000
07 .74 -12,483 .000
08 .81 -11,849 .000
09 .70 -10,783 .000

Unethical Behaviors of Coaches

Using the data from the surveyed taekwondo competitors, coaches’ unethical behaviors were measured with descriptive statistics (see Table 4). As Table 4 illustrates, the athletes reported they had observed in the behavior of their coaches the 24 unethical behaviors reflected in CUBS, although the values measured for these behaviors were low. Observed unethical behavior did not, according to t-test results, appear significantly dependent on gender (n = 219, t = 1.71, p > .05), age (n = 216, t = 1.13, p > .05), or education level (n = 217, t = 1.60 p > .05).

Table 4

Mean, Standard Deviation, and Percentages for Coaches’ Unethical Behaviors as Indicated by CUBS Respondents

Unethical Behaviors M SD %
Responsibility
1. The coach does not deal honestly with athletes. 1.56 1.01 5.50
2. The coach does not inform athletes about harmful effects of drugs (drug abuse). 1.75 1.14 12.70
3. The coach does not build respectful, effective communication with athletes. 1.60 0.95 4.10
4. The coach encourages athletes’ weight loss via means that may harm their health. 1.75 1.02 7.30
5. The coach does not provide athletes necessary information about training. 1.61 0.98 7.70
6. The coach does not continuously improve his or her professional knowledge and skills. 1.72 1.16 10.90
7. The coach does not care about honesty in competition. 1.80 1.17 10.40
8. The coach does not know the legal regulations relevant to his or her sport. 1.53 1.00 5.00
9. The coach does not have sufficient knowledge of training science. 1.73 1.16 13.6
10. The coach abuses his or her authority as a coach. 1.61 0.99 6.80
11. The coach is not honest about the finances of competition. 1.62 1.04 5.90
12. The coach does not prepare effective training programs reflecting athletes’ ability levels. 1.84 1.11 7.20
13. The coach does not evaluate athletes’ performances as they reflect established goals. 1.66 1.00 5.90
14. The coach does not provide athletes with feedback about their performances. 1.68 0.99 7.20
Respect
1. The coach does not treat athletes respectfully. 1.39 0.95 5.90
2. The coach discriminates among athletes based on gender, religion, or language. 1.44 0.82 3.20
3. The coach curses or uses street language. 1.41 0.77 9.00
4. The coach does not respect the being of the athletes. 1.42 0.76 3.60
5. The coach is not careful to avoid harming athletes’ personalities when using punishment to discipline them. 1.56 0.89 5.50
6. The coach causes athletes physical harm in the course of using punishment to discipline them. 1.61 0.95 7.70
7. The coach discriminates among athletes based on reasons other than individual merit. 1.97 1.22 15.00
8. The coach degrades athletes with insults. 1.52 0.87 6.40
9. The coach becomes publicly angry and displays violence after a defeat in competition. 1.62 1.02 8.60
10. The coach does not respect rules and referees. 1.67 1.04 6.80

Discussion and Results

The present study’s purpose was to develop a valid and reliable scale measuring the extent of unethical behavior by coaches and then to test whether their unethical behavior was associated with gender, age, or educational level. CUBS is such a scale, according to the results of factor and reliability analysis (Kline, 1994; Stevens, 1996; Tabachick & Fidell, 2001).

Data obtained with CUBS were subjected to descriptive statistical analysis that suggested the three most frequent unethical behaviors in coaching are discrimination among athletes based on reasons other than individual merit; lack of technical knowledge; and failure to offer athletes facts about harmful drug use. Coaches’ unethical behaviors did not change to a significant degree with changes in gender, age, or education level, according to ANOVA and t-test results.

Addressing ethical issues is becoming a standard part of a coach’s duties. Increasingly, sports coaches must be able to teach and model fair play, respect for officials, paramount concern for athletes’ well-being (rather than the win-loss record), and the wise and legitimate use of power. At the same time, they must steer athletes away from harmful drug use, cheating, bullying, harassment, and eating disorders. The coach’s position on these issues, reflected in his or her coaching behaviors, has enormous impact on athletes, shaping their enjoyment of sports, their attitudes toward their peers in a sport, their self-esteem, and their continued involvement in sports.

The sports ethicist’s basic goal is to see individuals in sports accept a pertinent ethical code (Wuest & Bucher, 1987) and embody that code in their behavior patterns. The aim for the profession of coaching is each coach’s acceptance of an ethical code for his or her sport, exhibited in daily behavior. A scale like CUBS can not only indicate the level of unethical behaviors coaches engage in, it can point the way to the most urgently needed additions to coach education and development programs.

Knowledge and skills are vital to a profession, but appropriate attitudes and behaviors—professional ethics—are just as important. Professional ethics involve written codes containing rules tailored to specific professions and founded in general moral values like honesty, equality, justice, and respect (Fain, 1992; Pritchard, 1998). Unlike in the past, a workforce today is likely to include people of various races, ages, religions, educational levels, and socioeconomic statuses. They are likely to possess divergent values (Lankard, 1991; Frederick, Post, & Davis, 1988). Inculcating a set of professional ethics ensures that, although they are very different people, members of a profession together espouse common standards and rules designed to protect both themselves and the people they serve. The changing nature of the business world has increased the need for professional ethics, the most important characteristic of which is the need for systems, structures, and management that can secure compliance.

A common understanding of sports is that they consist of various activities people pursue that lead to competition (Penney & Chandler, 2000). In fact, sports is a multidimensional phenomenon. It involves social structures (an indispensable part of human life), and it is based on long-established ethical and value systems (Whitehead, 1998). A number of sports organizations want to see the essential ethical nature of sports brought home to spectators and the society by developing athletes’ and coaches’ ethics (Wuest & Bucher, 1987).

Concern for ethics (or the lack of concern) will have an important role in how sports continues to develop; much of the related work will fall to coaches, who are expected to do their jobs honestly, objectively, openly, and with respect and a sense of justice, tying their work to universal values and principles (Wuest & Bucher, 1999). Coaches who may be held responsible for demonstrating ethical behaviors need, first of all, to understand their sports’ particular ethical codes.

The present study was the very first research conducted in Turkey into unethical behaviors exhibited in coaching. Moreover, to date the literature worldwide has offered few studies on coaches’ unethical behaviors. For this reason, further research employing various designs, with various samples, is likely to contribute to understanding of the topic.

References

American National Youth Sports Coaches Association. (n.d.). Coaches’ code of ethics. Retrieved March 22, 2004, from http://www.nays.org

American Psychological Association. (1992). Ethical principles of psychologists and code of conduct.

American Psychologist, 47(12), 1597–1611.

Australian Sports Commission (n.d.). Ethics in sports: Code of behavior. Retrieved August 31, 2007, from http://www.ausport.gov.au/ethics

Balci, A. (1993). Research in social science: Method, technique and principles. Ankara: Öncü.
Bergmann, D. S. (2000). The logical connection between moral education and physical education. Journal of Curriculum Studies, 32(4), 561–573.

British Institute of Sports Coaches. (n.d.). Code of ethics and conduct for sport coaches. Retrieved April 26, 2002, from http://www.brianmac.co.uk/ethics.htm

Canadian Professional Coaches Association (n.d.). Coaches of Canada coaching code of ethics: Principles and ethical standards. Retrieved December 19, 2008, from http://coach.ca/eng/certification/documents/REP_CodeofEthics_01042006.pdf

Carr, D. (1998). What moral educational significance has physical education? A question in need of disambiguation. In M. J. McNamee & S. J. Parry (Eds.), Ethics and sport (pp. 119–133). London: E & FN Spon.

DeSensi, J. T., & Rosenberg, D. (1996). Ethics in sports management. Morgantown, WV: Fıtness Information Technology.

Fain, G. S. (1992). Ethics in health, physical education, recreation and dance. (Report No. ED342775 1992-04-00). Washington, DC: ERIC Digest. (ERIC Document Reproduction Service No. ED342775)

International Coach Federation (n.d.). The ICF code of ethics. Retrieved December 18, 2008, from http://www.coachfederation.org/ICF/For+Current+Members/Ethical+Guidelines/

Kline, P. (1994). An easy guide to factor analysis. New York: Routledge.

Lankard, B. A. (1991). Resolving ethical dilemmas in the workplace: A new focus for career development. (Report No. ED334468 1991-00-00). Washington, DC: ERIC Digest. (ERIC Document Reproduction Service No. ED334468)

Penney, D., & Chandler, T. (2000). Physical education: What future(s)? Sport, Education and Society, 5(1), 71–87.

Priest, R. F., Krause, J. V., & Beach, J. (1999). Four-year changes in college athletes: Ethical value choices in sports situations. Research Quarterly for Exercise and Sport, 70, 170–178.

Ring, J. J. (1992). An alliance to excellence: To preserve medical professionalism. Vital Speeches of the Day, 58(12), 367–368.

Sabock, R. (1985). Coach (3rd ed). Champaign, IL: Human Kinetics.

Singleton, E. C. (2003). Rules? relationships?: A feminist analysis of competition and fair play in physical education. Quest, 55, 495–209.

Spencer, A. F. (1996). Ethics in physical education and sport education. Journal of Physical Education, Recreation and Dance, 67(7), 37­–39.

Sports Medicine Australia. (n.d.). Sports Medicine Australia sports first-aider/sports trainer code of ethics. Retrieved December 19, 2008, from http://www.sma.org.au/sportstrainers/ethics.asp

Stevens, J. P. (1996). Applied multivariate statistics for the social sciences (3rd ed.). Mahwah, NJ: Lawrence Erlbaum.

Stoll, S. K. (1995). Should we teach morality?: The issue of moral education. In A. E. Jewett, L. L.

Bain, & C. D. Ennis (Eds.), The curriculum process in physical education (2nd ed.), 334.

Tabachnick, B. G., & Fidell, L. S. (2001). Using multivariate statistics (4th ed.). Boston: Allyn and Bacon.

Sports Coach (n.d.). Code of ethics and conduct for sports coaches. Retrieved December 19, 2008, from http://www.brianmac.co.uk/ethics.htm

Wandzilak, T. (1985). Values development through physical education and athletics. Quest, 37, 176–185.

Whitehead, M. E. (1998). Sport ethics and education. Sport, Education and Society, 3(2), 239–241.

Frederick, W. C., Post, J. E., & Davis, K. (1988). Business and society: Corporate strategy, public policy, ethics (6th ed.). Columbus, OH: McGraw-Hill.

Wuest, D. A., & Bucher, C. A. (1986). Foundations of physical education and sport (10th ed.). St. Louis, MO: Times Mirror/Mosby.

Wuest, D. A., & Bucher, C. A. (Eds.). (1999). Foundations of physical education and sport (13th ed.). New York: WCB/McGraw-Hill.

2017-08-07T11:39:17-05:00January 8th, 2009|Contemporary Sports Issues, Sports Coaching, Sports Facilities, Sports Management, Sports Studies and Sports Psychology|Comments Off on A New Scale Measuring Coaches’ Unethical Behaviors for Comparison by Gender, Age, and Education Level of Coach

Characteristics Contributing to the Success of a Sports Coach

Abstract

Identifying particular characteristics (qualities and abilities) of successful sports coaches could offer other coaches help in improving their performance. Toward this end, 15 high school coaches completed a survey on 17 possible such characteristics, ranking 5 of them above the rest (≥ 90th percentile): quality of practice, communicating with athletes, motivating athletes, developing athletes’ sports skills, and possessing knowledge of the sport. Coaches seeking to enhance their success might focus on these characteristics.

(more…)

2016-09-30T08:25:51-05:00January 7th, 2009|Contemporary Sports Issues, Sports Coaching, Sports Exercise Science|Comments Off on Characteristics Contributing to the Success of a Sports Coach
Go to Top