The Physical and Physiological Properties of Football Players from a Turkish Professional First-Division Football League

Abstract

This research aims to determine the effects of a six weeks pre-season
preparation training period on the physical and physiological characteristics
of a football team in the Turkish Professional First Division League.
Twenty football players participated in this study. Their ages were 22.2
± 3.41 years old, and they had 12.4 ± 4.2 years of training.
Their height was 178.9 ± 5.13 cm. (Table 1). The body weight, body
fat percentage, flexibility, systolic/diastolic blood pressure, aerobic
capacity, anaerobic power, vertical jump, and speed of these players were
tested twice; once at the beginning of the six-week pre-season preparation
training period and again at the end of the training period (Table 2).
Research data was evaluated statistically with pair-t test at a significance
level of (p‹ 0.05). There were some significant changes in weight,
body fat percent, systolic/diastolic blood pressure, aerobic capacity,
anaerobic power, and vertical jump. There were no any statistically significant
changes in elasticity and speed.

Introduction

Recently, there have been significant changes related to the physiological
and medical aspects of football. Studies on the ideal physical and physiological
properties of a successful football player show that due to the improvements
in the speed and skills of the football players, football has become more
dynamic (Mangine, et al., 1990).

The increase in productivity of sportsmen results directly from the quality
and quantity of the hard work achieved within training. From the beginning
level higher levels, tasks during training should be increased gradually
depending on the psychological and physical skills of each sportsman (Bompa,
1998). Players of higher level function and structural power may overcome
the challenging conditions of a professional football season with intensive
pre-season training. If gradual increases are applied consciously and
regularly within training sessions, higher levels of adjustments may continue
(Renklikurt, 1991).

A pre-season preparation period covers the period from the beginning
of team-training till the first official match. The length of these training
periods may differ from one country to another. During this training period,
physical conditioning should be composed mainly of games and exercises
with a ball. The number of training sessions from the beginning of football
season should be increased gradually (Bangsbo, 1994).

The most important thing that the technical committee should consider
before the season begins is the physical condition of football players
after the holiday season. Because of this, some teams include physical
and physiological tests in their programs to see how the players are doing
and to evaluate their preparation plans. These tests give information
on the properties of endurance, speed, muscular endurance, strength, coordination,
technical, and tactical elements during the preparation period.

Body composition is an important physical component for football. Excess
body fat makes the body move constantly against gravity and it is an unnecessary
load for footballers (Reilly, 1996). Although there have been several
studies that examined the seasonal changes in the body composition of
elite sportsmen’s (Siders, et al. 1994 & Morris and Payne, 1996);
there are not enough studies on the effects of a pre-season preparation
training period on the physical and physiological properties of high level
professional footballers’ performance, particularly in regards to
body composition. This study aims to determine and examine the physical
and physiological changes that occur during a six week pre-season preparation
training period to a football team of the Turkish Professional First Level
Division League.

Methodology

In this study, the professional football team is in Ankara. Pre-testing
was performed on the team after the holiday season and the follow up post-testing
was done after a pre-season preparation training period. The pre-season
preparation training period lasted six weeks with sixty training sessions
and six preparation games played. The properties of the footballers who
participated in this study are clearly tested pre and post the six-week
pre-season participation training period (Table 2).

Body fat percent (BFP) was calculated utilizing a skin fold method and
identified as percent mass (Adams, 1990). Systolic and diastolic blood
pressure was recorded as mmHg utilizing a stethoscope and sphygomanometer
in a stable sitted position. In order to determine the aerobic capacity,
a twenty meter shuttle run test was done on a grass field. The shuttle
run test was utilized to measure maximum oxygen consumption VO 2max and
defined in ml/kg/min (Tamer, 1995). Anaerobic strength measurements were
done utilizing the Bosco test protocol (Bosco Contact Mat; New Test 1000)
and the results indicated as watts. The vertical jump test was measured
utilizing jump meter equipment and the sit and reach equipment was utilized
to measure flexibility. The ten-meter and thirty-meter speed values were
calculated on the grass field starting 1m behind the starting point with
the help of sensory photocell. Research data was evaluated by t-test utilizing
a SPSS 10.0 statistical package program with significance level of (p
‹ 0.05).

Findings

Several physical and physiological properties of footballers’
were measured in a pre and post testing protocol and the measurements
were recorded and evaluated. (Table 2).

Values prior to the six-week pre-season preparation training period were
as followings: body weight 74.65 ± 5.90 kgs, body fat percent 6.43
± 1.67 %, vertical jump 58.70 ± 6. 94 cms, anaerobic power
27.59 ± 4.01 watts/ kg, ten meter speed 1.64 ± 0.41 seconds,
thirty meter speed 4.06 ± 0.91 seconds, flexibility 31.57 ±
5.78, VO2max 56.95 ± 4.07 ml/kg/min, systolic blood pressure 114.5
± 6.04 mmHg, and diastolic blood pressure 74.0 ± 6.40 mmHg.

Values after the six-week pre-season preparation training period were
as followings: body weight 73.85 ± 5.34 kgs, body fat percent 5.84
± 1.36 %, vertical jump 60.80 ± 7. 01 cms, anaerobic power
30.29 ± 7.76 watts/kg, ten meter speed 1.62 ± 0.32 seconds,
thirty meter speed 4.02 ± 0.13 seconds, elasticity 33.32 ±
4.32 cms, VO2max 59.48 ± 3.28 ml/ kg/ min, systolic blood pressure
71.0 ± 5.52 mmHg, and diastolic blood pressure 110.7 ± 6.93
mmHg.

These findings show that after the six-week pre-season preparation training
period there were some statistically significant differences between the
pre and post measurements in the values concerning body weight, body fat
percent, systolic and diastolic blood pressure, anaerobic power, aerobic
power, and vertical jump at a level of (p‹ 0.05). The values of
ten-meter speed, thirty-meter speed, and elasticity improved, but they
were not statistically significant at a level of (p‹ 0.05).

Discussion

In this study, the results of the tests done to determine the physical
and physiological properties of a football team in the Turkish Professional
First Division League pre and post a six-week pre-season preparation training
period were evaluated. The average age of the twenty players was 22.2
± 3.41; they had 12.4 ± 5.34 years of training; they had
a height of 178.9 ± 5.13cms. There was a significant increase in
body weight with a post-measurement of 73.85 ± 5.34 kgs.

In a previous study on a first division league team in England, having
a twenty-eight pre-season preparation training sessions lasting thirty-five
days, showed an increase in the body weight of the players, with a pre-training
period body weight measurement from 74.05 ± 9.2 kgs. to a post-training
period body weight measurement of 77.6 ± 8.7 (Mercer et al.,1992).
The body weight values of another study on a football team in Turkish
first division league also had six-week pre-season preparation training
period and their pre-training period body weight of 74.05 ± 6.60
went to a post-training period body weight of 73.68 ± 6.04 (Acikada
et al., 1996).

In the pre-training period the body fat percent measurement was 7.43
± 1.67 percent and in the post-training period body fat percent
measurement decreased to 6.84 ± 1.36. This decrease was also statistically
significant at a level of (p ‹ 0.05). In terms of past research
on body fat percent, only the beginning of race season and the changes
afterwards were ever studied (Burke, et al. 1986). Ostojic and Zivanic
(2001) found that body fat percent of Serbian professional football players
decreased significantly during the race season and increased out of season.
Burke et al., (1986) and Reilly (1996) pointed out that fat in the body
of football players may accumulate out of season and players may lose
more weight during pre-season training than other periods.

On the other hand, Ostojic and Zivanic (2001) stated that the effects
of training sessions and matches on body weight may have a decreasing
effect at different periods. Some footballers may lose more weight during
race season than in a pre-season preparation training period; they may
also reach the minimum level of body mass index at the end of the season.
Hoshikawa, et al. (2003) studied that body mass may increase and muscle
mass may decrease even without any training after the season ends for
a short period such as four weeks. On the other hand, with a well organized
pre-season program, body mass can be decreased and lost muscle mass can
be regained. In this present study, the decreases occurring in the body
mass index as well as in the body weight after the six-week pre-season
preparation training period are significant and are compatible with the
above mentioned literature except the study by Acikada, and et al. (1996).

The pre-training vertical jump measurement was 58.70 ± 6.54cms
and increased to 60.80 ± 7.01cms after the training period. This
increase was also statistically significant at a level of (p‹ 0.05).
This increase in the vertical jump was also observed after a preparation
training period of third league professional team players (Kocyigid, et
al., 1996). Mercer, et al. (1992), Gunay (1994) and Acikada, et al. (1996)
found similar results.

The pre-training period anaerobic power measurement was 27.59 ±
4.01 and increased to 30.29 ± 7.76 watts/kg after the pre-season
preparation training period. In this study, the increase in the anaerobic
power can be interpreted as the interaction of intensive continuity exercises
and type II muscle fiber (Bosco, et al., 1998). Kartal, Gunay, and Acikada,
et al. (1996) found similar results.

Aerobic capacity is one of the basic targets in developing a pre-season
preparation training program. In football, there is a complex order based
on an aerobic structure. The pre-training period measurement for aerobic
capacity (VO 2max value) was 56.95 ± 4.07 ml/ kg/ min and increased
to a VO 2max value of 59.48 ± 3.28 ml/kg/min. This can be interpreted
as the effect of the aerobic exercises and conditioning experienced in
the pre-season preparation training period. German national team players
have a high aerobic capacity of 62 ml/kg/min (Islegen, 1987). Pre-season
training programs have been evaluated and all past research findings have
shown positive effects on aerobic capacity.

When comparing flexibility measurements to other teams on all levels,
the Turkish league is quiet low. For example, in a study done on an English
first division league team utilizing the same testing procedures, the
post-flexibility measurements were quite better at 43.1 ± 4. 5
(Mercer, et al., 1992). The cause of this problem may be identified as
a lack of a sufficient stretching program at all levels.

The reason for the lowered blood pressure and lowered heart rate experienced
by the sportsmen is due to sport specific adaptation the occurs after
a long periods of regular training (Kandeydi, et al., 1984).

Speed is a motor characteristic that directly affects the success in
football. The pre-training ten-meter speed measurement was 1.64 ±
0.32 seconds and the pre-training thirty-meter speed measurement was 4.06
± 0.91 seconds. After the pre-season preparation training period
the speed values were 1.62 ± 0.32 seconds for the ten-meter speed
test and 4.02 ± 0.13 seconds for the thirty-meter speed test. This
increase in speed was not statistically significant. In similar studies,
Kartal and Gunay (1994) also showed increases in speed with no statistical
significance.

Acikada, et al (1996) interpreted the decrease of the ten-meter speed
value of 1.667 ± 0.156 seconds to 1.713 ± 0.046 seconds
after a period of training was due to the increase of overall gain in
power and strength. Enisler, et al. (1996) determined some values for
the ten-meter speed test and the thirty meter-speed test of footballers
according to their league level as followings: Level I League ten-meter
speed as 1.60 ± 0.07 seconds and thirty-meter speed as 4.07 ±
0.12 seconds; Level II League ten-meter speed as 1.62 ± 0.05 seconds
and thirty-meter speed as 4.10 ± 0.11 seconds; Level III League
ten-meter speed as 1.67 ± 0.04 seconds and thirty-meter speed as
4.13 ± 0.10 seconds; Amateur Level ten-meter speed as 1.66 ±
0.06 seconds and thirty-meter speed as 4.16 ± 0.12 seconds.

The differences between the levels are not statistically significant.
The decrease in speed times may be due to the decrease in body weight
and body mass index. As Ostojic and Zivaniz (2001) stated, the decrease
in the body mass index is related to the increase in the sprint time of
football players.

Some of the significant test results that occurred after the pre-season
preparation training period can be explained as being successful in achieving
the desired physical profile needed to compete in the challenging league
marathon. This kind of testing and training can help in the building of
tactics and techniques for training footballers.

References

  1. Acikada, C. O., Hazir, A. & Asci, T. (1996). The effect of pre-season preparation training on some strength and endurance characteristics of a football team. Journal of Football Science and Technology.1.3. (4). Ankara.
  2. Adams, G. M. (1990). Exercise Physiology Laboratory Manual. Dubuque: Wmc Brown Publishers.
  3. Bangsbo (1994). Football Physical Condition Coordination Training. (H. Gunduz, Trans.) Istanbul: TFG Publishers.
  4. Bompa, T.O. (1998). Theory and Methodology of Training. ( I, Keskin. & A.B.Tunur, Trans.) Ankara: Bagirgan Publishers.
  5. Bosco, C. , Tihanyi, J. & Latteri, F.et al. (1986). The Effect of Fatigue on Stirred and Re-use of Elastic Energy in Slow and Fast Types of Human Skeletal Muscles. Acta Physiol Scand.
  6. Burke, L. M., Gollan, R.A. & Read, R.S. (1986). Seasonal changes in body composition in Australian rules footballers. British Journal of Sports Medicine, 20.
  7. Hoshikawa, Y. , Kano, A. , Ikoma, T., Muramutso, M. , Iida, T. , Uchiyama, A. & Nakajima, Y. (2003). Off Season and Preseason Changes in Total and Regional Body Composition in Japanese Professional Soccer League Players. Book Abstract, Science and Football 5th World Congress, 11-15 April 2003,
  8. Portugal.
  9. Islegen, C. (1987). Physical and physiological profiles of professional football teams of different leagues. Journal of Sports Physicians, 22. Izmir.
  10. Kandeydi, H. & Ergen, E. (1984). A comparison of physical and functional characteristics of students from departments of physical training and sports vs. medicine . Journal of Sports Physicians, 19 (1). Izmir.
  11. Kartal, R. & Gunay, M. (1994).The effect of preseason preparation trainings on some physical parameters of footballers. Journal of Sports Sciences , 5(3). Ankara.
  12. Kocyigit, F. , Auluk, I. , Sevimli, D. & Sev, N. (1996).The Effect of Preparation Season Training on Some Motor Characteristics and Body Composition Concerning the Age of the Footballers. IV. Sports Sciences Congress 1-3 November, Ankara.
  13. Mangine, R.E. , Noyes, F.R. , Mullen, M.P. & Barber, S.D. (1990). A physiological profile of the elite soccer athlete. Journal of Orthopedic and Sports Physical Therapy, 12.
  14. Mercer, T.H. & Payne, W.R. (1992). Fitness Profiles of Professional Soccer Players Before and After Preseason Conditioning. Division of Sports, Health and Exercise, UK.
  15. Morris, F.L. & Payne, W.R. (1996). Seasonal variations in the body composition of lightweight rowers. British Journal of Sports Medicine, 30.
  16. Ostojic, S. M. & Zivanic, S. (2001). Effects of training on anthropometric and physiological characteristics of elite Serbian soccer players. Acta Biologie et Medicinae Experimentalis. 27(48).
  17. Reilly, T. (1996). Fitness assessment. In Reilly, T. (Ed.) Science and Soccer. London: E& FN Spon.
  18. Renklikurt, T. (1991).Transition and preparation period basics and its application in Turkey. Journal of Trainers’ Voice, Tufad (1). Ankara.
  19. Siders, W.A., Bolonchuk, W.W. & Lukaski, H.C. (1991). Effects of participation in a collegiate sport season on body composition. Journal of Sports Medicine and Physical Fitness, 31.
  20. Tamer K. (1995). Sports Measurement and Evaluation of Physical and Physiological Performance. Ankara: TurkerlerBookstore.


Appendices

Table 1. Characteristics of footballers:

Variables N X ± SD
Age (year) 20 22.2 ± 3.41
Age of exercise (year) 20 12.4 ± 4.2
Height (cm) 20 178.9 ± 5.13


Table 2. Values of footballers’ physical and physiological condition
pre and post six-week pre-season preparation training periods:

Variables N Pre Post t p
Body weight 20 74.65 ± 5.93 73.85 ± 5.34 2.19 *
Body fat percent (%) 20 7.43 ± 1.67 6.84 ± 1.36 2.61 *
Vertical jump (cm) 20 58.70 ± 6.94 60.80 ± 7.01 2.60 *
Anaerobic power (W/kg) 20 27.59 ± 4.01 30.29 ± 7.76 2.12 *
10-meter (sc) 20 1.64 ± 0.41 1.62 ± 0.32 1.45
30-meter (sc) 20 4.06 ± 0.91 4.02 ± 0.13 1.65
Flexibility (cm) 20 31.57 ± 5.78 33.32 ± 4.32 1.37
VO2 max (ml/kg/min) 20 56.95 ± 4.07 59.48 ± 3.28 3.10 *
Diastolic blood pressure (mmHg) 20 74.0 ± 5.52 71.0 ± 5.52 2.85 *
Systolic blood pressure (mmHg) 20 114.5 ± 6.04 110.7 ± 6.93 2.88 *
2015-03-27T13:47:30-05:00September 5th, 2006|Sports Coaching, Sports Exercise Science, Sports Management, Sports Studies and Sports Psychology|Comments Off on The Physical and Physiological Properties of Football Players from a Turkish Professional First-Division Football League

Performance Enhancement Drugs: Knowledge, Attitude, And Intended Behavior Among Community Coaches In Hong Kong

Abstract

The purpose of the study was to elucidate the perceived knowledge, actual knowledge, attitude, and intended behavior of community coaches with respect to performance enhancement drugs (PED). The Theory of Planned Behavior was used as a guiding framework to structure the questionnaire used for data collection. Results of the analyses suggested that community coaches under-estimated their own knowledge about PED. Most respondents are supportive to the anti-doping movement in terms of both attitude and behavior intent. Results of the present study also partially agreed with the Theory of Planned Behavior, perceived knowledge, actual knowledge, and attitude towards PED were found to be significantly related to behavioral intent. Implications of the results were discussed.

Introduction

The Athlete should not be the only person to be blamed in case of a positive drug test. Numerous studies have pointed out that an athlete’s use of drugs in sport could be attributed to a complex interaction of personal and environmental factors (Nicholson and Agnew, 1989; Tricker, Cook, and McGuire, 1989). Possible contributing environmental factors include attitudes of peer group and parents, accessibility to drugs, and cultural norms and values (Polich, Ellichson, Reuter, and Kahan, 1984; Tricker and Connolly, 1997).

In the coaching literature, coaches are viewed as having a strong influence in regulating athletes’ behavior and attitude (Anshel, 1990; Orlick, 1990). For example, Dieffenbach, Gould, and Moffett (2002) suggested that coaches play crucial roles in influencing quality of coach-athlete relationship, developing achievement goals for the athletes, mentoring athletes’ development and indirectly model the positive skills and characteristics athletes need for success. Therefore, it is argued that coaches could be one of the more important agents in preventing drug use among athletes and should be included in any doping prevention campaigns (Dubin, 1990).

For coaches to function optimally as role models and in assisting young athletes to formulate correct attitudes against doping, they must also possess accurate knowledge and appropriate attitude on doping and drug use. Although coaches can gain information about drug use and drug abuse through various channels, seminars and information packages are the media more favored by Hong Kong community coaches. In Hong Kong, the Sports Federation and Olympic Committee, Hong Kong, China and the Hong Kong Coaching Committee are the major stakeholders to provide such information to community coaches. In order for these agencies to develop appropriately sequenced knowledge, some understanding of the current status of coaches’ knowledge and attitude on drug use and drug abuse is necessary. Therefore, one of the purposes of the present study was to assess the perceived knowledge, actual knowledge, attitude, subjective norms, and behavioral intent related to performance enhancement drug (PED) among Hong Kong community coaches.

In developing this study and in constructing the questionnaire for data collection, the Theory of Planned Behavior (Ajzen and Fishbein, 1988) was used as a guiding framework. According to this theory, a person’s behavior is mainly determined by his/her behavioral intent which, in turn, is influenced by attitude towards the behavior, subjective norms, and perceived behavioral control. As the theory has been successfully used to predict recreational drug use (McMillan and Conner 2003; Orbell, Blair, Sherlock, and Conner, 2001), intentions to use PEDs among collegiate athletes (Allemeier, 1996) and in adolescents (Lucidi, Grano, Leone, Lombardo, and Pesce, 2004), we were confident that it could provide a meaningful structure for the study.

Methods

Participants

A total of 114 community coaches attending a coach education class during the data collection period were invited to take part voluntarily in the study. The sample is comprised of 93 male and 21 female (Age: 29.3 ± 8.1; mean ± SD). Among the participants, 28% are university graduates, 11% were university students, the remaining 61% are secondary school graduates.

Instrument

The questionnaire used for data collection was developed by the authors from literature review and consultation with experts working in the area of doping and drug use. The questionnaire is comprised of 61 items. Apart from the demographic section, all other items were designed to elucidate perceived knowledge on PED, actual knowledge about PED, attitude, subjective norms, and behavior intent on drug use in sports. A combination of response types was employed, including likert-type scale and binominal scale. As the possible total scores from items related to perceived knowledge on PED and from items related to actual knowledge about PED differs, the raw score from each category was transformed to allow for parallel comparison. In transforming the scores, the maximum of 100 points was used as the reference.

Results

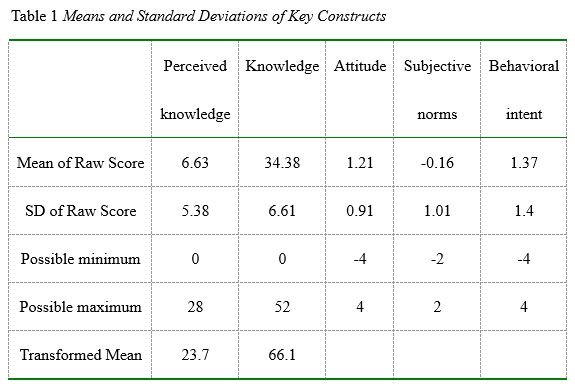
A summary of means and standard deviations of key constructs examined in this study is presented in Table 1. The score mean for perceived knowledge on PED was 23.7 whereas the score mean for actual knowledge on PED reached 66.1.

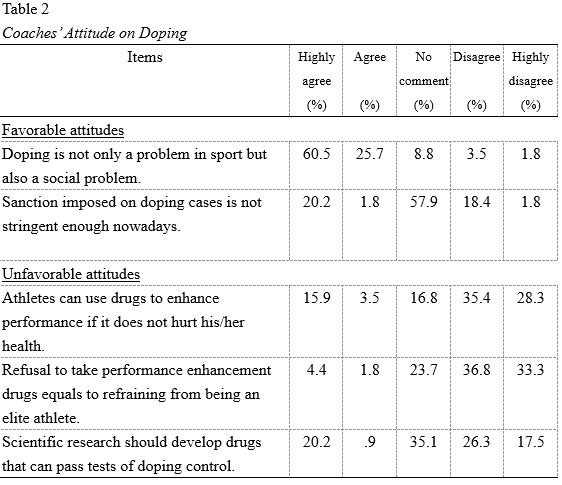
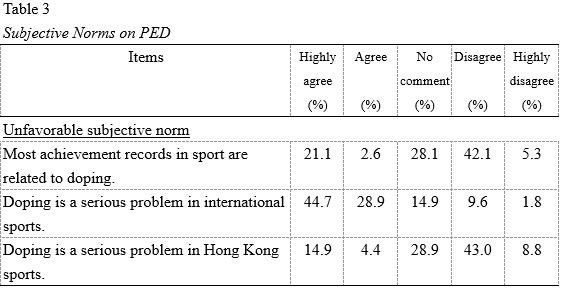
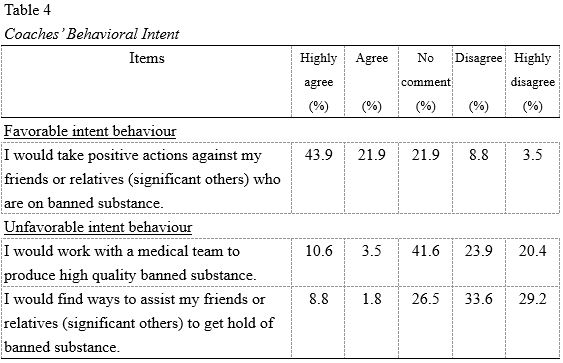
Scores on attitude, subjective norm, and intent behaviour were computed in a way that positive scores represent preferred attitude, norm and intentional behavior that support the anti-doping movement. Negative scores, on the other hands, represent the support of the use of doping to take advantage over other athletes. The scores in attitude, subjective norm, and behavioral intent are 1.21 ± 0.91, –0.16 ± 1.01, and 1.37 ± 1.4 respectively. Both attitude and behavioral intent of the Hong Kong community coaches are supportive of the anti-doping movement. However, the score on subjective norm was negative and this suggests that they perceive doping as a problem in the sporting community. Table 2, 3 and 4 show the response pattern of participants to questions on attitude, subjective norm, and behavioral intent, respectively.

In terms of attitude, majority of the respondents agreed (86.2% agreed or highly agreed) that doping is not only a problem in sport but also a social problem. Most respondents did not have strong feeling on whether sanction imposed on doping cases is stringent or not (57.9% have no comment on the issue). The majority disagreed (63.7% disagreed or highly disagreed) that athletes can use drugs to enhance performance if it does not hurt his/her health. Most respondents did not believe (70.1% respondents disagreed or highly disagreed) that refusal to take PEDs equals to refraining from being an elite athlete. Respondents are slightly biased to disagree (43.8% disagreed or highly disagreed and 35.1% had no comment) that scientific research should develop drugs that can pass tests of doping control.

Questions in elucidating subjective norm of the respondents found out that most respondent disagreed (47.4% disagreed or highly disagreed) that most achievement records in sport are related to doping. The majority respondents agreed (73.6% agreed or highly agreed) that doping is a serious problem in international sports. On the other hands, most respondents disagreed (51.8% disagreed or highly disagreed) that doping is a serious problem in Hong Kong sports.

The behaviour intent of the respondents is in general supportive to the anti-doping movement. Most respondents (65.8%) claimed that they would take positive actions against his/her friends or relatives who are on banned substance. The respondents slightly biased towards not working with medical team to produce high quality banned substance (44.3% disagreed or highly disagreed and 41.6 had no comment). The majority of the respondents (62.8%) claimed that they would not find ways to assist his/her friends or relatives to get hold of banned substance.

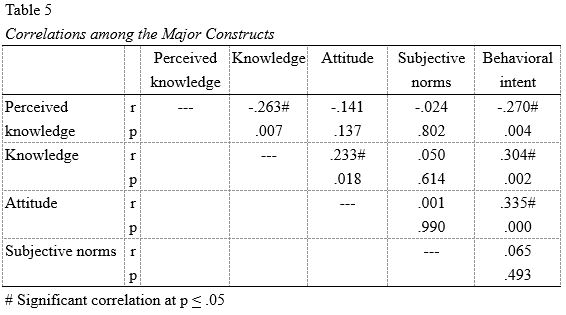
Table 5 shows the Pearson correlation coefficients among the key constructs of the study. Behavioral intent is significantly correlated to perceived knowledge (r = -.270, p = .004), actual knowledge (r = .304, p = .002), and attitude (r =.335, p = .000) but not to subjective norm (r = .065, p = .493).

Two other significant correlations were identified, namely the correlation between actual knowledge and perceived knowledge (r = -.263, p = .007), and between attitude and actual knowledge (r = .233, p = .018).

Discussion

According to the Theory of Planned Behavior (Ajzen and Fishbein, 1988), a person’s behavior is mainly determined by his/her behavioral intent which, in turn, is influenced by attitude towards the behavior, subjective norms, and perceived behavioral control. Result of the present study finds partial agreement with the Theory, namely the level of intentions to perform a particular behaviour depends on the individual’s attitude on the behaviour. However, the relationship between subjective norm and behavioral intent was not significant in our study. One of the possible reasons for this discrepancy is that the participants are community coaches who may not perceive themselves as having any significant influence or involvement with the doping problem more commonly found in elite level athletes. The three items used to elucidate information on the subjective norms were biased towards drug use among elite level athletes. Therefore, even though the respondents might have agreed to the presence of doping problem at

the elite level, the items were not sufficiently sensitive to capture their opinions on drug use issues on their day-to-day settings. Further investigation on this issue with refined items would be needed.

The present study also aims at elucidating the Hong Kong community coaches’ current status of knowledge and attitude on PEDs. This group of coaches was found to be relatively supportive to the anti-doping movement according to their attitude (1.21 ± 0.91) and behaviour intent (1.37 ± 1.4) scores. A survey on Norwegian coaches found that coaches have strong and unequivocal attitudes against doping (Figved, 1992). Laure, Thouvenin, and Lecerf (2001) also found that 98.1% of the France coaches consider that they have a role to play to flight against doping. The present respondents’ actual knowledge on PEDs, reached the mean value of 66.1, was fair and yet had rooms for further improvement. This baseline measurement could also be used for monitoring the effectiveness of any intervention programs in the future.

It is interesting to notice that there is a huge discrepancy between the respondents’ perceived knowledge (mean = 23.7) and actual knowledge (mean = 66.1). Participants tend to under-estimate their knowledge in PED and doping control. This conclusion is further supported by the negative correlation between the perceived knowledge and actual knowledge (r = -.263, p = .007). The more knowledgeable they are, the greater their under-estimation. It is possible that the more they know about PED and the doping control system, the more they understand that the problem of drug in sport is more complicated than presented. This implies that any education program designed for the coaches on PEDs could be more effective if it is mandatory. As the individuals with the least knowledge is likely to perceived that they have enough knowledge about the issue.

It is also interesting to note that the low perceived knowledge on doping among coaches was also found in a survey on France coaches. 80.3% of the France coaches consider themselves badly trained in the prevention of doping (Laure, et al., 2001).

Unlike the Hong Kong community coaches, the Norwegian coaches believed that they are well informed about doping (Figved, 1992). This can be due to the fact that the education about PEDs for coaches was more structured and successful in Norway than that in Hong Kong. Furthermore, the difference on cultural background may have lead to the under-estimation of the Hong Kong coaches’ knowledge on PEDs as discussed in the previous paragraph.

Currently, seminars on PEDs are few and infrequent in Hong Kong. A systematic curriculum on doping is also lacking. According to Figved’s study (1992), most coaches believed that seminars, courses, and evening sessions were the best ways of changing attitudes and increasing knowledge. Given the important role of coaches in influencing the direction of fair play in sports and the findings from this study, we suggest the need to develop a systematic and spirally progressive education program on drug use and drug abuse. Furthermore, incentives such as certifications and fee waivers could be developed to encourage coaches to such courses so as to work towards knowledge and attitude development in the area of PED.

References

  1. Allemeier, M.F. (1996). CIAU athletes’ use and intentions to use performance enhancing drugs: a study utilizing the theory of planned behaviour. Thesis (M.A.) University of British Columbia, Eugene, Ore: Microform Publications Int’l Inst for Sport & Human Performance, University of Oregon.
  2. Anshel, M.H. (1990). Sport psychology: From theory to practice. Gorsuch Scarisbrisk: Scottsdale, AZ.
  3. Ajzen, I. & Fishbein, M. (1988). Understanding attitudes and predicting social behaviour. Englewood Cliffs, NJ: Prentice Hall.
  4. Dieffenbach, K., Gould, D., & Moffett, A. (2002). The coach’s role in developing champions. International Journal of Volleyball Research, 5(1), 30-32.
  5. Dubin, C. (1990). Commission of inquiry into the use of drugs and banned practices intended to increase athletic performance. Ottawa, ON: Canadian Government Publishing Centre, 615.
  6. Figved, S.E. (1992). Drug education programs for coaches and leaders. Science Periodical on Research and Technology in Sport, 12(4), 5-9.
  7. Laure, P., Thouvenin, F., and Lecerf, T. (2001). Attitudes of coaches towards doping. J Sports Med Phy Fit, 41, 132-136.
  8. Lucidi, F., Grano, C., Leone, L., Lombardo, C., & Pesce, C. (2004). Determinants of the intention to use doping substances: An empirical contributions in a sample of Italian adolescents. International Journal of Sport Psychology, 35, 133-148.
  9. McMillan, B. & Conner, M. (2003). Applying an extended version of the theory of planned behavior to illicit drug use among students. Journal of Applied Social Psychology, 33, 1662-1683.
  10. Nicholson, N. & Agnew, M. (1989). Education strategies to reduce drug use in sport. Sports Coach, 13(1), 38-41.
  11. Orbell, S., Blair, C., Sherlock, K., & Conner, M. (2001). The theory of planned behavior and ecstasy use: Roles for habit and perceived control over taking versus obtaining substances. Journal of Applied Social Psychology, 31, 31-47.
  12. Orlick, T. (1990). In pursuit of excellence (2nd ed.). Champaign, IL: Human Kinetics.
  13. Parish, C.A. (1973). An epidemiological survey of drug use among secondary school students in grades eight and eleven in eastern South Dakota. Doctoral dissertation, University of South Dakota.
  14. Polich, J.M., Ellichson, P.L., Reuter, P., & Kahan, J.P. (1984). Strategies for controlling adolescent drug use. The Rand Publication Series, Ca.
  15. Tricker, R. & Connolly, D. (1997). Drugs and the college athlete: An analysis of the attitudes of student athletes at risk. Journal on Drug Education, 26, 275-287.
  16. Tricker, R., Cook, D., & McGuire, R. (1989). Issues related to drug abuse in college athletics: Athletes at risk. Sport Psychologist, 2(1), 155-165.

Acknowledgement

This study was supported by the Faculty Research Grant of the Hong Kong Baptist University.

Table 1

Table 2

Table 3

Table 4

Table 5

2015-03-27T13:13:57-05:00June 7th, 2006|Contemporary Sports Issues, Sports Coaching, Sports Exercise Science, Sports Management, Sports Studies and Sports Psychology|Comments Off on Performance Enhancement Drugs: Knowledge, Attitude, And Intended Behavior Among Community Coaches In Hong Kong

Gender, Skill, and Performance in Amateur Golf: An Examination of NCAA Division I Golfers

Abstract

In a previous study, it was found that male amateur golfers must possess a variety of shot-making skills to be successful and that relative to driving ability, putting skills and reaching greens in regulation contribute more to explaining tournament success. This present research extends these findings by expanding the investigation to analyze the performance determinants of both female and male amateur golfers. In so doing, we are able to test for the presence of gender-based differences in skill levels and in the relationship between skills and tournament performance. Using a sample of NCAA Division I male and female golfers who participated in tournament play during 2004-2005, our research offers two interesting observations. First, on average, male and female amateur golfers possess different levels of shot-making skills. Second, these disparate skills influence tournament performance differently across genders. Although the causality of these gender-based disparities cannot be identified with certainty, several plausible explanations are considered.

Introduction

In an earlier research study of amateur golfers, we empirically examine the relationship between a male golfer’s tournament performance and a set of shot-making skills (Callan and Thomas, 2004). This initial investigation was the first of its kind to focus on a sample of NCAA Division I male golfers. Statistically, those findings validate analogous research on the performance of professional golfers. What we discovered is that male amateur golfers, like their professional counterparts, must possess a wide variety of shot-making skills to be successful. Moreover, we found that, relative to driving ability, putting skills and reaching greens in regulation contribute more to explaining the variability in a player’s success. This present study extends that research to study both men and women amateur golfers and, in so doing, allows us to test for the presence of gender-based differences in skill levels or in any skill-to-performance relationship.

That gender-specific skill differences exist in the game of golf is explicitly recognized by the United States Golf Association (USGA), which is the governing body for the rules of golf. For example, in its rating system of golf courses, the USGA specifically defines a bogey golfer and a scratch golfer according to the golfer’s gender, as noted below (United States Golf Association, 2005).

Bogey Golfer:

“A male bogey golfer is a player who has a Course Handicap© of approximately 20 on a course of standard difficulty. He can hit tee shots an average of 200 yards and can reach a 370-yard hole in two shots at sea level.

A female bogey golfer is a player who has a Course Handicap© of approximately 24 on a course of standard difficulty. She can hit tee shots an average of 150 yards and can reach a 280-yard hole in two shots at sea level.”

Scratch Golfer:
“A male scratch golfer is a player who can play to a Course Handicap© of zero on any and all rated golf courses. A male scratch golfer, for rating purposes, can hit tee shots an average of 250 yards and can reach a 470-yard hole in two shots at sea level.

A female scratch golfer is a player who can play to a Course Handicap© of zero on any and all rated golf courses. A female scratch golfer, for rating purposes, can hit tee shots an average of 210 yards and can reach a 400-yard hole in two shots at sea level.”

Following these and other gender-specific distinctions made by the USGA, it is reasonable to expect that on average, male golfers are able to drive the ball longer distances off the tee, and female golfers have shorter approach shots to each green. Similar assertions, some with supporting data, are found in the literature, for example, Shmanske (2000) and Wiseman, Chatterjee, Wiseman, and Chatterjee (1994). Such observations motivate the need to learn how such gender-based skill differences translate into scoring performances under actual tournament conditions.

While no existing research papers examine this skill-to-performance relationship across male and female amateur golfers, there are studies that investigate the existence and degree of gender differences among professional golfers. Generally in such investigations, two questions are examined:

  1. Do the data support the hypothesis that there are statistically different shot-making skills across male and female golfers?
  2. How do shot-making skills influence a golfer’s tournament performance, and is this set of relationships gender specific?

To illustrate, we offer a few salient examples of this research and an overview of the approach used in each case.

Using performance measures for the 1992 season, Wiseman, Chatterjee, Wiseman, and Chatterjee (1994) investigate the influence of gender differences across golfers in the Professional Golfers’ Association (PGA), Senior PGA (SPGA), and Ladies PGA (LPGA). Overall performance is measured in their study by the average score per round of golf, and the shot-making skills considered are driving distance, driving accuracy, hitting greens in regulation, and putting. What these researchers find is that, on average, male PGA golfers drive the ball farther and hit a larger percentage of greens in regulation than female professionals. Driving accuracy was approximately the same across genders. Because the PGA and LPGA do not collect putting data in the same manner, no gender comparisons could be made about putting ability. However, using multiple regression analysis, Wiseman, et al. (1994) discover that the two most influential skills for female golfers are putting and hitting greens in regulations. These two skills explained 88 percent of the variability in an LPGA member’s average score per round. However, male PGA golfers need a more well-rounded game, as indicated by the importance of all shot-making skills in determining their tournament performance.

In a more recent study, Moy and Liaw (1998) examine golfers’ shot-making skills and tournament performance during the 1993 tournament season for the same professional tours used by Wiseman, et al. (1994). For the most part, Moy and Liaw’s findings agree with those of Wiseman, et al. (1994) regarding PGA golfers’ skills at driving the ball and reaching greens in regulation relative to LPGA golfers. However, they add a variable that captures sand saves, measured as the percentage of time a player gets out of a greenside bunker and scores par or better on the hole. They find that, on average, PGA golfers achieve a higher proportion of sand saves relative to their female counterparts in the LPGA. Given that no comparable putting statistic was available across the two tours, Moy and Liaw were unable to test for gender differences with respect to putting skills.

Shmanske (2000) statistically compares the skill-to-performance relationship for a sample of PGA golfers and LPGA golfers for the 1998 tournament season. In addition to the conventional shot-making skills, Shmanske constructed a comparable putting skill measure for each set of tour professionals. Overall, his results on gender differences are consistent with those of previous researchers. Specifically, he finds that male professional golfers drive the ball farther off the tee, have a higher sand save percentage, and demonstrate a higher putting proficiency. For the other key shot-making skills, namely driving accuracy and hitting greens in regulation, Shmanske observes no meaningful difference across genders.

While these studies have contributed to our understanding of gender differences in professional golf, no analogous investigations have been done for amateur golf. Recognizing the importance of this issue, we extend our previous study of amateur golfers (Callan and Thomas, 2004) to an analysis of skills and performance across male and female amateurs. Using the fundamental framework suggested by Wiseman, et al. (1994) and others, we use a two-pronged approach to our investigation. First, we statistically test for gender-specific skill differences at the amateur level. Second, we use regression analysis to assess the influence of a player’s shot-making skills on tournament performance and statistically determine if these skill-to-performance relationships are affected by gender.

Method

Sample

To conduct our investigation, we use a subset of NCAA Division I male and female golfers who participated in at least one tournament during the 2004–2005 season. Data on members of all Division I teams are not available. The colleges and universities represented in this study are identified in Table 1 along with the number of players on each team, the number of tournaments played during the season, and the average length in yards of the typical course on which the teams played. Most of these data are obtained from Golfstat, Inc. (2005), which is accessible on the Internet at www.golfstat.com.

Notice that the data presented in Table 1 suggest some important distinctions across genders. At a fundamental level, we observe that male golf teams, on average, comprise between 8 and 9 players, while female teams are smaller, averaging between 7 and 8 players. We also note that males play in slightly more tournaments than females, averaging 10.8 for males and 9.7 for females. Consistent with the USGA’s rating system, we also observe that the average male golfer plays courses that are almost 1,000 yards longer than those played by females, specifically 7,042 yards for men versus 6,104 for women. As a consequence, one might infer that male golfers place a higher premium on driving distance, while female golfers might focus more on developing their short game skills.

Measures

For each of the universities included in this research, Golfstat, Inc. collects and reports statistics for player skills and tournament performance. In this study, we use data for the 2004–2005 NCAA Division I tournament season for men and women teams from the same group of institutions. Just as we argue in our 2004 study, AVERAGE SCORE per round is a viable measure of tournament performance, since earnings are not relevant at the amateur level. Moreover, Wiseman et al. (1994) assert that correlation results are actually stronger when scoring average, as opposed to earnings, is used. As for the shot-making skills, we use a set of variables that collectively capture each player’s golf game from tee to green. Among these are measures of driving ability, fairways hit, greens in regulation, sand saves, and putting, which follows the approach used in Callan and Thomas (2004). We briefly discuss each measure in turn, starting with those capturing a player’s long game.

To capture each amateur’s ability to drive the golf ball, we use the variable EAGLES, defined as the cumulative number of recorded eagles (i.e., two strokes under par on any hole) a player makes each season. This variable serves as a proxy for driving distance, which is a statistic not reported by Golfstat. In support of this proxy measure, Dorsel and Rotunda (2001) report a positive correlation between a player’s driving distance and the number of eagles made. Related to driving distance is accuracy in driving the ball into the fairway. To measure this skill, we use the variable FAIRWAYS HIT, measured as the percentage of time a player drives the golf ball off the tee and into the fairway. We also define a variable called GREENS IN REGULATION (GIR) as the percentage of time a player reaches a green in the requisite number of strokes, specifically one for a par three, two for a par four, and three for a par five. This follows the work of Belkin, Gansneder, Pickens, Rotella, and Striegel (1994), who assert that GIR captures a player’s iron skill and success in reaching a green within the regulation number of strokes.

As for a player’s short game, we employ two skill variables that are commonly used in the literature. The first is SAND SAVES, which measures the percentage of time a player gets out of a greenside bunker and achieves a score of par or better. The second is a player’s ability to putt the ball into the hole once on the green. To capture this shot-making skill, we use the variable PUTTS PER ROUND, which measures the average number of putts a golfer makes per round of golf. This follows Belkin, et al. (1994).

Beyond the effect of shot-making skills, we hypothesize that a golfer’s overall performance is influenced by two other key factors – a player’s experience level and any associated team effects. Recognizing experience as a determinant of a golfer’s performance follows Shmanske (1992) and others. In the professional literature, experience is typically captured by the number of years a player has been a professional player. For this analysis of amateur golfers, we construct two experience variables. One is the variable ROUNDS, which is simply the number of tournament rounds completed by each player during the 2004–2005 season. This variable effectively measures a player’s short-term experience, because it captures the way each additional round played in a season adds to the knowledge a player can call upon in subsequent rounds. The second experience measure controls for longer-term cumulative experience and is modeled through a set of dummy variables that reflect the player’s academic age, specifically FRESHMAN, SOPHOMORE, JUNIOR, or SENIOR. The underlying expectation is that the more advanced is a player’s academic age, the more collegiate golfing experience has been gained and, therefore, the lower the expected average score.

The other theorized non-skill determinant of amateur performance is characterized as team effects. These are expected to arise from various factors, including the expertise and experience of the coach and the relative challenge of the courses played by the team. Coaches can directly affect the success of each player in myriad ways, such as through mentoring, leadership, instruction, and guidance. As a leader, the coach is responsible for setting team strategy and for determining the extent of each player’s tournament participation. As an instructor, the coach guides and motivates the development of each player’s athleticism and skills. Hence, collegiate golfers can achieve varying levels of success in the sport based in part on the expertise and experience of their coach, holding skill levels constant.

Likewise, a player’s amateur performance might be affected by the courses played by their team, because course venues, and hence their relative difficulty, vary across collegiate teams. Therefore, a member of a team that plays on relatively easy courses in a tournament season might enjoy a lower average score for that season, and, of course, the converse is true. To account for such team effects, we construct university-specific dummy variables for each player, whereby each identifies the team to which a player belongs.

Procedures

For this study, two conventional statistical procedures were used to analyze the skill and non-skill determinants of amateur golf performance, controlling for gender. One is the two-sample t-test, which was used to statistically examine the difference between mean values of male and female shot-making skills. The second procedure is the use of a multiple regression model that estimates the influence of skill, experience, and team effects on a player’s tournament score, holding constant all other score determinants. Ordinary least squares (OLS) is used to derive the regression estimates.

Results and Discussion

In Table 2, we present descriptive statistics for the sample of 179 amateur golfers, comprising 94 males and 85 females. At the collegiate level, tournaments generally consist of 3 rounds of golf, and each round comprises 18 holes of play. In our sample, the average NCAA Division I male golfer had an average score per round of approximately 75 strokes during the 2004–2005 season. In comparison, the average female golfer had a higher average score per round of about 79 for the season.

Based on the two experience variables, the average male amateur has more experience than the average female. For short-term experience, we observe that males play slightly more than 24 rounds of golf in the season, while females play fewer rounds, at about 22. As for longer-term experience based on academic age, approximately 61 percent of male team members are juniors and seniors, while the comparable value for females is lower at 47 percent.

Turning our attention to shot-making skills, we observe the following distinctions across genders. The average male golfer hits approximately 64 percent of fairways and reaches greens in the regulation number of strokes 60 percent of the time. Female golfers, on the other hand, hit 70 percent of fairways and reach greens in regulation 50 percent of the time. Over the course of a round, a male golfer makes slightly less than 31 putts, while the female golfer makes slightly more than 32 putts. For sand saves, the data show that the amateur male golfer makes par or better when hitting from a bunker 39 percent of the time, which is notably higher than the amateur female golfer, who has a comparable success rate of 29 percent. Lastly, over the course of the 2004–2005 season, the average male player makes 1.8 eagles, while the average female had 0.34 eagles, suggesting superior driving distance for males.

For each variable in the table, we also find the coefficient of variation for each gender group. As a measure of dispersion, this statistic contributes useful information about performance and skills across genders. Notice that for AVERAGE SCORE, the coefficient of variation is smaller for males than females. The same is true for all shot-making skill variables with the single exception of PUTTS PER ROUND. What these results imply is that there is a greater degree of competition among amateur male golfers than among females, an interpretation that follows Moy and Liaw (1998).

By simple observation, these data suggest that there may be statistically significant differences in skill levels across genders. To formally examine this theory, we use two-sample t-tests across the gender-specific skill variables and present our findings in Table 3. Not surprisingly, there are indeed statistically significant differences across genders (i.e., p < 0.0001) for all shot-making skills. Specifically, NCAA Division I male golfers, on average, possess superior shot-making skills relative to their female counterparts for EAGLES, GIR, PUTTS PER ROUND, and SAND SAVES. These findings generally agree with those found in research studies of professional golfers (Wiseman, et al., 1994; Moy and Liaw, 1998; Shmanske, 2000). The opposite relationship holds for FAIRWAYS HIT, the measure of driving accuracy, for which female collegiate golfers are statistically superior to males, on average.

While certainly of interest, the observation of gender-specific skill differences does not ensure that they translate into comparable changes in tournament performances. Investigation of this important issue requires the use of a multiple regression model. To that end, we specify a model to estimate the relationship between an amateur golfer’s average score and each of the determinants identified previously, specifically the set of five shot-making skills, the two experience measures, and the team dummy variables. To identify whether these determinants affect average score differently across males and females, we explicitly control for gender through the use of an interactive binary variable, FEMALE. This variable equals 1 if the golfer is female and 0 if male. It enters the model by itself as well as multiplicatively with each of the other explanatory variables. That way, each score determinant enters the model directly to represent males and multiplicatively with FEMALE to represent any incremental differences for females. In so doing, the estimation results quantify not only how shot-making skills, experience, and team effects influence average score but also whether those effects vary across genders.

The results of this multiple regression analysis are given in Table 4. Based on the adjusted R2 statistic, the regression model explains approximately 95 percent of the variability in a golfer’s tournament performance. Of particular interest are the gender-specific estimates that communicate the relative importance of each shot-making skill on overall performance, holding constant all other skills, team effects, and player experience. We also can assess the influence of all non-skill factors on a player’s average score independent of skill levels, and again, we can do so by gender. The estimated values for male golfers are listed in the first two columns of the table, and the estimates of any incremental differences for females are given in the second pair of columns.

To determine if the gender-based distinctions are collectively relevant, we conducted several F-tests, the results of which are shown at the bottom of Table 4. Other than the test for academic age variables for which gender differences are only marginally significant, all other F-tests indicate that gender differences exist and are statistically significant. These include tests for the overall model, for shot-making skills, and for team effects. These are important findings, which, to the best of our knowledge, have not yet been identified in the literature. They communicate far more than differences in skill levels across males and females. Rather, these results suggest that improvements in skill levels do not translate equivalently to better performance outcomes for both gender groups.

Next consider the individual results for each of the explanatory variables, starting with the set of shot-making skills. With the exception of FAIRWAYS HIT, each shot-making skill has a statistically significant influence on a player’s tournament performance, and each bears the expected algebraic sign. We also find that for several of these shot-making skills, gender differences exist and are statistically significant. Specifically, male golfers gain more tournament success than females from improving SAND SAVES. Conversely, increasing the GIR proportion statistically improves a female golfer’s tournament performance more than it does for a male. An analogous argument is relevant to reducing PUTTS PER ROUND. There are no apparent gender-based differences for EAGLES. Perhaps this outcome is due to the USGA establishing different tee boxes for males and females, which may correctly adjust for any inherent gender-based differences in driving ability.

As for the experience measures, the results suggest that short-term experience measured through ROUNDS does improve tournament performance and does so with no difference between the genders. For cumulative experience, captured through the academic age variables, FRESHMAN, SOPHOMORE, JUNIOR, and SENIOR, only the results for females are reasonable. Specifically, we find that female sophomores achieve higher average scores relative to seniors (the suppressed academic age variable). This makes sense, suggesting that greater collegiate experience improves performance. For males, the parameter on SOPHOMORE is significant, but its algebraic sign is negative. This outcome may be an artifact of the data sample, such as an unusually talented group of male sophomores in the 2004–2005 tournament season. It might also be related to the fact that in this sample, there are about 50 percent more male seniors than male sophomores, while for females there are 12.5 percent fewer seniors than sophomores.

We further find that team effects exist for certain universities. Golfers from East Tennessee State, on average, have higher average scores for the season than those from Vanderbilt University (the suppressed variable), regardless of gender. The same is true for players at the University of Texas. This implies that Vanderbilt University may have a better coaching staff and/or the Vanderbilt teams may play on less challenging courses. Interestingly, the team effect results also suggest a gender difference for teams at Indiana University and Kent State. In both cases, female teams perform at a lower level (i.e., have higher average scores), than their male counterparts, holding constant all other score determinants, including shot-making skills.

To quantify the effect of these differences, we follow Shmanske (2000) and compare the fitted value of average score for an arbitrarily defined male (e.g., a sophomore at Kent State University), with a predicted value that uses female parameter estimates with mean values of male score determinants. What we find is that the fitted value for average score is 73.88, but the predicted value is 75.38. This helps to underscore how the skill-to-performance relationship for females causes their scores to be higher than males, holding all else constant. Using the same approach for an analogously defined female (i.e., a sophomore at Kent State University) yields a fitted value for average score of 79.51, but a predicted value of 77.35, using mean values of female score determinants with male parameter estimates. Again, the difference indicates that the skill-to-performance relationship for males contributes to their scores being lower than that of females, holding skills, experience, and team effects constant.

That these collective results provide some evidence of gender-specific differences in how various factors affect performance is an interesting set of findings. That is, we now have a better sense of why amateur golf performance varies across gender groups. The commonly discussed observation of different average scores for males versus females seems not to be solely a function of differences in skill levels or years of experience but also a function of how changes in score determinants affect golfer performance.

How might we explain these differences? Although definitive answers are beyond the scope of this research, we offer three possible explanations based on selected analyses and theories that have been explored in the literature. These are based on: (1) differences in the degree of competition; (2) varying opportunities within and across university athletic programs; and (3) dissimilar physiological and psychological factors. We present a brief overview of each, which may encourage further investigation of these and other possible explanations.

First, based on the calculations of the coefficient of variation discussed previously and presented in Table 2, there seems to be a greater degree of competition among male amateurs. This is not unlike what Moy and Liaw (1998) find in their analysis comparing professional male and female golfers. More competition among males might encourage longer practice sessions and greater concentration, which in turn should yield higher skill levels and correspondingly greater improvements in performance as those skills develop. Somewhat related to this issue is that male amateurs might also be more highly motivated to practice and may compete more aggressively because of greater earnings potential at the professional level than females. This reality is based in part on higher purses offered on the PGA tour than on the LPGA tour. In fact, some studies of professional golf suggest that golfer success depends on effort, which in turn is influenced by the skewed distribution of tournament purses, meaning that performance improves when the stakes are higher (Ehrenberg and Bognanno, 1990; Shmanske, 2000).

Second, there may be disparate expertise in the coaching staffs and/or significant differences in course difficulty for male teams relative to female teams. This might be the case across institutions or it may arise within a university’s athletic department. The source of such differences is important, since the provision of unequal opportunities based on gender is a violation of Title IX of the Educational Amendment Act of 1972, in which Section 106.41 pertains specifically to athletic programs. Part C of that section identifies several factors that are to be considered when assessing the provision of equal opportunities to both sexes. These include the provision of equipment and supplies, the scheduling of games and practice time, the opportunity to receive coaching and academic tutoring, and the provision of practice and competitive facilities (U.S. Department of Education, 1972).

Third, it is often argued in both the common press and professional journals that gender differences in golf skills and performance might be attributable to physiological or psychological distinctions between males and females. The nature and validity of such arguments are being studied and intensely debated in the literature, and hence no definitive conclusion can be offered here. However, we can identify some of the more salient elements of these arguments, and suggest that they may help to explain the gender differences observed in our sample of amateur golfers.

Some researchers focus on psychological factors that may have differing effects on the play of male and female golfers. To illustrate, consider that Hassmen, Raglin, and Lundqvist (2004) identify a significant correlation between the variability of amateur male golfers’ somatic (or physiological) anxiety levels and the variability of their golf scores. However, Krane and Williams (1992) find no such relationship for their sample of amateur female golfers.

Others ascribe gender-based performance differences to physiological attributes. A common assertion in the professional golf literature is that men’s larger physical size and greater strength explains their ability to drive the ball further than females, and this may in turn explain the lower mean golf scores achieved by males. See, for example, Moy and Liaw (1998). However, others argue that such an assertion is incorrect, because driving a golf ball requires more skill than brute strength alone would provide (Shmanske, 2000). Indeed, in a sophisticated study of the biomechanics of golf, Hume, Keogh and Reid (2005), analyze the two main movements in golf – the swing and the putt, and show that golfers must possess strength, flexibility, and timing to achieve the distance and accuracy necessary for success. Hence, observed gender differences in shot-making skills might be linked to dissimilarities in any or all of these attributes. Some evidence of this hypothesis is offered by Myers, Gebhardt, Crump, and Fleishman (1993), who find within their tests of male and female physical abilities that males scored higher than females on tests of strength and stamina, while females scored higher on tests of flexibility. These findings might explain why male golfers generally drive the ball farther than women and why females typically achieve greater driving accuracy, results found in our analysis and others.

Conclusions

In our previous study of NCAA Division I male golfers, we identified the relationship between an amateur golfer’s tournament performance and various shot-making skills (Callan and Thomas, 2004). This present investigation advances this work by extending the analysis to both females and males. In so doing, we are able to examine whether the skill levels of amateur female golfers differ from those identified for males. Taking this one step further, we also are able to estimate the relationship between each shot-making skill and overall performance for males and females and specifically test for any statistically significant gender differences. To our knowledge, this is the first such study to examine gender differences in amateur golf.

Using a sample of NCAA Division I male and female golfers who participated in tournament play during 2004-2005, our empirical estimation and subsequent analysis supports two important conclusions. First, male and female amateur golfers, on average, possess dissimilar levels of various shot-making skills, and these differences indeed are statistically significant. Such dissimilarities are consistent with the literature examining gender distinctions among professional golfers. In this case, we find that on average, NCAA Division I male golfers possess superior shot-making skills relative to females for all shot-making skills except FAIRWAYS HIT, for which the opposite is true. Second, the manner in which shot-making skills influence tournament performance is not independent of gender. For example, male golfers achieve greater performance improvements by improving SAND SAVES, while females gain more from increasing the GIR proportion and from reducing PUTTS PER ROUND.

Both sets of results are of interest because they improve our understanding of the complexities of amateur golf tournament play. Moreover, through statistical testing, they validate anecdotal evidence of differing skill levels and performance outcomes across male and female collegiate teams. In so doing, the findings suggest the need for further research to learn more about these distinctions and, if necessary, to suggest changes in tournament play that recognize, and perhaps correct for, these disparities.

Although the root causes of gender-based differences in NCAA Division I golf cannot be identified, we do offer several plausible explanations based on research findings from the economics, sports medicine, and physiology literatures. First, we offer the possibility that the higher degree of competition among male golfers may incite more practice and more intensity of play, which in turn may translate into superior skills and/or tournament scores. Second, we suggest that skill and performance distinctions may be related to differences in facilities, coaching, and/or varying course venues. Further study is needed to identify these differences and to determine if there are associated implications for Title IX. Lastly, we consider the role of physiological and psychological factors in explaining gender-specific skill levels and performance in sports, an area that has been, and likely will continue to be, studied in earnest.

We believe that our study and its associated findings are of interest in their own right and contribute to the literature examining both professional and amateur golf. However, it is our hope that this work will have broader implications by encouraging new research in amateur golf and other sports aimed at learning more about the skill-to-performance relationship and the influence of gender and other factors on this important connection in amateur and professional sports.

REFERENCES

  1. Belkin, D.S., Gansneder, B., Pickens, M., Rotella, R.J., and Striegel, D. (1994) “Predictability and Stability of Professional Golf Association Tour Statistics.” Perceptual and Motor Skills, 78, 1275-1280.
  2. Callan, Scott J. and Thomas, Janet M. (2004) “Determinants of Success among Amateur Golfers: An Examination of NCAA Division I Male Golfers.” The Sport Journal, 7 (3). Available at http://www.thesportjournal.org/2004Journal/Vol7-No3/CallanThomas.asp.
  3. Dorsel, T. N. and Rotunda, R. J. (2001) “Low Scores, Top 10 Finishes, and Big Money: An Analysis of Professional Golf Association Tour Statistics and How These Relate to Overall Performance.” Perceptual and Motor Skills, 92, 575-585.
  4. Ehrenberg, Ronald G. and Bognanno, Michael L. (1990) “Do Tournaments Have Incentive Effects?” Journal of Political Economy, 96, 1307-1324.
  5. Golfstat, Inc. (2005) “Customized Team Pages-Men and Women,” (accessed August 16, 2005), various teams.
  6. Hassmen, Peter; Raglin, John S.; and Lundqvist, Carolina (2004) “Intra-Individual Variability in State Anxiety and Self-Confidence in Elite Golfers.” Journal of Sport Behavior, 27 (3), 277-290.
  7. Hume, Patria A., Keogh, Justin, and Reid, Duncan. (2005) “The Role of Biomechanics in Maximizing Distance and Accuracy of Golf Shots.” Sports Medicine, 35(5), 429-49.
  8. Krane, Vikki and Williams, Jean. (1992) “Path Analysis Examining Relationships among Cognitive Anxiety, Somatic Anxiety, State Confidence, Performance Expectations, and Golf Performance. “ Journal of Sports Behavior, December, 15(4), 279-96.
  9. Myers, David C.; Gebhardt, Deborah L.; Crump, Carolyn E.; and Fleishman, Edwin A. (1993) “The Dimensions of Human Physical Performance: Factor Analysis of Strength, Stamina, Flexibility, and Body Composition Measures.” Human Performance, 6 (4), 309-44.
  10. Moy, R. L. and Liaw, T. (1998) “Determinants of Professional Golf Tournament Earnings.” The American Economist, 42, 65-70.
  11. Shmanske, Stephen (2000) “Gender, Skill, and Earnings in Professional Golf.” Journal of Sports Economics 1(4), 385-400.
  12. United States Department of Education. (1972). “Title IX of the Educational Amendment Act.”(Available at http://www.ed.gov/policy/rights/reg/ocr/edlite-34cfr106.html)
  13. United States Golf Association (USGA) (2005), “Course Rating™ Primer.” (Available at http://www.usga.org/playing/handicaps/course_ratings/course_rating_primer.html, accessed April 25, 2006.)
  14. Wiseman, F., Chatterjee, S., Wiseman, D., and Chatterjee, N. (1994) “An Analysis of 1992 Performance Statistics for Players on the U.S. PGA, Senior PGA, and LPGA Tours.” In A. J. Cochran and M. R. Farrally (Eds.), Science and Golf: II. Proceedings of the World Scientific Congress of Golf. London: E & FN Spon. 199-204.
TABLE 1
UNIVERSITIES INCLUDED IN THE STUDY
MEN’S GOLF TEAM WOMEN’S GOLF TEAM
UNIVERSITY NUMBER
OF
GOLFERS
NUMBER OF TOURNAMENTS AVERAGE YARDS PER TOURNAMENT (STANDARD DEVIATION NUMBER OF GOLFERS NUMBER OF TOURNAMENTS AVERAGE YARDS PER TOURNAMENT (STANDARD DEVIATION)
Coastal Carolina University 10 11 6971
(119)
5 10 5994
(75)
Ea. Tenn. State University 9 10 7029
(125)
7 9 5978
(106)
Fresno State University 8 14 6924
(238)
8 11 6080
(121)
Indiana
University
9 11 7035
(129)
8 10 6120
(111)
Kent State University 8 10 7017
(156)
7 11 6111
(123)
University of Kentucky 7 10 7091
(227)
11 11 6162
(377)
University of New Mexico 8 11 7128
(330)
6 8 6090
(177)
University of So. California 9 11 6934
(186)
10 9 6115
(169)
Texas A & M University 10 11 7066
(213)
9 10 6187
(125)
University of
Texas
8 10 7218
(224)
8 9 6169
(186)
Vanderbilt University 8 10 7045
(215)
6 9 6139
(171)
Average
(std. deviation)
8.5
(0.93)
10.8
(1.17)
7042
(85.34)
7.7
(1.8)
9.7
(1.01)
6104
(66.99)

Source: Golfstat, Inc. (2005) and individual team Web pages.

TABLE 2
BASIC DESCRIPTIVE STATISTICS
MEAN STANDARD DEVIATION MINIMUM MAXIMUM COEFFICIENT OF VARIATION
VARIABLE MALE
(N=94)
FEMALE
(N=85)
MALE FEMALE MALE FEMALE MALE FEMALE MALE FEMALE
Score 74.97 79.23 2.22 3.53 69.95 73.50 81.33 94.45 0.030 0.045
Eagles 1.80 0.34 2.23 0.61 0.00 0.00 9.00 2.00 1.239 1.794
Fairways Hit 0.64 0.70 0.08 0.09 0.36 0.47 0.86 0.88 0.125 0.129
Greens in Regulation 0.60 0.50 0.08 0.10 0.33 0.16 0.81 0.65 0.133 0.200
Putts per Round 30.83 32.31 1.42 1.29 23.00 29.84 35.33 35.71 0.046 0.040
Sand Saves 0.39 0.29 0.15 0.13 0.00 0.06 1.00 1.00 0.385 0.448
Rounds 24.11 22.31 12.83 8.89 3.00 3.00 43.00 36.00 0.532 0.398
Freshman 0.17 0.29 0.38 0.46 0.00 0.00 1.00 1.00 2.235 1.586
Sophomore 0.22 0.24 0.42 0.43 0.00 0.00 1.00 1.00 1.909 1.792
Junior 0.28 0.26 0.45 0.44 0.00 0.00 1.00 1.00 1.607 1.692
Senior 0.33 0.21 0.47 0.41 0.00 0.00 1.00 1.00 1.424 1.952

NOTE: Basic statistics for each university dummy variable are available from the authors upon request.

TABLE 3
MEAN DIFFERENCES IN SHOT–MAKING SKILLS ACROSS GENDERS
Variable Mean Difference
(Male – Female)
Standard Error* t-statistic p-value
Eagles 1.4567 0.2501 5.82 <.0001
Fairways Hit –0.0540 0.0128 –4.24 <.0001
Greens in Regulation 0.0982 0.0132 7.46 <.0001
Putts per Round –1.4810 0.2036 –7.27 <.0001
Sand Saves 0.0984 0.0216 4.56 <.0001

*Standard error calculation assumes male and female populations have equal variances.


TABLE 4
REGRESSION MODEL PARAMETER ESTIMATES
DETERMINANTS PARAMETER ESTIMATE INTERACTION TERMS (FOR FEMALES) PARAMETER ESTIMATE
Intercept 69.40 *** Female Intercept –15.24 ***
Shot-Making Skill Variables Shot-Making Skill Variables
Eagles –0.10 ** (Female)(Eagles) 0.22
Fairways Hit 0.05 (Female)(Fairways Hit) –0.40
Greens in Regulation (GIR) –21.86 *** (Female)(GIR) –4.08 *
Putts per round 0.64 *** (Female)(Putts per Round) 0.53 ***
Sand Saves –1.32 ** (Female)(Sand Saves) 1.68 **
Experience Variables Academic Age Variables
Rounds –0.03 *** (Female)(Rounds) 0.01
Junior 0.05 (female)(Junior) –0.23
Sophomore –0.41 * (Female)(Sophomore) 0.68 *
Freshman 0.08 (Female)(Freshman) 0.02
Team Variables Team Variables
Coastal Carolina 0.44 (Female)(Coastal Carolina) 0.95
East Tennessee State 1.11 *** (Female)(East Tennessee) 0.49
Fresno State 0.58 (Female)(Fresno State) –0.14
Indiana University –0.21 (Female)(Indiana University) 1.77 **
Kent State –0.34 (Female)(Kent State) 1.13 *
Univ. of Kentucky 0.56 (Female)(Univ. of Kentucky) 0.35
Univ. of New Mexico 0.32 (Female)(Univ. of New Mexico) 0.07
Univ. of Southern California 0.44 (Female)(Univ. of Southern California) –0.55
Texas A&M University 0.06 (Female)(Texas A&M University) 1.01
University of Texas 0.99 ** (Female)(University of Texas) –0.56
F-Statistic 82.75
(p-value< 0.001)
R-Squared 95.87
Adjusted R-Squared 94.71
F-Statistic (no gender differences overall) 2.83
(p-value < 0.001)
F-Statistic (no gender differences with respect to shot-making skills) 2.84
(p-value = 0.012)
F-Statistic (no gender differences with respect to academic age) 2.10
(p-value = 0.103)
F-Statistic (no gender differences with respect to team variables) 2.39
(p-value = 0.012)

* significant at the 0.10 level, assuming a one-tailed test of hypothesis for skills and two-tailed test elsewhere
** significant at the 0.05 level, assuming a one-tailed test of hypothesis for skills and two-tailed test elsewhere
*** significant at the 0.01 level, assuming a one-tailed test of hypothesis for skills and two-tailed test elsewhere

2015-03-27T11:50:33-05:00June 3rd, 2006|Contemporary Sports Issues, Sports Exercise Science, Sports Studies and Sports Psychology, Women and Sports|Comments Off on Gender, Skill, and Performance in Amateur Golf: An Examination of NCAA Division I Golfers

Preferred Player Characteristics and Skills of Division I Men’s Basketball Coaches

Abstract

A national survey of selected men’s basketball coaches, at the NCAA Division I level, revealed how essential the respondents felt certain work ethic characteristics were for successful basketball players on their team. The respondents also revealed how important specific skills or talents were for the success of men’s NCAA men’s Division I basketball programs. The survey was completed by means of a 36-item Likert scale questionnaire. This investigation determined to what degree NCAA Division I coaches should seek specific work ethic characteristics and physical skills/talents in their players.

Introduction

College basketball coaches seek athletes with high caliber skills and specific basketball talent as well as a good overall work ethic. Although there is plenty of antidotal information regarding the type of desirable skills and talent desirable in the world of basketball, there has been very little definitive research done in terms of determining exactly what skills, talent and examples of work ethic are highly rated by coaches of men’s basketball at the NCAA Division I level of competition (Stier, 1997).

Successful and effective coaching is a highly complex and multi-dimensional enterprise (Jones, Housner, and Kornspan, 1997). It is very important, according to Owens & Stewart (2003) to be able to understand individual squad members’ physical, emotional, social and cognitive needs if the team is to be successful, that is, win. In a study by Forman (1995), it was determined that college basketball coaches need to make a commitment to each player’s growth and improvement in the sport if the team, as a collective unit, is to emerge victorious in actual competition,

In a study of elite athletes by Mallet & Hanrahan (2004), it was determined that players recognize the need to train hard to be winners. Training hard implies working diligently to improve both individual and team performance in order to produce meaningful results when it counts, in actual competition (Laios and Theodorakis, 2002). This emphasis on both individual and team (collective) training is reinforced by Bursari, (2000).

Elite athletes exhibit significant effort in games as well as in practice and this dedication extends to off-season work habits (Adams, 1996). The ability and willingness to work hard as well as to work harder are important examples of an athlete’s ability that can lead to success on the proverbial playing field, especially if the coach believes in the athlete and is successful in motivating the individual player to work harder (Jowett, 2003).

Literature presented by Stier (1998) included several major factors that distinguish consistent winning teams from teams that consistently lose: (a) better skilled athletes and (b) better conditioned athletes. The importance of adequate strength and conditioning was emphasized by Laios and Theodorakis (2002). Dirks (2000) studied control variables of team performance representing elements of the coach and players’ talent. And, in 1999, Pascarella et al. looked at the topic of physical energy that is required of athletes in actual competition.

Purpose of the Study

The purposes of this study were two-fold. The first purpose was to determine the essentiality of selected work ethic characteristics on behalf of athletes. And, the second was to determine the importance of specific skills or talents of athletes to the success of men’s NCAA men’s Division I basketball programs. In summary, this investigation sought to determine to what degree coaches should seek in their Division I men’s basketball players’ specific work ethic characteristics and physical skills/talents.

Methods

The Questionnaire

A survey instrument was developed from the existing current literature related to work ethic characteristics of players as well as specific athletic skills and talents that might have an effect on the success or failure of NCAA Division I men’s basketball programs. An extensive literature search found basketball related articles in which work ethic characteristics and various athletic skills and talent for athletes engaged in basketball were identified and which served as the foundation for the 36 items included on the Likert scale statements of the questionnaire.

Of the total of 36 Likert scale statements, 15 related to work ethic characteristics while 21 related to athletic skills and talents that might have an impact upon the success or failure of Division I men’s basketball programs. For work ethic characteristics, respondents were instructed to circle the number that corresponded with the degree of essentiality they believed most accurately depicted the impact that selected work ethic characteristics have upon the success [winning games] of their basketball programs and had the following categories of essentiality from which to choose: 5 – Very Essential, 4 – Essential, 3 – Neither Essential nor Unessential, 2 – Unessential, and 1 – Very Unessential. For the second category, specific athletic skills and talents, the coaches had the following Likert scale options which included the following choices of importance from which they were asked to circle the corresponding number: 1 – Very Important, 2 – Important, 3 – Neither Important nor Unimportant, 4 – Unimportant, and 5 – Very Unimportant.

To help address content validity a draft of the survey questionnaire was completed by five Division I head basketball coaches who were determined to be expert coaches for the purpose of gaining feedback regarding the instrument. In order to be deemed an expert coach, the coaches were required to have coached men’s basketball at the Division I level for at least 10 years and won at least 75% of their games during that time. After receiving the feedback from the expert coaches, appropriate suggestions and recommendations were incorporated into the final version of the survey instrument which was then utilized in this national study. The University’s Internal Review Board reviewed the final, revised version of the instrument and gave its approval.

The subjects for this national survey included all 315 men’s NCAA Division I head basketball coaches whose names and addresses were provided by the NCAA national headquarters. Of these, 118 completed and returned usable surveys generating a return rate of 37.5%.

Results

Work Ethic – Training

The category of work ethic contained two general categories, (a) training and (b) effort.

Of the eight characteristics related to training, six pertained directly to players’ training; two pertained to sacrifices made by athletes and the remaining two dealt directly with the athletes’ state of physical conditioning. Training hard was deemed to be the single most essential characteristic for winning, according to the respondents. In fact, 74.6% of the coaches indicated that training hard was very essential to winning while 25.4% classified it as essential.

Strength and conditioning was likewise thought to be very essential by a large percentage of coaches (72.9%), and deemed essential by 25.4%. Individual training was the only other work ethic characteristic thought to be very essential by more than half of the coaches (52.5%), while another sizeable group of coaches (44.1%) also classified this characteristic as essential. Table 1 shows all eight work ethic characteristics and how the respondents classified each in terms of how essential they are to winning basketball games at the Division I level.

Work Ethic – Effort

Of the seven characteristics identified in the survey as being related to effort, three dealt directly with effort, two addressed the conditioning efforts of players, while the remaining two involved how essential were the players’ work habits—in the eyes of the responding coaches. Individual player’s effort, in general, was consistently valued very highly by coaches with five of the seven categories deemed to be very essential by more than sixty percent (64.4%) of the respondents. Only two categories relating to effort were deemed to be very essential by less than half of the coaches, and both related to off-season activities. These were (a) player’s off-season conditioning efforts (45.8%) and (b) player’s off-season work habits. Table 2 illustrates how essential the coaches viewed these seven work ethic characteristics that related to effort.

Athletic Skills and Talents – Performance and Abilities

The section on athletic skills and talents contained two general categories, (a) performance/skills and (b) basketball talent. Of the eight performance skills identified in the investigation, two related directly with performance, two pertained directly to individual and team play while three dealt with abilities of players. The remaining skill is related to the physical energy that a player exudes. Only three performance skills were deemed to be very important by more than half of the coaches responding to the survey: (a) game performance (83.1%), (b) team oriented play (67.8%), and (c) physical energy (66.1%). Table 3 illustrates how the respondents rated each of the eight performance/abilities in terms of their importance or unimportance to winning Division I basketball games.

Athletic Skills and Talents – Basketball Talent

Of the 21 basketball talent categories that the coaches rated in terms of importance, 7 items related to physical talent while the remaining 14 focused on specific basketball skills. Defense, with 57.6% of the coaches, and passing, with 55.5%, were the only talent items that more than half of the respondents rated as very important. Two other talent categories are worth noting in that both (a) overall fundamental base and (b) rebounding were the only two talent categories that all the respondents classified as very important or important. Table 4 shows how the coaches classified all of the categories of basketball talent relative to their importance of unimportance in terms of their impact upon winning.

Conclusions

This national investigation sheds light on how Division I basketball coaches view the essentiality of specific work ethic characteristics and the importance these coaches place on specific skills or talents identified as having impact upon winning in competition. The results have implications for coaches in respect to what qualities, characteristics, skills and talents to look for in terms of potential recruits as well as current team members.

References

  1. Adams, M.J. (1996). The perception of high school players and coaches in regard to individual and team efficacy in basketball. Unpublished doctoral dissertation, University of North Carolina at Greensboro.
  2. Bursari, J.O. (2000). Revisiting analogy as an educational tool – PBL and the game of basketball. Medical Education, 34, 1029-1031.
  3. Dirks, K.T. (2000). Trust in leadership and team performance: evidence from NCAA Basketball. Journal of Applied Psychology, 85, 1004-1012.
  4. Forman, B. (1995). Factors of hiring head coaches in collegiate athletics. Unpublished master’s thesis, Ball State University, Muncie, Indiana.
  5. Jones, D.F., Hosnder, L.D., & Kornspan, A.S. Interactive decision making and behavior of experienced and inexperienced basketball coaches during practice. Journal of
  6. Teaching in Physical Education, 16, 454-468.
  7. Jowett, S. (2003). When the “honeymoon” is over: a case study of a coach-athlete dyad in
  8. crisis. The Sport Psychologist, 17, 444-460.
  9. Laios, A., & Theodorakis, N. (2002). The pre-season training of professional basketball teams in Greece. International Sports Journal, 6(1), 146-152.
  10. Mallet, C.J., & Hanrahan, S.J. (2004). Elite athletes: why does the ‘fire’ burn so brightly?
  11. Psychology of Sport and Exercise, 5, 183-200.
  12. Owens, L. & Stewart, C. (2003). Understanding athletes’ learning styles. International Society of Biomechancis in Sport, Coach Information Service, http://www.education.ed.ac.uk/cis/index.html.
  13. Pascarella, E.T., Truckenmiller, R., Nora A., Terenzini, P.T., Edision, M., & Hagedorn, L.C. (1999). Cognitive impacts of intercollegiate athletic participation. The Journal of Higher Education, 70, 1-26.
  14. Stier, W. F., Jr. (1997). Coaching modern basketball — Hints, strategies and tactics. Boston, MA: Allyn & Bacon.
  15. Stier, W. F., Jr. (1998). Coaching concepts and strategies (2nd ed.). Boston: American Press.
Table One
Table TwoTable ThreeTable Four

2015-03-27T11:46:35-05:00June 1st, 2006|Contemporary Sports Issues, Sports Coaching, Sports Exercise Science, Sports Management, Sports Studies and Sports Psychology|Comments Off on Preferred Player Characteristics and Skills of Division I Men’s Basketball Coaches

ITU Athlete Routines, Rituals, & Performance Strategies

The Olympic Triathlete trains and the coach plans for four disciplines: the swim, bike, run, and transitions. The 1.5 kilometer swim, 40 kilometer bike, and 10 kilometer run are rarely done in ideal conditions or courses, adding to the complex formula that the athlete must compete against in order to win. At the Olympic level of competition every advantage and possible race situation needs to be planned in advance. In a sport that takes less than two hours to complete, often seconds is what separates the Gold from second place. (more…)

2015-03-27T11:27:34-05:00March 1st, 2006|Sports Exercise Science, Sports Studies and Sports Psychology|Comments Off on ITU Athlete Routines, Rituals, & Performance Strategies
Go to Top