The Effects of Video and Cognitive Imagery on Throwing Performance of Baseball Pitchers: A Single Subject Design

ABSTRACT
The purpose of this study was to examine the effects of a three-week imagery and video imagery intervention program on the throwing accuracy of individual baseball pitchers. A secondary purpose of this study was to investigate whether differences in accuracy response characterize both low- and high-ability imagers. A sample of pitchers (n=30) were asked to take the Movement Imagery Questionnaire–Revised; study participants were randomly selected from the highest and lowest 20% of the group. The participants were obtained from high school and college teams within southeastern Georgia (n= 6). Following the first week of baseline measurements, 2 high-ability and 2 low-ability imagers took part in a three-week video imagery and imagery intervention program. One participant from each group together constituted a control group, which was asked only to try their best when throwing for the study’s accuracy measurements. Results showed that 2 participants demonstrated an increase in performance, while all participants expressed a desire to continue to use imagery for its various effects. Suggestions for future research and further insight are discussed.

INTRODUCTION
Imagery has been shown to be very effective for improving accuracy in sport. Thomas and Fogarty (1997) found that imagery combined with positive self-talk improved not only putting performance, but psychological factors as well. Woolfork et al. (2005) found that positive imagery participants, in comparison to negative imagery training and control group participants, experienced significant increases in putting performance. Moreover, imagery has been shown to positively enhance free-throw shooting among collegiate basketball players. Kearns and Crossman (1992), Shambrook and Bull (1996), Templin and Vernacchia (1993, 1995),Stewart (1997), and Carboni, Burke, Joyner, Hardy, and Blom (2000) have determined imagery to be to some degree effective for most individuals at enhancing free-throw performance.

Much of the research cited above utilized a single subject design. This type of design has proved important in applied sport psychology, demonstrating improvement in individual cases that might be overlooked by traditional group analysis (Shambrook & Bull, 1996). For instance, when a multiple baseline design is used, a conclusion could be drawn that any effects were due to the specific intervention (Bryan, 1987, p. 286). The single subject design, in contrast, allows for individual analysis of the imagery implementation and a way to tailor the intervention to the individual (Stewart, 1997).

Visualization theories have not always been applied to sport performance; they began in the field of cognitive and spatial awareness research. Bess (1909) was among the first researchers of the topic and is credited with developing the measuring system for visualization. The Bess Scale addresses differences in individual imagery ability, drawing on cognitive theory of imagery and tied closely to the understanding of the term kinesthetic imagery(Schiffman, 1995).

A pitcher may be asked to imagine the ball in hand before a throw, to feel the laces and texture on the palm, maybe even to brush the dirt off, as if the ball was just grabbed from the ground. Bess notes that the image should be as clear and detailed as possible, and his Bess Scale measures the vividness of the visualizations practiced with seven classifications of vagueness and vividness. However, Wilson & Barber (1981) found that individuals can vary greatly in their ability to visualize, even when their Bess Scale scores are alike. Moreover, Stoksahl and Ascough (1998) also found that some athletes were very detailed in their imaging, while others were very vague; they concluded that the less vivid images may not be as effective for enhancing performance. Therefore, athletes with lower imagery ability may not reap full performance-enhancement benefits from imagery training. Such findings provide one more reason to investigate the effects of video imagery: Individuals who lack vivid imaging skills may find that a video re-enactment of the task allows them to see the desired performance very clearly, aiding mental preparation for an actual event or task demonstration.

Little research appears in the literature which has examined the effects on performance of internal video imagery, or video depicting an athlete’s internal perspective during performance. However, at least some research has integrated videotape modeling with imagery training. Hall and Erffmmeyer (1983) investigated female high school basketball players who were assigned to a video modeling/imagery group and a relaxation/imagery group. Results can only be attributed to a combination of psychological skills, as they were compounded within the study, but it was concluded that the video modeling/imagery group demonstrated better performance in foul shooting, compared to the relaxation/imagery group. Little research seems to exist exploring internal video imagery in other sports contexts, specifically baseball and, more specifically, pitching accuracy.

While general research on imagery is vast, this study seeks to investigate the effects of cognitive imagery and video imagery on one phenomenon: the throwing performance of baseball pitchers. A secondary purpose of this study is to see whether low-ability imagery and high-ability imagery are associated with distinct performance responses following video and cognitive imagery interventions.

METHOD
Participants
The study participants were 6 baseball pitchers from southeastern Georgia. They were selected from the region’s high schools and colleges. Four males, 2 current college athletes and 2 current high school athletes, took part in the study. The participants’ mean age was 19.8 years, with ages ranging from 16 to 22 years. Only athletes currently on pitching staffs of high school or college baseball teams were utilized. All participants had been baseball athletes for at least the previous 2 years, at either the high school or college level. All were asked to return a signed consent form before participating in the study; participants under 18 years of age were asked to return a parental consent form before participating. The consent form assured participants of confidentiality, briefed them on the study’s purpose, and listed the risks and benefits of participation. Contact was made with each institution, informing participants, parents, and coaches that athletes’ participation was completely voluntary.

Apparatus
A Samsung Sports Camcorder SC-X205L/X210L was used to record all accuracy-measurement sessions, in order to ensure that accurate points were recorded for each pitch. At no time, however, was the pitcher himself captured in these recordings. The Samsung Camcorder SC-X205L/X210L external helmet camera module, used to capture recordings of an accurate pitch from the internal perspective of the pitcher, was used in the video imagery interventions.

Instrumentation
Throwing performance was measured with an Easton© 9-square Strike Zone Target, which was placed on the plate in the visitors bullpen at Georgia Southern University, emulating an actual game. Each section of the target was assigned a point value, ranging from 1 to 10; 10 was the value for the center box, with lower values designated for squares nearer the edges of the target. Point values between the ranges of the surrounding boxes values were assigned to the dividing lines themselves. Each pitching accuracy measurement session was videotaped, allowing the researchers to review each pitch at leisure, ensuring the correct assignment of points; however, only the target and the end result of the pitch were captured on videotape during measurement sessions.

Prior to the study, an imagery ability test was given to a group of 30 high school and college baseball pitchers, to identify athletes with high- and low-ability imagery skills who might become part of the study sample. The Movement Imagery Questionnaire- Revised (MIQ-R) was used to measure the athletes’ imagery ability (see Appendix A). Hall and Martin (1997) developed the MIQ-R, a revision of Hall and Pongrac’s Movement Imagery Questionnaire, or MIQ (1983), in order to assess individuals’ capacity to generate visual imagery and also kinesthetic (or movement) imagery. The present researchers have determined the MIQ- R to be a valid and reliable revision of the original instrument: Earlier work has established significant correlations for the MIQ-R’s visual and kinesthetic scales. For the MIQ, Hall, Pongrac, and Buckholz (1985) obtained a test–retest co-efficiency score of .83; in terms of internal consistencies, a score of .89 was obtained for the visual scale and a score of .88 was obtained for the kinesthetic scale (Atienza et al., 1994).

A Post Study Imagery Questionnaire was distributed to the present study’s participants at the completion of the investigation. This questionnaire sought feedback from each pitcher as to prior experience with imagery, present attitude toward imagery, and likelihood of future imagery use. Moreover, it asked the athletes to think about effects of imagery occurring in dimensions other than performance. The questionnaire asked these questions, specifically: Did you at any time use imagery outside of this study? How do you feel about the use of imagery in general? Do you feel it helped you and how so? Do you feel there was a difference between the two types of imagery and if so what were they? Will you continue imagery use?

Procedures
The pitchers’ completed MIQ-R instruments; later on, their scores were collected and recorded by number, both to protect confidentiality and to help ensure random selection of participants. Pitchers completing the MIQ-R were also given a brief explanation of what the instrument covered and directions for providing answers. A 7-point Likert scale was employed for each question, and the points assigned each question were totaled for each participant. Using the scores obtained, 3 participants were chosen at random from the top 20% of scores, and another 3 were selected randomly from the bottom 20%; the 6 were asked to participate in the study. By omitting participants with middle-ranking scores, the study sought to secure a sample that truly represented high- and low-ability imagery skills. Participants signed a consent form or obtained written parental consent prior to participating.

Participants were asked to meet with an “observer” 5 times during the first week of the study, the period during which a stable baseline was to be established for each pitcher; after a baseline existed (which ideally required 1 week but in fact might have required more time), participant and observer were to meet 4 times during each of the next 3 weeks. The 3 weeks constituted the invention portion of the study. Prior to the intervention, each pitcher’s throwing performance was measured 5 times a week, until he had demonstrated a stable baseline, defined as an average score displaying no more than a 2-point variance in at least 3 consecutive trials. The first-week, baseline portion of the study was followed by imagery interventions beginning in the second week; each imagery intervention required 6 visits, or one and one-half weeks. Measurements were taken 4 times a week, post imagery session, during the imagery and video imagery intervention programs, until the study’s completion. Throwing-performance measurements were determined by averaging a pitcher’s scores for 10 pitches in the visitors bullpen of an NCAA Division I university. The measurement apparatus was placed in front of the bullpen home plate. During the baseline portion of the study, the Samsung Sports Camcorder SC-X205L/X210L was used to create video imagery segments for use during the intervention portion, with each pitcher wearing the “helmet-cam” module (placed aside his head, at eye level) and capturing his own internal perspective on the throwing of an accurate pitch. (At no time was any pitcher himself captured in a recording.) The module is worn comfortably on a headband, and no participate indicated discomfort during its use. The study design incorporated counterbalancing to eliminate sequence effects.

Participant 1 and Participant 4 experienced the cognitive imagery intervention during Week 1 of the intervention portion of the study, followed by video imagery intervention beginning in the middle of Week 2 (the two athletes’ seventh study session). Participant 2 and Participant 5 experienced video imagery sessions as the initial intervention during Week 1 of the study’s intervention portion. They participated in cognitive imagery intervention during Session 7 through Session 12. The throwing accuracy of Participant 3 and Participant 6 was measured 4 times a week, and they received no intervention, serving as a control group.

The university’s Mental Edge Training Facility was used for the video and cognitive imagery sessions, which were conducted individually (rather than in groups) during scheduled time slots. An imagery session was of a 10-minute (approximately) duration. During the video imagery interventions, participants were asked to watch the previously recorded 10-point pitch while imagining accompanying sensations, to include sounds, smells, tastes, and textures, in as much detail as possible. During the cognitive imagery interventions, in contrast, they were asked to imagine the 10-point pitch as vividly as they were able, again using the five senses as much as possible. At the study’s end, each participant completed the Post Study Imagery Questionnaire, providing insights into his attitudes towards imagery generally, as well as his unique responses to imagery practice, performance, or similarly related issue. The Post Study Imagery Questionnaire also attempted to determine whether and why players would continue to practice imagery techniques.

Data Analysis
Data were represented graphically to describe each participant, then reviewed for practical differences in throwing accuracy. Ocular statistics (Carboni et al., 2000) were reviewed by a group of trained researchers to determine actual changes in throwing accuracy and to provide control of the researcher’s bias. Qualitative results of the Post Study Imagery Questionnaire were collected and reported.

RESULTS
Data collected for this study were evaluated using mixed methodological procedures from ocular statistics (Carboni, et al, 200); additionally, they are explored in qualitative terms. Figures 1–6 will illustrate the participants’ throwing performance scores over the length of the study. Figures 7–12 will illustrate perfect pitch count scores over the length of the study.
Table 1 presents the participants’ throwing performance scores, with standard deviations. Table 2 presents a count of perfect pitches thrown by the participants.

Table 1
Participants’ throwing accuracy scores*

Session
Number

High- Ability Participant
1
(C.I./ V.I.)

High- Ability Participant
2
(V.I./ C.I.)

High- Ability Participant
3
(Control)

Low- Ability Participant
4
(C.I./ V.I.)

Low- Ability Participant
5
(V. I./C.I.)

Low-
Ability Participant
6
(Control)

1

2.7 (3.2) 3.6 (4.7) 3.3 (4.0) 4.3 (3.8) 3.5 (3.7) 2.0 (3.1)

2

2.5 (3.0) 1.9 (3.0) 3.2 (4.0) 2.3 (2.6) .1 (3.2) 1.8 (2.4)

3

3.4 (4.5) .9 (1.9) 4.4 (3.7) 4.6 (4.2) .8 (1.3) 3.5 (3.2)

4

2.5 (3.6) 1.1 (3.1) 3.5 (4.5) 4.5 (3.5) .6 (1.9) 3.3 (2.9)

5

3.2 (3.9) 1.0 (1.9) 3.7 (3.6) 4.0 (3.4) 1.0 (1.3) 3.4 (3.1)

6

3.2 (3.9) 1.4 (2.3) 3.4 (4.0) 3.4 (3.9) 1.3 (2.5) 3.2 (3.9)

7

3.0 (2.4) 1.6 (1.9) 3.4 (3.7) 1.8 (2.4) 1.9 (3.0) 2.6 (3.9)

8

1.4 (1.8) 1.5 (2.0) 2.5 (3.5) 2.1 (2.0) 3.3 (4.7) 2.6 (3.0)

9

3.6 (3.9) 1.9 (2.2) 3.3 (4.0) 3.1 (3.1) 4.8 (4.6) 4.4 (3.4)

10

3.9 (4.6) 1.9 (3.1) 1.0 (1.9) 3.3 (3.9) 2.5 (4.0) 1.0 (1.9)

11

3.8 (4.1) 4.1 (5.1) 4.1 (3.9) 4.5 (4.7) 1.2 (3.2) 1.5 (3.1)

12

3.5 (3.7) 5.1 (4.1) 2.3 (4.1) 4.2 (3.4) 2.5 (4.0) 1.8 (2.6)

13

3.9 (3.8) 3.6 (4.1) 1.8 (3.1) 3.8 (3.3) 2.6 (3.9) 2.2 (3.7)

14

5.3 (3.7) 3.8 (3.7) 1.0 (1.9) 4.1 (3.80 3.9 (3.3) 1.0 (1.9)

15

3.3 (3.5) 3.8 (4.0) 1.5 (1.8) 3.3 (2.4) 4.0 (4.1) 2.1 (2.8)

16

3.8 (3.8) 3.8 (3.9) 1.0 (1.1) 4.5 (4.1) 3.5 (4.6) 1.8 (3.4)

17

3.6 (3.7) 4.0 (3.7) 2.7 (4.3) 4.5 (3.5) 3.7 (3.5) 2.4 (3.6)

* Standard deviations in parentheses.

Table 2
Perfect pitches thrown

Session
Number

High- Ability Participant 1

High- Ability Participant 2

High- Ability Participant
3

Low- Ability Participant
4

Low- Ability Participant 5

Low- Ability Participant 6

1

1 2 2 2 0 1

2

1 0 2 0 0 0

3

2 0 2 2 0 0

4

1 1 3 0 0 0

5

2 0 2 0 0 0

6

2 0 2 2 0 1

7

0 0 1 0 0 1

8

0 0 1 0 0 0

9

2 0 2 1 3 2

10

3 4 0 0 1 0

11

2 1 2 3 3 1

12

1 3 2 1 0 0

13

2 2 1 1 2 1

14

2 2 0 2 1 0

15

1 2 0 0 2 0

16

2 2 0 2 2 1

17

1 2 2 2 1 1


The participants provided qualitative reports concerning imagery effectiveness (with the exception of Participant 3 and Participant 6, the control group receiving no intervention).

Participant 1
Participant 1 initially received cognitive imagery intervention (Cognitive Imagery First). Participant 1 had demonstrated a 2.9 (SD= 4.5, 3.6, 3.9) throwing performance baseline during the first week of the study; with one exception, each of his throwing performance scores fell above that baseline, ranging from 3.2 (SD= 3.9) to 3.9 (SD= 4.6) (See Table 1). The exception occurred in Session 8, for which the participant’s accuracy score was 1.4 (SD= 1.8). While this score was below the participant’s baseline, it was not beyond the margins of implied change set, for this study, at .9 (See Figure 1).
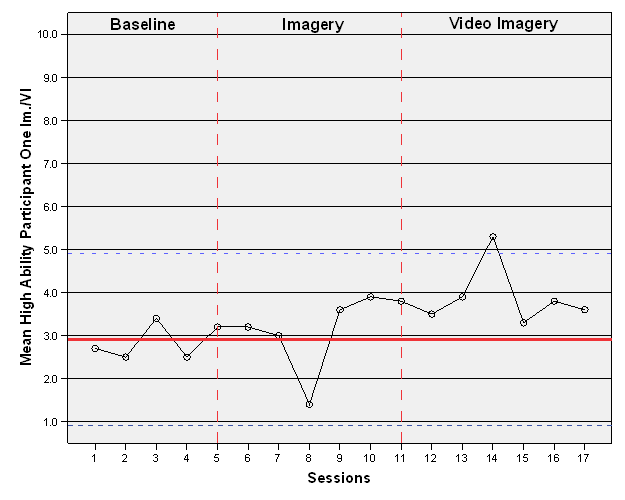
Czech - Figure 1
Figure 1. Participant 1 (high-ability): Accuracy scores (imagery/ video Imagery)

As the participant completed subsequent video imagery interventions, the accuracy scores remained above the baseline, ranging between 3.5 (SD= 3.7) and 5.3 (SD=3.7); throwing performance scores in Session 14 reached 5.3 (SD= 3.7), exceeding the margins of implied change, set at 4.9. During the baseline portion of the study, Participant 1 recorded between 1 and 2 perfect pitches (See Table 2), a rate maintained throughout the study, except during the imagery intervention portion, Sessions 6 through 11. During the imagery intervention portion, this participant’s perfect pitch count ranged from 0 to 3 (see Figure 7).
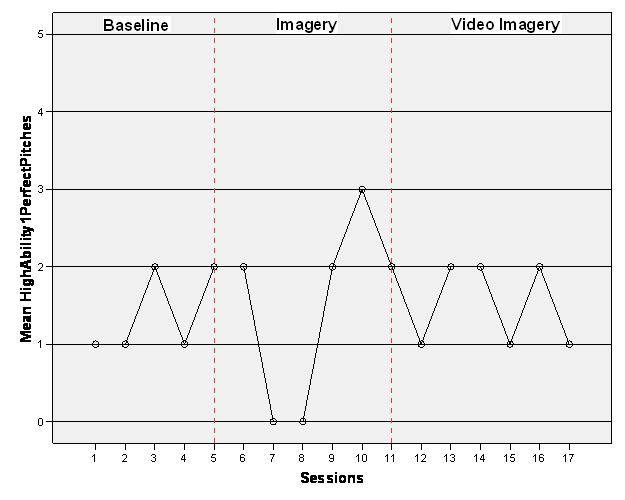
Czech - Figure 7

Figure 7. Participant 1 (high-ability): Perfect pitches thrown
Post Study Imagery Questionnaire
Participant 1, who said he had never used imagery prior to entering this study, reported that he used imagery while playing in a game during the period of the study. He stated, “I would like to continue using imagery and practice it more before games. I feel like it really helps when I start rushing.” Participant 1 further reported that breathing techniques included in the relaxation portion of the imagery script helped him manage momentum and refocus his effort. Participant 1 expressed the opinion that video imagery was relatively more helpful in bringing about desired outcomes, although he found it difficult to mentally re-create accompanying sensations during the video imagery sessions.

Participant 2
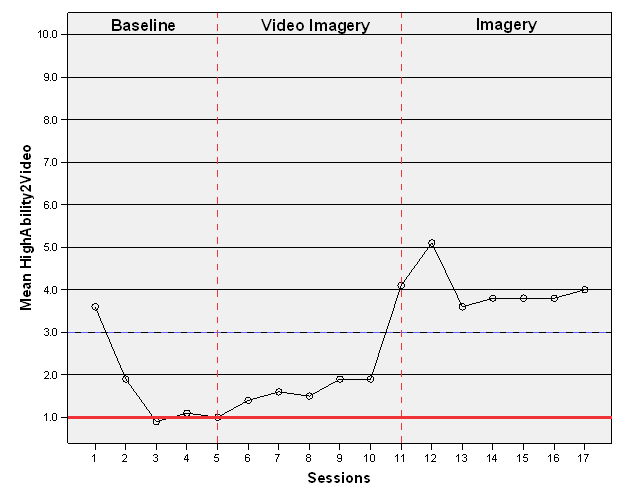
Participant 2 initially received video imagery intervention (Video Imagery First). Participant 2 had established a baseline score of 1.0 (SD= 1.9) within the first week of the study; his throwing performance scores increased slowly during the first intervention, ranging from 1.4 (SD= 2.3) to 4.1(SD= 5.1) (see Table 1). Each of Participant 2’s throwing performance scores fell above the baseline; during Session 11, his score exceeded the established margins of implied change (see Figure 2).
Czech - Figure 2
Figure 2. Participant 2 (high-ability): Accuracy scores (video imagery/ imagery)
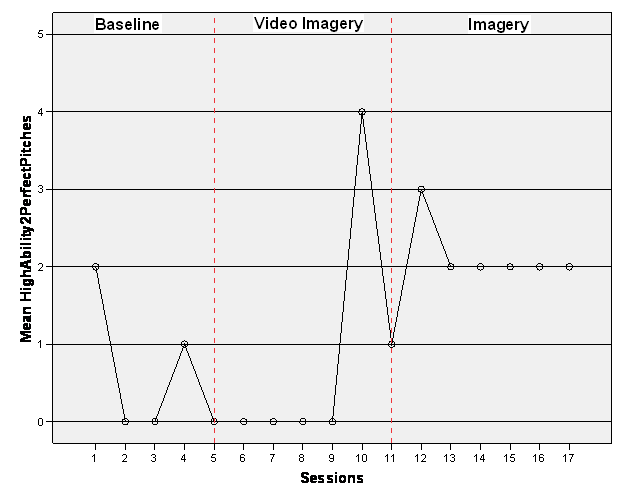
During Session 12 through Session 17 (the imagery intervention), all of Participant 2’s scores remained above the implied margin of change, which was set at 3.0; his scores ranged from 4.0 (SD= 3.7) to 5.1 (SD= 4.1). While establishing a baseline score during Session 2 through Session 5, Participant 2 recorded from 0 to 1 perfect pitch per session (See Table 2). During the video imagery intervention, his perfect pitch count remained at 0 until Session 10, when he threw 4 perfect pitches; in Session 11, he threw 1 perfect pitch. During the imagery intervention, which was his final intervention, Participant 2 threw either 2 or 3 perfect pitches per session (see Figure 8).
Czech - Figure 8

Figure 8. Participant 2 (high-ability): Perfect pitches thrown

Post Study Imagery Questionnaire
Participant 2 reported never having used imagery prior to the study, but said he is currently employing it during games because his pitching performance improved following the start of the study. He stated, “I haven’t walked anybody, it must be working. I started trying to see the ball go where I want it to before I throw the pitch, and it really seems to help.” Moreover, Participant 2 expressed a desire to continue using imagery, for its benefits both to his accuracy and his confidence.

Participant 3
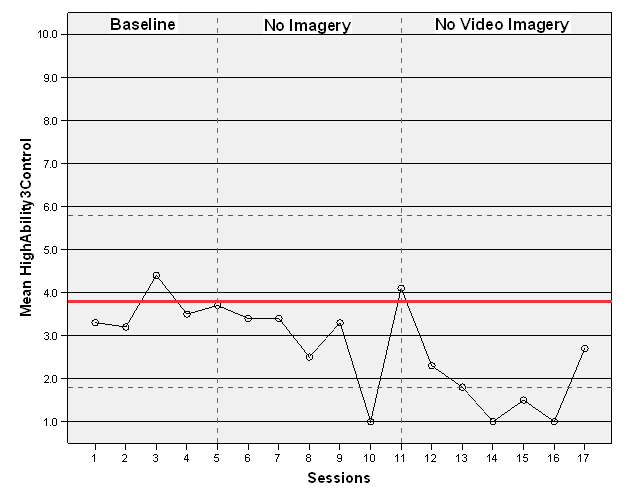
Participant 3 did not participate in any intervention (No Interventions). He had established a baseline score of 3.8 (SD= 3.6) within the first week of the study. During Session 6 through Session 11, his throwing performance scores ranged from 1.0 (SD= 1.9) to 4.1 (SD= 3.9) (see Table 1). All of these scores fell below his baseline score, except the Session 11 score of 4.1 (SD= 3.9). During Session 10, the participant scored 1.0 (SD= 1.9), dropping below the margin of implied change, set at 1.8 (see Figure 3).
Czech - Figure 3
Figure 3. Participant 3 (high-ability): Accuracy scores (control; no intervention)

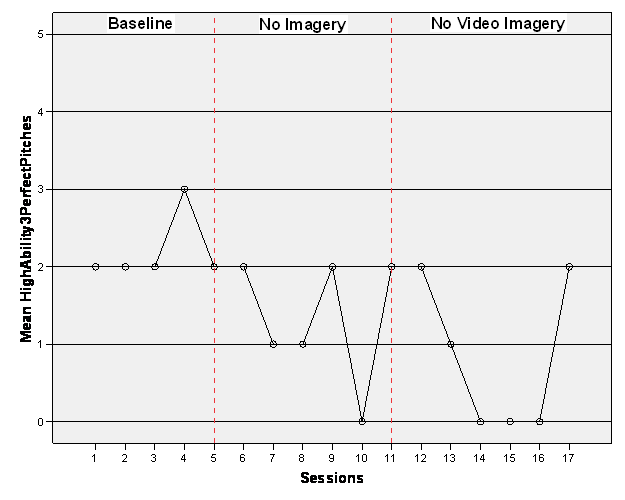
Participant 3’s throwing performance scores in Sessions 12–17 ranged from 1.0 (SD= 1.9) to 2.7 (SD= 4.3), falling below his established baseline. During Session 13 through Session 16, this participant’s scores descended to the level of the margin of implied change. During the baseline portion of the study, Participant 3 threw either 2 or 3 perfect pitches per session. Across the remainder of the study, however (Sessions 6–17), Participant 3 threw 0, 1, or 2 perfect pitches per session (see Figure 9).
Czech - Figure 9

Figure 9. Participant 3 (high-ability): Perfect pitches thrown

Participant 4
Participant 4 received cognitive imagery intervention first (Cognitive Imagery First). Participant 4 had established a baseline score of 4.3 (SD= 3.8) in the first week of the study, and during the first intervention, his throwing performance scores largely fell below that baseline, ranging from 1.8 (SD= 2.4) to 4.5 (SD= 4.7) (see Table 1). Session 11 comprised an exception.

Participant 4’s Session 11 score was 4.5 (SD= 4.7). During Session 7 and Session 8, the participant’s scores were 1.8 (SD= 2.4) and 2.1 (SD= 2.0), respectively, falling below the implied margin of change, which was set at 2.3. During Sessions 12–17, Participant 4 received video imagery intervention. His throwing performance scores for those sessions ranged from 3.3 (SD= 2.4) to 4.5 (SD= 3.5), and most fell below his baseline score, although his scores for Session 16 and Session 17 was 4.5 (SD= 4.1, 3.5) (see Figure 4).
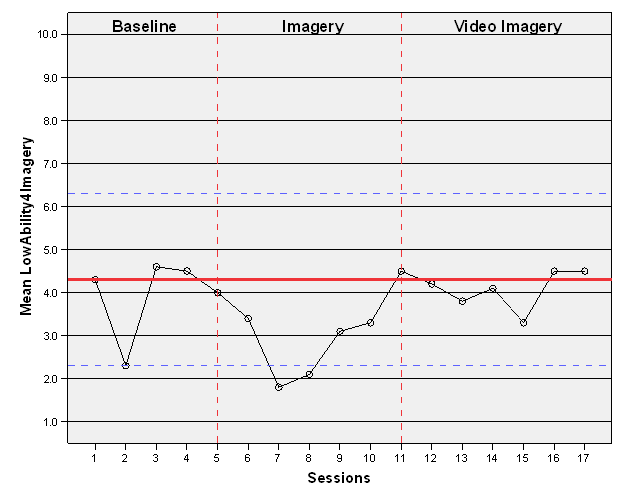
Czech - Figure 4
Figure 4. Participant 4 (low-ability): Accuracy scores (imagery/video imagery)

During the baseline portion of the study, Participant 4 threw between 0 and 2 perfect pitches per session, a range he would go on to maintain for the duration of the study, excepting only Session 11, during which he threw 3 perfect pitches (see Figure 10).
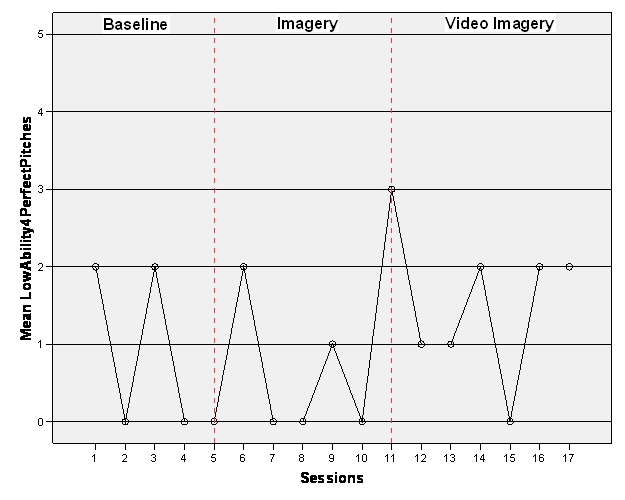
Czech - Figure 10
Figure 10. Participant 4 (low-ability): Perfect pitches thrown

Post Study Imagery Questionnaire
Participant 4 reported that he had used imagery prior to this study; he furthermore reported having difficulty sustaining the vividness of imagery. He went on to express a preference for having a detailed imagery script read to him, due to such reading’s capacity to generate vivid images. Participant 4 stated, “I usually do imagery before my games that I know I’m going to be pitching in. It helps me get focused, and I want to get better at it.” Participant 4 expressed a desire to continue imagery use, but made no note of any distinction between the cognitive and video approaches.

Participant 5
Participant 5 received video imagery intervention first (Video Imagery First). Participant 5 had established a baseline score of .8 (SD= 1.3) in the first week of the study. His throwing performance scores during the first intervention ranged from 1.2 (SD= 3.2) to 4.8 (SD= 4.6), above the baseline score he had produced (see Table 1). In Session 8 and Session 9, Participant 5 recorded scores of 3.3 (SD= 4.7) and 4.8 (SD= 4.6), respectively, exceeding the margin of implied change, which was set at 2.8 (see Figure 5).
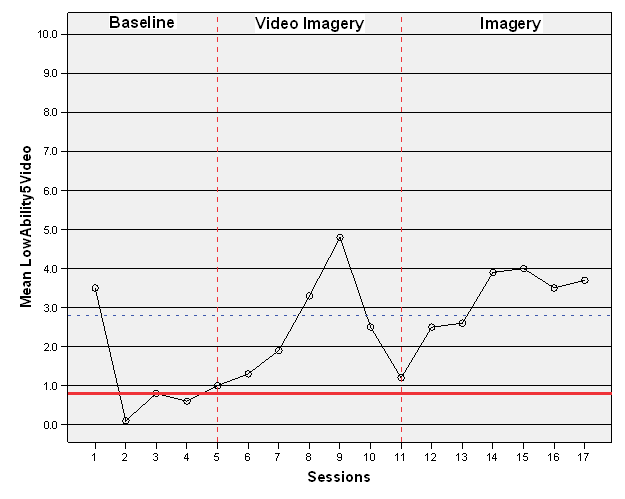
Czech - Figure 5
Figure 5. Participant 5 (low-ability): Accuracy scores (video imagery/ imagery)

During Session 12 through Session 17 (the imagery intervention portion of the study), Participant 5’s throwing performance scores ranged from 2.5 (SD= 4.0) to 4.0 (SD= 4.1). All scores thus fell above his baseline score, and his scores in Sessions 14–17 exceeded the margin of implied change, coming in between 3.5 (SD= 4.6) and 4.0 (SD= 4.1). During the baseline portion of the study, Participant 5 threw 0 perfect pitches. During Session 9 in the video imagery portion of the study, he threw 3 perfect pitches; in Session 10 he threw 1 perfect pitch; in Session 11 he again threw 3. Over Sessions 12–17, the participant threw anywhere from 0 to 2 perfect pitches (the 0 was recorded during Session 12; for each of the next 5 sessions, a 1 or 2 score was recorded; see Figure 11).
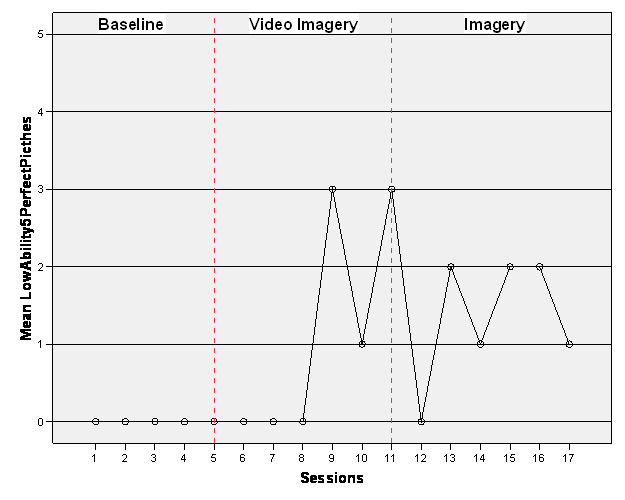
Czech - Figure 11
Figure 11. Participant 5 (low-ability): Perfect pitches thrown

Post Study Imagery Questionnaire
Participant 5 reported never having used imagery prior to the study. He reported considering adherence to use of pre-game imagery following conclusion of the research project. Participant 5 reported noticing not only improved throwing accuracy, but increased self-confidence as well. He stated, “When I stop between each pitch, take a breath and see where I want the ball to go, it helps me to refocus. Also, when I do throw a bad pitch, it doesn’t carry over as much. I don’t get caught in a bad momentum. I am more able to release the last pitch and trust the next one, because I’ve seen myself throw it where I want to put the ball (in my head) many more times before. I know I can do it.”

Participant 6
Participant 6 belonged to the control group (No Intervention) and established a baseline score of 3.4 (SD= 3.1) during the study’s first week. His throwing performance scores ranged from 1.0 to 4.4 over Session 6 though Session 11 (see Table 1). With the exception of a 4.4 (SD= 3.4) throwing performance score in Session 9, Participant 6’s subsequent scores fell below his baseline score. During Session 10, Participant 6 recorded a throwing performance score of 1.0 (SD= 1.9), below the set 1.4 margin of implied change (see Figure 6).
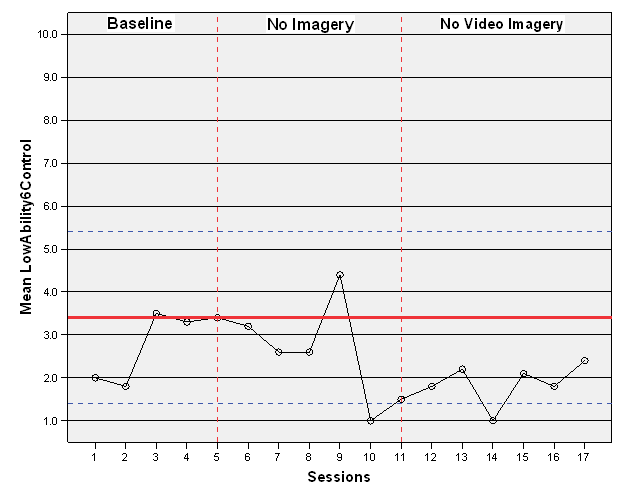
Czech - Figure 6
Figure 6. Participant 6 (low-ability): Accuracy scores (control; no intervention)

Participant 6’s throwing performance scores for Sessions 12–17 were between 1.0 (SD=1.9) and 2.4 (SD= 3.6), all falling below the baseline. Moreover, in Session 14, the participant scored a 1.0 (SD= 1.9), which fell below the margin of implied change. While establishing his baseline score for this study, Participant 6 threw 0 perfect pitches. In Sessions 6–11, he threw from 0 to 2 (in Session 9) perfect pitches per session. For the remainder of the study (Sessions 12–17), he threw 0 to 1 perfect pitch per session (see Figure 12).
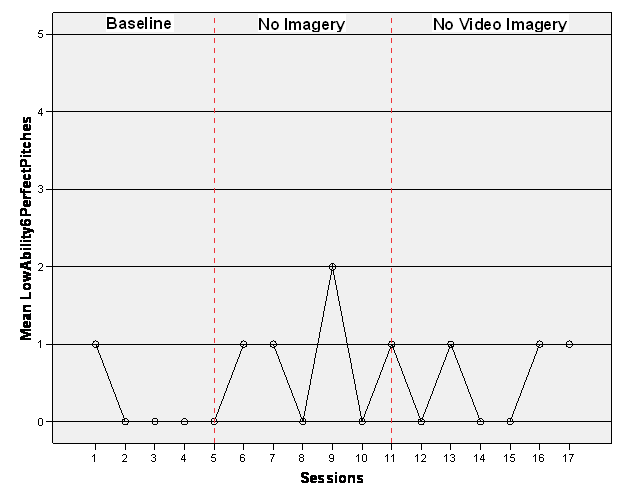
Czech - Figure 12
Figure 12. Participant 6 (low-ability): Perfect pitches thrown

DISCUSSION
The purpose of the present study was to see whether imagery would have an effect on the throwing performance of individual baseball pitchers. Further, the present study sought to determine if individual variation in ability to “image” is associated with distinct responses to cognitive imagery interventions and video imagery interventions. By the end of Session 9, study Participants 1, 2, and 5 demonstrated higher scores (as compared to their individually established baseline scores) for throwing accuracy. This result parallels similar single subject sport-and-imagery research (Kearns & Crossman, 1992; Munroe-Chandler, Hall, Fishurne, Shannon, 2005; Shambrook & Bull, 1996; Templin & Vernacchia, 1993, 1995; Stewart, 1997, Carboni et al., 2000;). There should be further investigation into the effectiveness of brief interventions, because no research to date answers the old question of how frequent and how long intervention must be to produce the desired result (Cumming, Hall, Shambrook, 2007; Thelwell, Greenless, & Weston, 2006). The suggestion has been made that, as in the realm of physical skills, psychological-skills practice effects positive change only after an extensive investment of time (Weinberg & Williams, 2001). Thelwell, Greenless , and Weston (2006) found that combining three types of intervention—imagery, self-talk, and relaxation—produced results within a 3-day period, when 1 day of imagery training was provided and when measures were taken once weekly over a 9-match period. Murphy (1990) recommends intervention sessions of no more than 10 minutes’ duration, and Weinberg and Gould (2007) suggest providing intervention 3 to 5 times a week. Bull (1995) found that positive results ensued from a 4-week training period featuring 8 training sessions. Some researchers have examined intervention frequency and length by leaving participation to the discretion of the participant and recording objective reports; sessions as brief as 1 minute were noted (Carboni et al., 2000). Cumming, Hall, and Shambrook (2007) concluded that overall use of imagery could be increased with interventions as brief as a “workshop.” Findings from the present study indicate that, to be effective for specific tasks such as accurate pitching, imagery interventions can be as brief as 10 minutes in length, conducted 4 times weekly for 3 weeks.

The present study did not find participants to be affected distinctly by the two types of intervention (cognitive and video). The higher throwing performance score recorded for the final 6 sessions of the study are believed to reflect the lengthening period of time during which participants had practiced imagery practice, rather than to the type of intervention, since all participants receiving intervention responded similarly, whether they were in the Cognitive Imagery First group or Video Imagery First group. Gordon, Weinberg, and Jackson (1994) found similar results, investigating “internal” as opposed to “external” imagery. Future research into the effects of multiple interventions should seek to determine the relationship between effectiveness and time invested in each intervention.

Research has shown that imagery ability is a large determinant of how an individual’s physical performance will respond to imagery interventions (Hall, 1998). In the present study, however, scores for Participant 2 and Participant 5 (on both throwing accuracy and perfect pitches) improved more than they did among the other participants. That Participant 2 and Participant 5 succeeded more markedly with imagery use cannot, however, be attributable to higher-ability imagery, because Participant 2 was a high-ability imager while Participant 5 was a low-ability imager. Any individual, regardless of imagery ability, can benefit from imagery practice, although those with lower ability may continue to experience greater difficulty creating and controlling vivid imagery (Magill, 2007). Each high school level participant from the present study had a baseline score for throwing accuracy that was lower than the lowest such score established by a college level participant. Isaac and Marks (1994) and Piaget and Inhelder (1971) concur that imagery ability is developed by age 7. Moreover, Payne and Isaacs (1995) report that the highest level of cognition and abstract thinking develops at age 11–12. Participants 2 and 5 had a mean age of 17, beyond the developmental period and ranking them developmentally equal to the college level participants. The distinct intervention responses of Participants 2 and 5, then, are not due to the basic development of ability to image. Research on imagery use has found differences associated with subjects’ athletic competitive levels (Barr & Hall,1992; Salmon, Hall, & Haslam, 1994; Vadocz et al., 1997). These differences seem to be shaped by factors like years of experience, degree of motivation to play, degree of motivation to use imagery, and ability to create and control images.

Thelwell, Greenless, and Weston (2006) discuss ways in which distinct levels of goal orientation affect players’ levels of investment in imagery use. Research also finds that athletes exhibiting moderate to high levels of task and ego orientation become more invested in imagery use, in turn increasing how often they practice imagery (Cumming, Hall, Gammage, & Harwook, 2002; Harwood, Cumming, & Hall, 2003). Bull (1995) examined the effects of a 4-week mental training program on varsity athletes, finding that better-motivated athletes were likelier to adhere to an imagery program, and that less-seasoned athletes were likelier to be the better motivated. It is possible that Participants 2 and 5 in our study, being at one of the earliest stages of an athletic career, were better motivated than Participants 1, 3, and 4, who were playing what they anticipated would be the final season of their careers.
Motivation can also be affected by fatigue and overtraining. The participants in the present study all were at mid-season, obligated to a vigorous training schedule as well as to the study sessions. At least one point during the study, every participant reported feeling fatigue or exhaustion, and this might have affected their concentration and performance. A perceived imbalance between demands on athletes and their response capabilities sometimes creates the negative physical and emotional state known as burnout (Creswell & Eklund, 2006). As Creswell and Eklund (2006) state, insufficient “rest and recovery periods” will also help generate negative experiences. Participants in the present study might possibly have found that study-related testing and intervention consumed the time they normally would use for recovery and rest, which could account, to some degree, for periodic “off” performance, including uncharacteristically low accuracy scores, trending down of accuracy scores, loss of interest in the study, or transfer of effort from the study to some other task. The performance of Participant 3 and Participant 6 support such an interpretation; these two athletes received no intervention and saw their performance fall off over time. “Burnout” may also help describe the expressed attitudes of Participants 1, 3, 4, and 6.

The study’s timing during the athletes’ season may help explain any shortages of focus or concentration on their part, but additional distractions should also be considered. During video imagery intervention sessions, for example, certain participants showed clear difficulty in focusing when they opened their eyes at the conclusion of the relaxation portion in order to view video. The discrepancy arose even though all of the imagery sessions took place in the university’s Mental Edge Training Facility, where each participant was assured of experiencing interventions of identical length. To better maintain focus and a relaxed state, future research might employ a different viewing method (e.g., use a dark room into which video is introduced from outside or use virtual-reality gear). Furthermore, researchers would be well advised to employ a vivid script that helps participants to incorporate as many types of sensation as possible (Thelwell, Greenless, & Weston, 2006). The script used in the present study instructed participants to “see” only the target’s center box, which perhaps explains in part why Participant 2 and Participant 5 were able to throw more perfect pitches (see Figure 8 and Figure 11).

For the present study, throwing performance was defined as a pitcher’s ability to throw a ball at a specified area deemed the target. In measuring throwing performance, the mean score for the 10 pitching efforts made each session was recorded and graphically represented. Perfect pitches were defined as those hitting the center target, and they too were recorded and graphically represented; a perfect pitch received a score of 10 points.
There are various definitions of what performance enhancement actually is. Some individuals may look for greater consistency, more pitches thrown closer to target, when seeking evidence of performance enhancement. Others may see enhanced performance in a combination of more pitches thrown at the actual target, and lower-scoring pitches. For the present study, the mean score and number of perfect pitches thrown for each session were used to measure performance response. During cognitive imagery interventions, participants were asked to envision throwing only to the center box, while during video imagery interventions, they watched tapings of pitches thrown to the center box. An increase in pitches to the center box was, for this reason, said to indicate imagery intervention’s positive effects on throwing performance.

Two limitations on the present study resulted from the data collection process. First, during the intervention sessions, participants were exposed to extraneous noise, although none directly identified this as a distraction. In future studies, areas free of extraneous noise should be employed. Second, when a participant was unable to join in throwing performance measurement or imagery intervention session during daylight hours, the researchers accommodated his schedules by conducting these activities after dark, an inconsistency which, by potentially affecting vision, perhaps also affected success. Furthermore, time of day bears on the level of concentration and fatigue.
Results obtained through the Post Study Imagery Questionnaire describe perceived positive effects imagery wields on athlete performance and confidence. This questionnaire also documents that participants’ appreciation for psychological skills training grew during the study. These findings parallel past research (Carboni et al., 2000; Kearns & Crossman, 1992; Shambrook & Bull, 1996; Templin & Vernacchia, 1993, 1995; Stewart, 1997; Thelwell et al., 2006). Participants 1, 2, and 5 expressed an outlook positive toward the imagery sessions, toward their own confidence concerning tasks, and toward anxiety-reducing effects of mentally re-creating a pitching sequence. This supports numerous findings about imagery’s possible benefits, for example improved self-confidence (Callow, Hardy, & Hall, 2001), better motivation (Callow & Hardy, 2001), improved regulation of arousal (Hecker & Kaczor, 1988), and stronger ability to modify such cognitions as self-efficacy (Feltz & Ressinger, 1990). Imagery, or mental practice, can, the research record demonstrates, be used to control anxiety and to enhance both the strategies and physical movements that will be employed in performing a skill (Magill, 2007).

Suggestions for future research include, again, the deployment of alternative methods of presenting video imagery intervention, to ensure participants’ focus is maintained. In addition, future research should examine how often and for how long interventions are best administered, in terms of performance enhancement.

The baselines established by this study’s participants did not vary more than 1 point, although the criterion we employed for defining baseline and actual change was 2 points (on a 10-point scale). Perhaps future research would benefit from more strict criteria, which would tend to identify more pronounced effects.

Psychological skills training, coaches and athletes often fear, entails a long-term commitment and many field practice hours lost. The present findings, however, imply that imagery training’s effects on at least the one position-specific task studied are observable in as little as twelve 10-minute sessions (4 per week for 3 weeks). Moreover, the study demonstrates that effective intervention may take place during the competetive season and in conjunction with rigorous physical training.

Bull (1991) identified three barriers between athletes and ongoing psychological skills training: time constraints, a disruptive home environment, and an unmet need for individually tailored training. The position-specific intervention employed in this study, together with use of a brief script, alleviate all three problems. Later, in a discussion of how best to implement psychological skills training, Shambrook and Bull (1999) emphasized the importance of time management, of structure, and of integration of psychological skills within existing training. The present study’s findings, past research focusing on workshops (Cummings, Hall, & Shambrook, 2007), and future research will complete the path around the barriers, driving home that intervention programs may be both brief and integrated within established physical training in order to reap positive returns.

Please address all correspondence to:

Dr. Daniel R. Czech, CC-AAASP

Department of Health and Kinesiology
Box 8076

Georgia Southern University

Statesboro, GA 30460-8076

Telephone (912) 681-5267

E-mail drczech@georgiasouthern.edu

REFERENCES
Albinson, J. G., & Bull, S. J. (1988). The mental game plan. London, Ontario, Canada: Spodym.

Betts, G. H. (1909). The distributions and functions of mental imagery. New York: Teachers College Columbia University.

Bryan, A. J. (1987). Single-subject designs for evaluation of sport psychology interventions. The Sport Psychologist,1, 283–292.
Bull, S. J. (1991). Personal and situational influences on adherence to mental skills training. Journal of Sport and Exercise Psychology, 13, 121–132.
Callow, N., & Hardy, L. (2001). Types of imagery associated with sport confidence in netball players of varying skill levels. Journal of Applied Sport Psychology, 13, 1–17.
Callow, N., Hardy, L., & Hall, C. (2001). The effects of a motivational general-mastery imagery intervention on the sport confidence of high-level badminton players. Research Quarterly for Exercise and Sport, 72, 389–400.

Camels, C., Holmes, P., Berthoumeius, C., Paris, F., & Singer, R. (2004). The development of movement imagery vividness through a structured intervention in softball. Journal of Sport Behavior, 27, 307–322.

Carboni, J., Burke, K., Joyner, A. B., Hardy, C. J., & Blom, L. C. (2000). The effects of brief imagery on free throw shooting performance and concentration style of intercollegiate basketball players: A single subject design. International Sports Journal, 6, 60–68.

Carpenter, W. B. (1894). Principles of mental physiology. New York: Appleton.

Corbin, C. B. (1972). Mental practice. In W. P. Morgan (Ed.), Ergogenic Aids and Muscular Performance (pp 93-118). New York: Academic.

Creswell, S. & Eklund, R. (2007). The nature of player burnout in rugby: Key characteristics and attributions. Journal of Applied Sport Psychology, 18, 219, 232

Cumming, J., & Hall, C. (2002a). Deliberate imagery practice: Examining the development of imagery skills in competitive athletes. Journal of Sport Sciences, 20, 137–145.
Cumming, J., & Hall, C. (2002b). Athletes’ use of imagery in the off-season. The Sport Psychologist, 16, 160–172.

Cumming, J., Hall, C., Harwood, C. G., & Gammage, K. (2002). Motivational orientations and imagery use: A goal profiling analysis. Journal of Sport Sciences, 20, 127–136.

Cumming, J., Hall, C., & Shambrook, C. (2007). The influence of an imagery workshop on athletes’ use of imagery. Athletic Insight: Online Journal of Sport Psychology,6, 1.

Driskell, J. E., Copper, C., & Moran, A. (1994). Does mental practice enhance performance? A meta-analysis. Journal of Applied Psychology, 79, 481–492.

Feltz, D. L., & Riessinger, C. A. (1990). Effects of in vivo imagery and performance feedback on self-efficacy and muscular endurance. Journal of Sport and Exercise Psychology, 12, 132–143.

Gordon, S., Jackson, A., & Weinberg, R. (1994). Effect of internal imagery on cricket performance. Journal of Sport Behavior, 17.

Goss, S., Hall, C. R., Buckolz, E., & Fishbourne, G. J. (1986). Imagery ability and the acquisition and retention of movements. Memory and Cognition, 14, 469–477.

Gould, D., Dieffenbach, K., & Moffett, A. (2002). Psychological characteristics and their development in Olympic champions. Journal of Applied Sport Psychology, 14, 172–204.

Gould, D., Petlichkoff, L., Hodge, K., & Simons, J. (1990). Evaluating the effectiveness of a psychological skills educational workshop. The Sport Psychologist, 4, 249–260.

Hale, B. D. (1982). The effects of internal and external imagery on muscular and ocular concomitants. Journal of Sport Psychology, 4, 379–387.

Hall, C. (1998). Measuring imagery abilities and imagery use. In J. Duda (Ed.), Advances in sport and exercise psychology measurement (pp. 165–172). Morgantown, WV: Fitness Information Technology.
Hall, C. (2001). Imagery in sport and exercise. In R. Singer, H. Hausenblas, & C. Janelle (Eds.), Handbook of Sport Psychology (pp. 529–549). New York: John Wiley & Sons.

Hall, E. G., & Erffmeyer, E. S. (1983). The effect of visuo-motor behavior rehearsal with videotaped modeling on free throw accuracy of intercollegiate female basketball players. Journal of Sport Psychology, 5, 343–346.

Hall, C. R., Pongrac, J., & Buckholz, E. (1985). The measurement of imagery ability. Human Movement Science, 4, 107–118.

Hall, C. R., & Pongrac, J. (1983). Movement imagery questionnaire. London, Ontario, Canada: University of Western Ontario, Faculty of Physical Education.

Hecker, J. E., & Kaczor, L. M. (1988). Application of imagery theory to sport psychology: Some preliminary findings. Journal of Sport and Exercise Psychology, 10, 363–373.

Isaac, A. R., & Marks, D. F. (1994). Individual differences in mental imagery experience: Developmental changes and specialization. British Journal of Psychology, 85, 479–500.

Kearns, D. W., & Crossman, J. (1992). Effects of a cognitive intervention package on the free-throw performance of varsity basketball players during practice and competition. Perceptual and Motor Skills, 75, 1243–1253.

Magill, R.A. (2007). Motor learning and control: Concepts and applications. New York: McGraw-Hill

Moritz, S. E., Hall, C., Martin, K. A., & Vadocz, E. (1996). What are confident athletes imaging? An examination of image content. The Sport Psychologist, 10, 171–179.

Munroe, K. J., Giacobbi, P. R., Hall, C., & Weinberg, R. (2000). The four Ws of imagery use: Where, when, why, and what. The Sport Psychologist, 14, 119–137.

Murphy. S., Jowdy, D., & Durtschi, S. (1990). Report on the U. S. Olympic Committee survey on imagery use in sport. In R. Weinberg & D. Gould (Eds.), Foundations of Sport & Exercise Psychology (p. 293). Champaign, IL: Human Kinetics.

Orlick, T. (1990). In pursuit of excellence: How to win in sport and life through mental training. Champaign, IL: Human Kinetics.

Paivio, A. (1985). Cognitive and motivational functions of imagery in human performance. Canadian Journal of Applied Sports Sciences, 10, 22S–28S.

Payne, V. G., & Isaacs, L. D. (1995). Human motor development: A lifespan approach (3rd ed.). Mountain View, CA: Mayfield.

Piaget, J., & Inhelder, B. (1971). Mental imagery in the child. New York: Basic Books.

Salmon, J., Hall, C., & Haslam, I. (1994). The use of imagery by soccer players. Journal of Applied Sport Psychology, 6(1), 116–133.

Shambrook, C. J., & Bull, S. J. (1996). The use of a single-case research design to investigate the efficacy of imagery training. Journal of Applied Sport Psychology, 8, 27–43.

Shambrook, C., & Bull, (1999). Adherence to psychological preparation in sport. In S. J. Bull (Ed.), Adherence issues in sport and exercise (pp. 169–196). New York: John Wiley & Sons.

Shiffman, H. R. (1995). The skin, body and chemical senses. In R. L. Gregory & A. M. Colman (Eds.), Sensation and Perception (pp. 70–96). London: Longman.

Stewart, G. R. (1997). A single subject design to study the effects of a mental imagery intervention on basketball free-throw performance. Tesis de Master: Queen’s University

Stroksahl, K., & Ascough, J. C. (1981). A multiple component of clinical imagery. In E. Klinger (Ed.), Imagery: Concepts, results and applications (pp. 259–274). New York: Plenum.

Templin, D. P., & Vernacchia, R. A. (1995). The effect of highlight music videotapes upon the game performance of intercollegiate basketball players. The Sport Psychologist, 9, 41–50.

Thelwell, R., Greenless, I., & Weston, N. (2007). Using psychological skills training to develop soccer performance. Journal of Applied Sport Psychology,18, 254.

Vadocz, E., Hall, C., & Moritz, S. (1997). The relationship between competitive anxiety and imagery use. Journal of Applied Sport Psychology, 9, 241–253.

Vealey, R. S., & Walter, S. M. (1993). Imagery training for performance enhancement and personal development. In J. M. Williams (Ed.), Applied sport psychology: Personal growth to peak performance (pp. 200–223). Mountain View, CA: Mayfield.

Vealey, R. S., & Greenleaf, C. A. (2001). Seeing is believing: Understanding and using imagery in sport. In J. M. Williams (Ed.), Applied sport psychology: Personal growth to peak performance (4th ed.). Mountain View, CA: Mayfield.

Weinberg, R. S., & Williams, J. M. (2001). Integrating and implementing a psychological skills training program. In J. M. Williams (Ed.), Applied sport psychology: Personal growth to peak performance (4th ed.), pp. 347–377). Mountain View, CA: Mayfield.

2016-10-12T11:39:39-05:00January 7th, 2008|Sports Coaching, Sports Exercise Science, Sports Studies and Sports Psychology|Comments Off on The Effects of Video and Cognitive Imagery on Throwing Performance of Baseball Pitchers: A Single Subject Design

Quality Control Procedure for Kinematic Analysis of Elite Seated Shot-Putters During World-Class Events

ABSTRACT
Kinematic analyses of elite shot-put throwers commonly involve shot-trajectory parameters determined under experimental conditions with an accuracy-based procedure. This can be only partially implemented within an event-constrained procedure (as opposed to experimental conditions). Event-constrained procedures, while they provide realistic information collected in an open environment, introduce several constraints that can potentially compromise accuracy measures. This study concerns a quality control procedure intended to address such constraints. The quality control procedure relies on 5 key elements aimed at reducing and reporting error and validating measures of the shot trajectory. The performance of 7 world-class shot-putters during international events was calculated using video data recorded at 50 Hz with a camera located to the side of the athlete. Accuracy was above 75% for all the attempts and above 94% during 4 attempts. This study demonstrated (a) the need to systematically implement this procedure for kinematic analyses based on event-driven recordings; (b) the value of quality indicators in making decisions concerning the instant of release; and (c) the importance of reporting this procedure’s outcomes in terms of error and percentage error.

INTRODUCTION
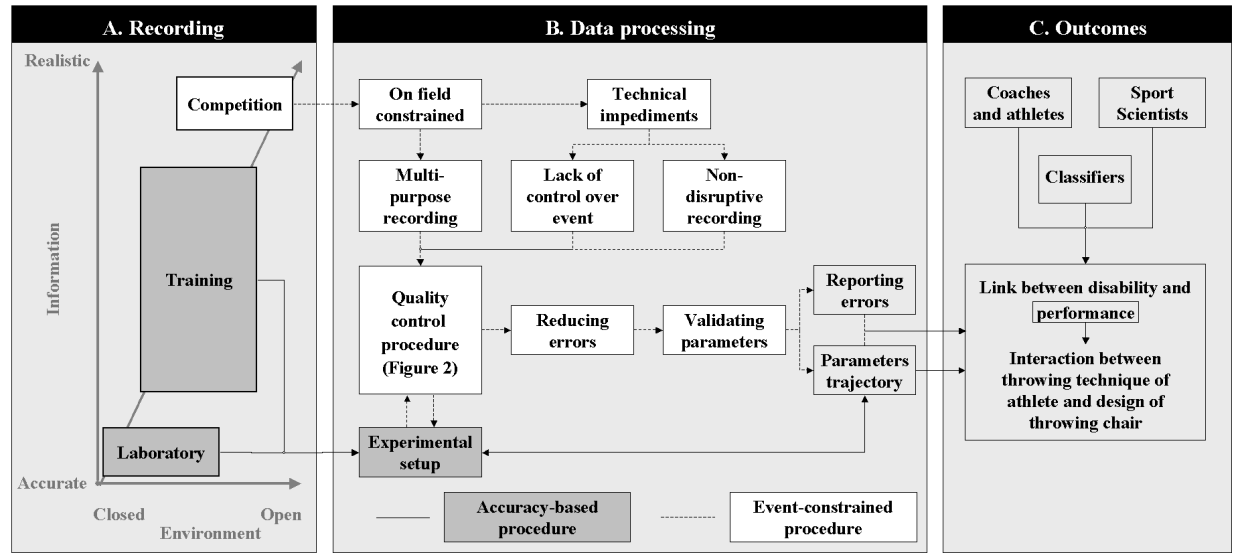
The performance of world elites in the shot put, measured as the distance the shot is thrown, results from the interaction between throwing technique and the design of the throwing chairs (O’Riordan & Frossard, 2006). That interaction shapes the parameters of the shot trajectory, which depends on the position, the velocity, and the angle of the shot at the instant of release ( Ariel, 1979; Dessureault, 1978; Chow, Chae, & Crawford, 2000; Linthome, 2001; Lichtenburg & Wills, 1978; McCoy, Gregor, Whiting, & Rich, 1984; Sušanka & Štepánek, 1988; Tsirakos, Bartlett, & Kollias, 1995; Zatsiorsky, Lanka, & Shalmanov, 1981). Sport scientists, classifiers, coaches, and athletes use the parameters of the shot trajectory to better understand the link between disability and performance (Higgs, Babstock, Buck, Parsons, & Brewer, 1990; McCann, 1993; Vanlandewijck & Chappel, 1996; Williamson, 1997; Chow & Mindock, 1999; Chow et al., 2000; Laveborn, 2000; Tweedy, 2002). Video recording allows for estimation of parameters, using primarily an accuracy-based procedure or event-constrained procedure, as illustrated in Figure 1.

Kinematic Analysis - Figure 1
Figure 1. Overview of the video recording (A), the data processing (B) and the outcomes (C) of the parameters of the shot’s trajectory of elite seated shot-putters. The parameters determined using an accuracy-based procedure rely on data collected during training and in laboratory,which presents the advantage of accommodating the typical experimental requirements but it provides only partially realistic information regarding the performance. The event-constrained procedure provides realistic information collected in the open environment presenting several constraints. Thus, a quality control is needed to reduce, validate, and report the errors. This will ensure that sport scientists, classifiers, coaches, and athletes have a better appreciation of the limitations of the data presented about the performance.

Accuracy-based procedure

Video recordings made during training or as part of laboratory motion analysis, whether for routine observation or for research, must accommodate typical experimental requirements for three-dimensional reconstruction, including suitable calibration volume, appropriate number of cameras, precise positioning of cameras, use of active or passive markers, and an unrestricted number of attempts. A flexible set-up of this sort enables an experimental approach employing trial and error, wherein quality control is achieved through repeat recording until the desired kinematic parameters (i.e., shot trajectories) are satisfactorily accurate. The accuracy and validity of parameters reported in research may be taken for granted, even though authors seldom report key indicators like number of frames tracked after release, or calculation of performance using parameters or using tape measure, or the difference between these two performances (Chow & Mindock, 1999; Chow et al., 2000).

Unfortunately, trajectory information obtained from non-competitive environments only partially represents the throwing technique an athlete uses while competing. Participants in a study by Chow et al. (2000) performed, on average, 15±9% below their personal best, leading the researchers to conclude that, in order to develop a data base of ideal performance characteristics, numerous quantitative data needed to be obtained, particularly those collected during leading competitions.
Event-constrained procedure

Video recordings of elite shot-putters’ throwing techniques were made on the field of play during the 2000 Paralympic Games, 2002 International Paralympic Committee World Championships, and select Australian national events (Frossard, O’Riordan, & Goodman, 2005; Frossard, O’Riordan, Goodman, & Smeathers, 2005; Frossard, Schramm, & Goodman, July 2003; O’Riordan, Goodman, & Frossard, 2004). Recording in these open environments entailed certain constraints (Frossard, O’Riordan, Goodman, & Smeathers, 2005; Frossard, Stolp, & Andrews, 2006), presented in Figure 1. Multi-purpose recording becomes necessary for capitalizing on an event’s uniqueness and for securing the distinct kinematic data sets of interest to distinct parties. Classifiers, for instance, may be interested in assessing the full range of upper-body movement (Chow et al., 2000; Tweedy, 2002). Engineers, in turn, may seek to study the deformation of the pole. Coaches’ main interest may be something as specific as hip-movement pathways during forward thrusting, or the exact position of the feet (O’Riordan, Goodman, & Frossard, 2004). Finally, the biomechanist’s interest may well be the parameters of the shot trajectory (Chow et al., 2000). Under experimental conditions, optimal accuracy often results from a focus on one data set at a time, that set obtained using optimal field of view and calibration volume. During competitive events, a compromise must be made as all parameters are observed using a single field of view. Furthermore, various technical barriers are presented on the playing field, including lack of control over the event and inevitable need to make recordings in a non-disruptive fashion. There is, in short, a one-off chance to record any attempt, with space only for one to two cameras, and despite likely obstructions of the field of view by equipment, referees, officials, TV crew, or the like.

Such constraints can be assumed to affect the accuracy of the kinematic data. Even the implementation of an accuracy-based approach within an event-constrained procedure will only partially guarantee sufficient accuracy. Nevertheless, a formal quality control procedure limited to determining shot trajectory parameters and occurring after the video recording stage could offer help to achieve highest possible accuracy.

PURPOSE

The authors’ ultimate aim is to propose a quality control procedure able to reduce error in the measurement of shot trajectory parameters and validate measured parameters, as well as to refine and standardize the format used to report measurement error. The proposed procedure relies on five key quality indicators that should influence decisions about when the moment of release occurs. The paper also has four secondary purposes. First, it comprises a detailed example of the entire procedure as it was deployed with the Class F55 male athlete who won the gold medal at the 2002 International Paralympic Committee (IPC) World Championships. Second, it tracks the procedure’s outcomes in terms of 7 elite shot-putters participating in 2 world-class events. Third, it presents possible sources of error inherent in the proposed videotaping setup. Fourth, it makes several recommendations for future on-field studies.

METHODS

Events
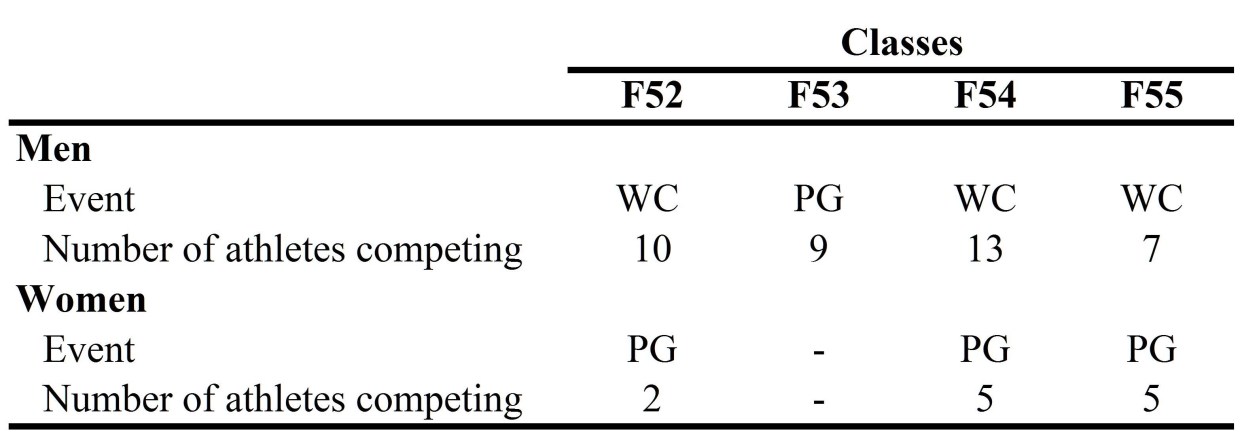
Video recordings were made during two world-class events, the 2000 Paralympic Games held in Sydney, Australia (4 classes of competition), and the 2002 IPC World Championships held in Lille, France (3 classes of competition), as indicated in Table 1.

Table 1
Event and total number of athletes competing in each class included in this study (PG: Sydney 2000 Paralympic Games, WC: Lille 2002 International Paralympic Committee World Championships).
Kinematic Analysis - Table 2
Participants
A total of 51 shot-putters were part of the present study, including 39 males and 12 females. For the competitions, each athlete had been classified according to the latest International Stoke Mandeville Wheelchair Sports Federation classification system (Laveborn, 2000). Table 1 illustrates total numbers of these athletes competing in each class, although the present analysis was limited to those who became gold medalists in four select classes (F52, F53, F54, and F55). Though not all-inclusive, the sample was deemed sufficient for illustrating the principles of the quality control procedure. (Gold medalists also typically generate greatest interest among sport scientists, coaches, and athletes.) Female athletes assigned to the F52 and F54 classes had competed jointly at the Sydney Paralympic Games, due to the small numbers of athletes in these classes, and a single gold medal was awarded. For our research, however, the performance of the event’s top competitor in each of these classes was considered. The female Class F53 shot-put event was canceled for lack of athletes.

Data processing

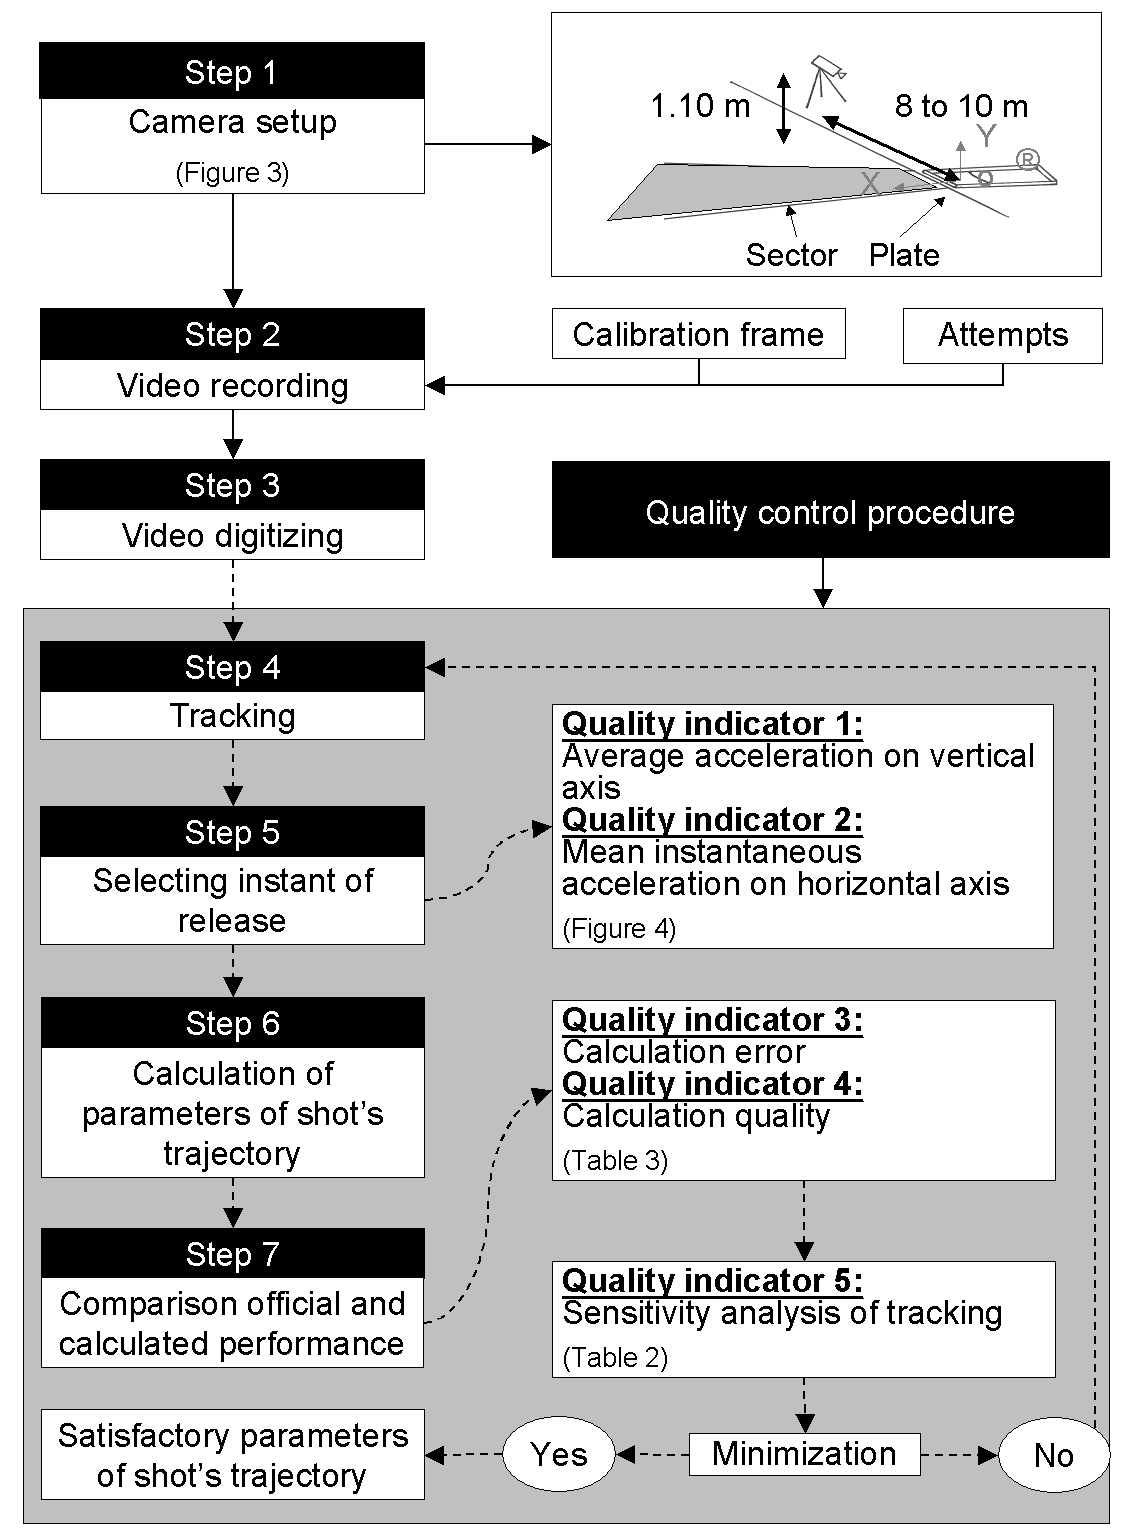
The sequence of the following 7 key steps used to process video data is shown in Figure 2.

Kinematic Analysis - Figure 2
Figure 2. Seven key steps of data processing, including the quality control procedure and the five associated quality indicators.

Step 1: Camera set-up

Frossard, Stolp, and Andrews (2003) have previously provided a thorough guide to the practical aspects of video camera set-up during world-class events. Therefore, this paper will limit itself to key elements of that set-up. During the 2 events included in this study, each put was recorded using 1 digital video camera (SONY Digital Handycam DCR-TRV15E), set at a sampling rate of 25 Hz. A “household” camera was chosen because it was affordable, discreet, and readily available. High-resolution cameras, by contrast, require exacting lighting conditions and are expensive and fragile. Some video cameras commercially available at the time of the events would have allowed high-speed filming, but at the cost of compromised resolution.
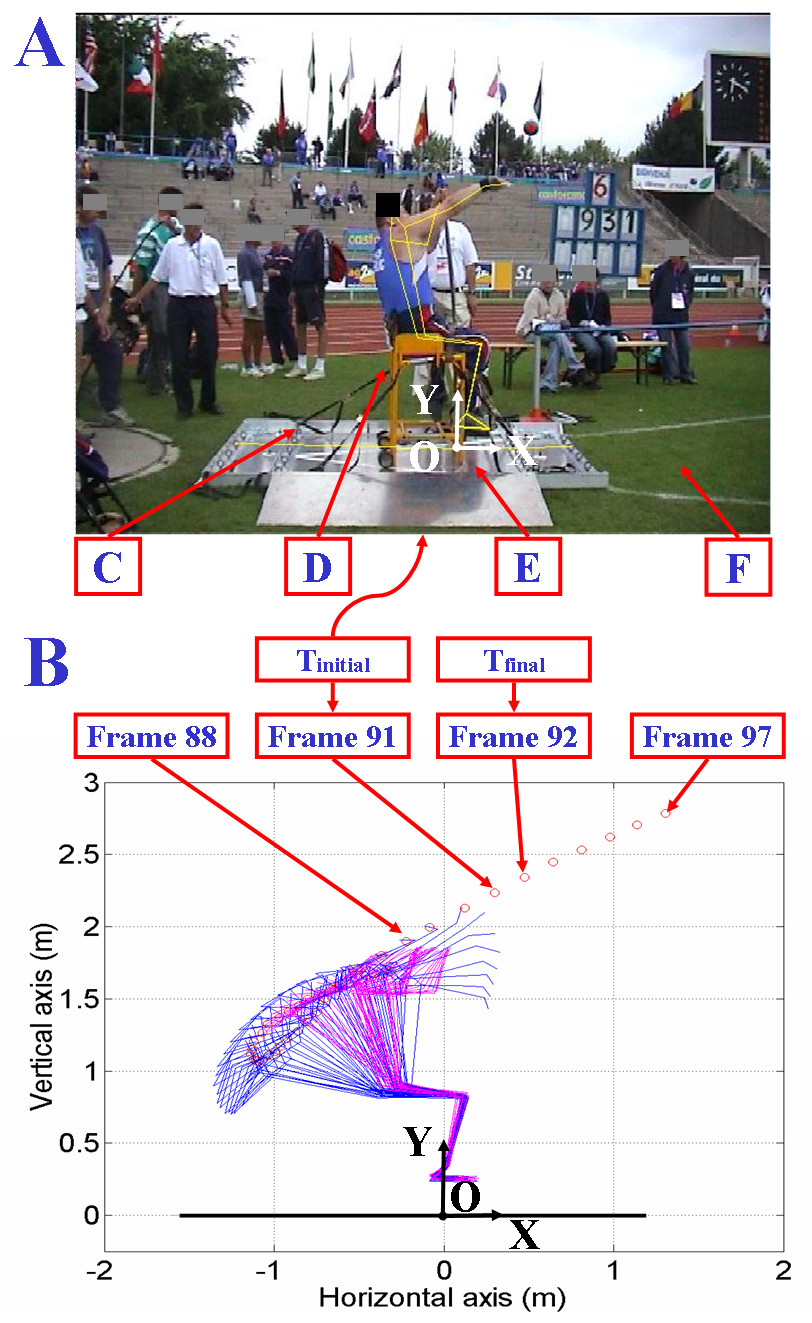
The SONY camera was placed approximately 1.1 m high at a distance between 8.0 m and 10.0 m, perpendicular to the length of the plate. The angle between the optical axis of the camera and the ground was approximately 90 degrees. The field of view included the full length (2.29 m) and full width (1.68 m) of the plate on the ground. The field of view was furthermore enlarged in the direction of the put, to ensure the recording of at least the first 5 frames of the shot’s aerial trajectory (see Figure 3A). Under experimental conditions, this field of view can be obtained by zooming to reduce the perspective error once the camera is positioned with respect to the plate. In this study, the camera was placed relatively close to the plate in an effort to lessen the possibility of intrusion into the field of view by equipment, referees, or TV crews. Nevertheless, the zoom was occasionally used. This camera position resulted in a pixel resolution ranging from 0.95 cm to 1.85 cm, depending on the camera’s position and the zoom setting.

Kinematic Analysis - Figure 3

Figure 3.Example of male gold medallist in the class F55 participating in the shot-put event of the 2002 IPC World Championships seated in the throwing frame (D) attached to a plate (E) using ties (C) that is facing the sector (F). Figure A provides an example of field of view of the camera with the body’s segments’ position and the shot at the instant of release (Tfinal – Frame 91). Figure B represents a stick figure of the athlete with the key instants needed to determine the parameters of the shot’s trajectory in the Global Coordinate System (GCS[O, X, Y]).

Step 2: Video recording
A total of 387 attempts, corresponding to nearly every one of the attempts made by each athlete in each class, were recorded and stored on MiniDVs. The duration of the video recording of each attempt was approximately 7 seconds. An attempt began when the referee handed the shot to the athlete and ended shortly after the shot landed on the ground. A customized calibration frame (2 m length x 1.5 m height x 1 m width) containing 43 control points placed on top of the plate was recorded at the beginning and at the end of each event.

Step 3: Video digitizing
The video recording of the calibration frame and of the best attempt in each class (the gold-medal throw) was digitized at 50 Hz using Digitiser 5.0.3.0 software, manufactured by SiliconCOACH Ltd. This sampling rate was achieved by de-interlacing the initial video frames, which affected accuracy only on the horizontal axis.

Step 4: Tracking
The Digitiser software was used to track, frame-by-frame, the center of the shot, the distal end of the middle finger, the position of the wrist, and the origin of the two-dimensional Global Coordinate System (GCS[O, X, Y]). The latter corresponded to the middle of the line of reference located in the front and at the bottom of the throwing frame, used by the referee to measure the performance, as illustrated in Figure 3. The tracking started with the back thrust and ended when the put was no longer within the field of view, which included 5 frames or more after the estimated moment of release. Tracking of the full body was obtained only for the male Class F55 gold medalist (see Figure 3B).
Step 5: Selecting instant of release
The 2 coordinates of the points tracked were imported into a customized Matlab software program (Math Works, Inc.). An operator used the software to select a combination of 2 positions of the shot, allowing calculation of the parameters of the shot’s trajectory (also see Step 6, below). The first position, (Tinitial), corresponding to the instant of release, was indicated by separation between the finger and the shot of a distance larger than the shot’s diameter. The second position, (Tfinal), corresponded to one of the 3 consecutive frames. The two-dimensional coordinates of the displacement were not smoothed or filtered to avoid end point distortions of the limited number of samples after the moment of release.
Step 6: Calculation of parameters of shot trajectory

The Matlab software implemented the classic equations from the literature (Lichtenburg & Wills, 1978; Linthome, 2001) for calculating the trajectory of the shot, allowing the landing distance to be estimated. The performance calculation was determined from the parameters of the shot at the instant of release, including (a) resultant horizontal and vertical components of the translational velocity; (b) resultant horizontal (advancement) and vertical (height) components of the position; and (c) the angle of the trajectory. The performance calculation was also corrected by the radius of the shot, as the official performance was measured from the landing mark on the ground closest to the Global Coordinate System.
Step 7: Comparison of official and measured performance

The performance calculation was compared with the official performance, which was the distance measured by the referee during the event; calculation error indicators and calculation quality indicators were employed as described below. The official performance measure was taken as the value of reference.

Quality control procedure

The quality control procedure relied on two efforts aimed at reducing and reporting error and validating measures of the shot trajectory, as presented in Figure 2. The first included the digitizing of the displacements of the shot and the operator’s subsequent selection of the best combination of Tinitial and Tfinal . Feedback on the quality of the selection was obtained from the 5 key quality indicators, as follows:

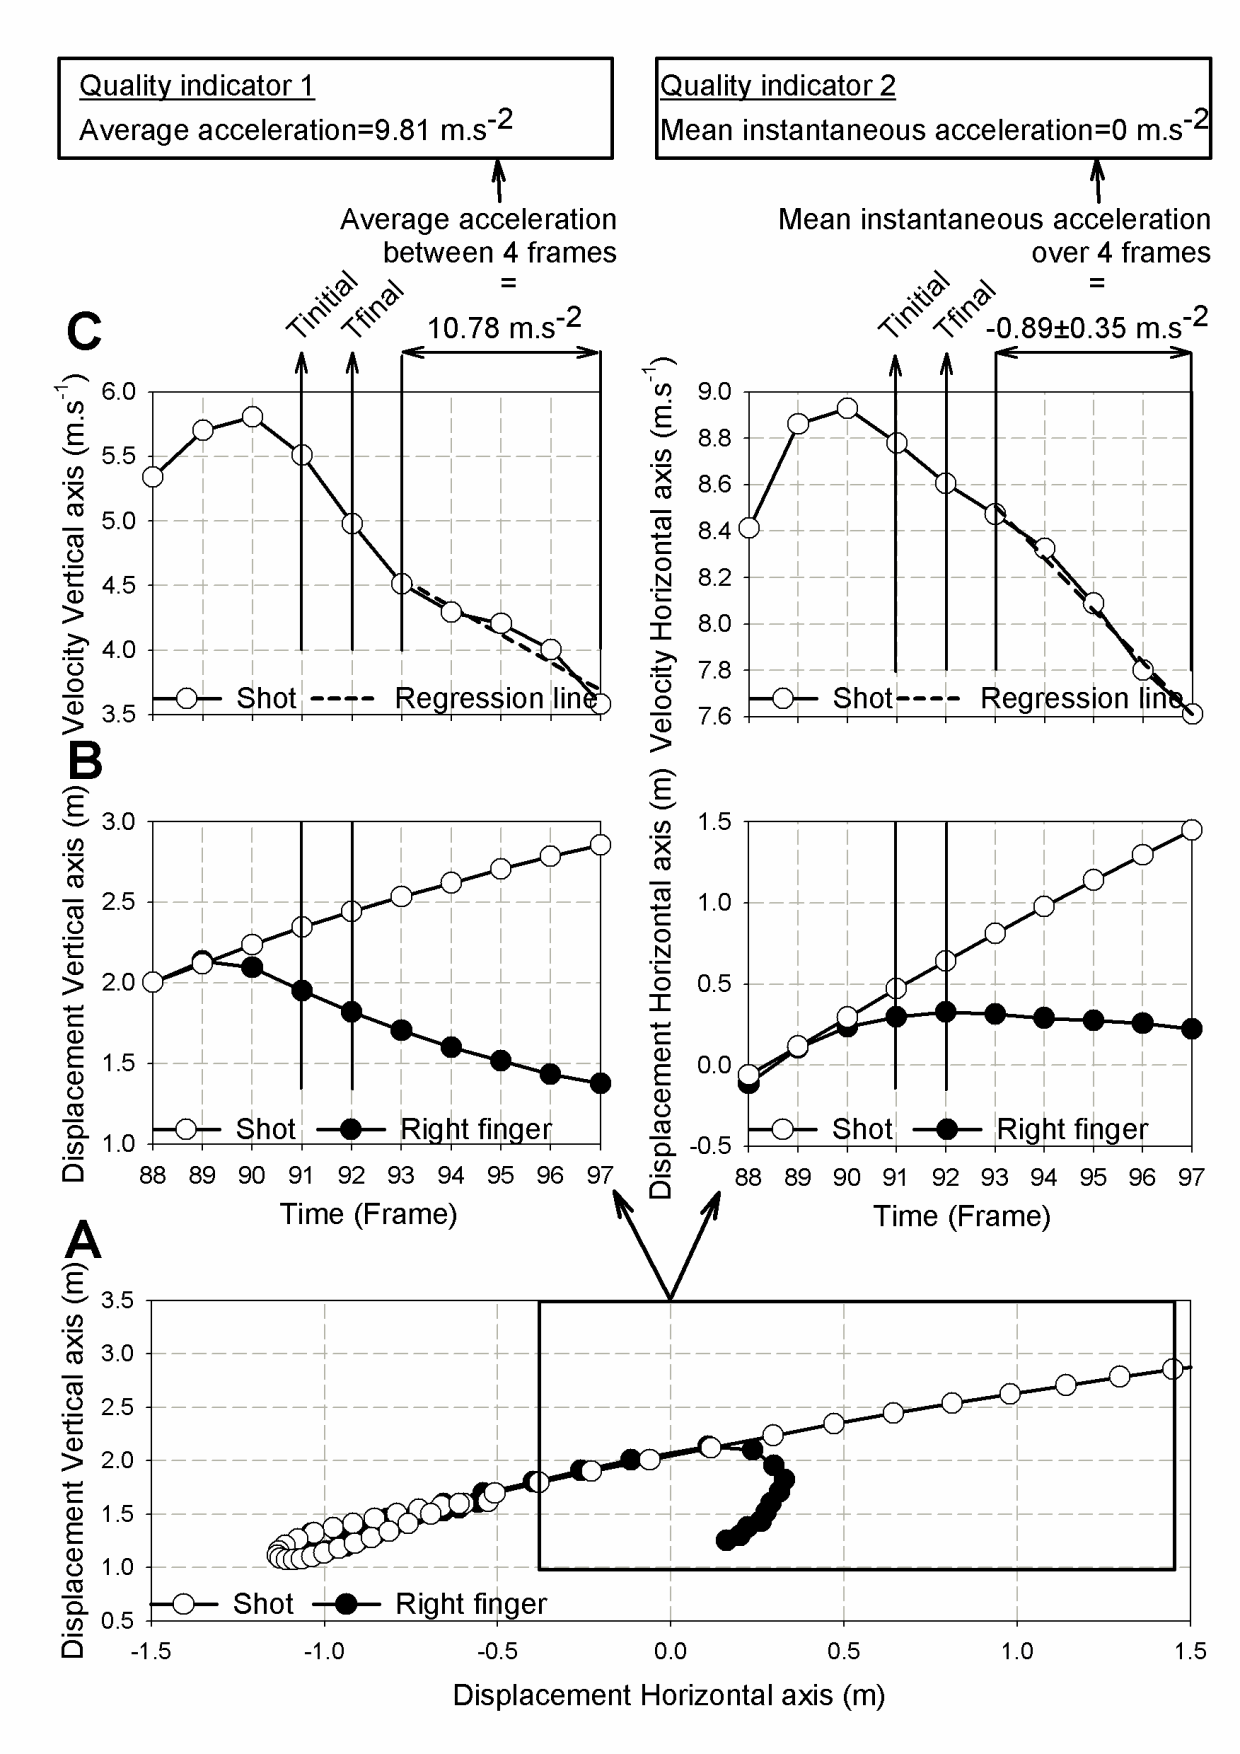
Average acceleration after release on vertical axis (Quality Indicator 1—Step 5)

In principle, the vertical velocity of the shot must be constant, and its acceleration must be equal to 9.81 m.s-2. The software therefore calculated the regression line of the vertical velocity between the frame following Tfinal and the last frame available, in order to eliminate random pointing errors. Then, it calculated the average acceleration, as illustrated in Figure 4. The average over four frames was 10.78 m.s-2 in the case of the male in Class F55.

Mean instantaneous acceleration after release on horizontal axis (Quality Indicator 2—Step 5)

In principle, the horizontal velocity of the shot must be constant, and its acceleration must be nil. The software therefore calculated the mean instantaneous acceleration between the frame following Tfinal and the last frame available, as illustrated in Figure 4. The mean over four intervals was -0.89±0.35 m.s-2 in the case of the male in Class F55.
Calculation error (Quality Indicator 3—Step 7)

Expressed in meters and corresponding to the discrepancy between official and calculated performance measures, the calculation error suggests the general quality of the data processing. A positive error indicates a calculated performance measure that overestimates the official performance, while a negative error indicates a calculated performance measure that underestimates it.

Calculation quality (Quality Indicator 4—Step 7)

The calculation quality corresponds to the percentage of the absolute value of the error, in relation to the official performance measure (such as: Calculation quality=[100-(Abs(Error)/Official performance)*100]). This quality indicator provides an understanding of the data processing’s quality in absolute terms, but it cannot indicate the direction of error.
Sensitivity analysis of tracking of Tinitial and Tfinal (Quality Indicator 5—Step 7)

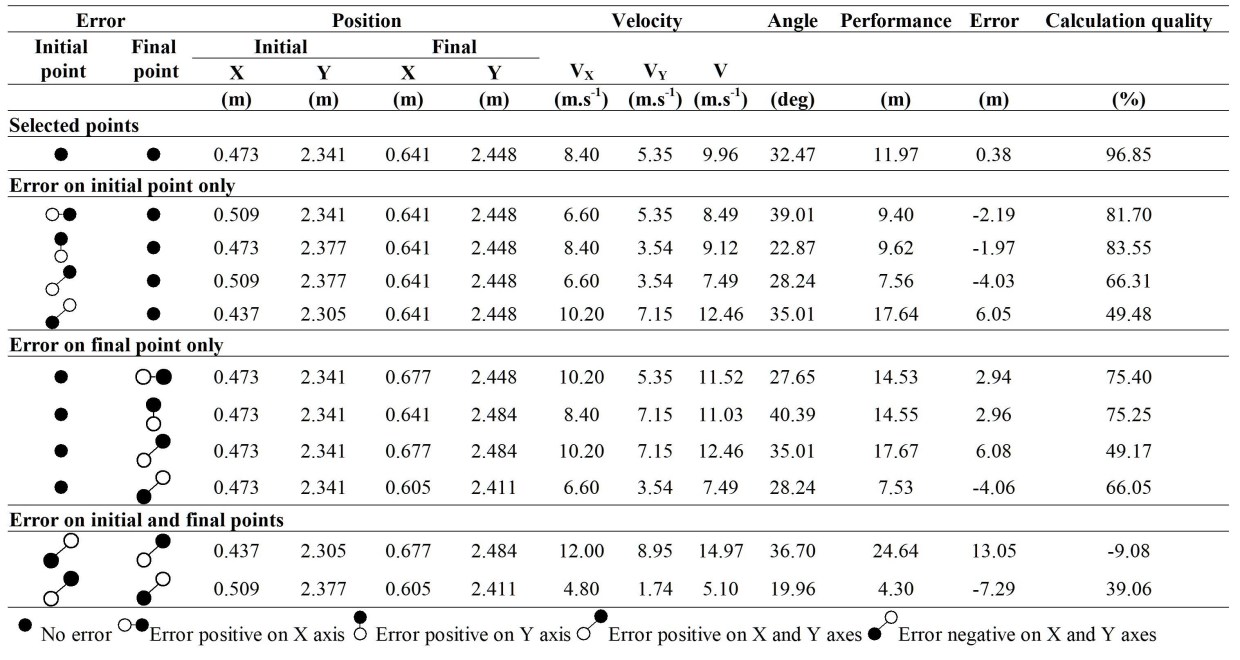
Preliminary studies showed that an error of ±2 pixels could significantly affect calculation of the performance. However, the software was able to provide a succinct sensitivity analysis of the tracking, the outcome of which is reported in Table 2. Sensitivity analysis comprised recalculation of the performance using the combination of positions from Step 6, with 2-pixel positive and negative errors on Tinitial alone, on Tfinal alone, and/or on these two combined. As needed, this feedback guided operator readjustments concerning pointing of the shot (see also Step 4 above).

Table 2

Example of sensitivity analysis of the tracking (Quality Indicator 5) for the male gold medalist in F55 class consisting on recalculating the performance using the combination of positions determined in Step 5 with positive and negative errors of two pixels (3.6 cm) either on Tinitial and Tfinal only or on both combined. The white dot corresponds to the original position; the black dot corresponds to the position with the error. X and Y represent the horizontal and vertical axes, respectively.Kinematic Analysis - Table 2

Kinematic Analysis - Figure 4
Figure 4. Example of feedback provided for the male gold medallist in F55 class to determine the moment of release of the shot (Step 5). Section A represents the vertical position of the shot and the finger during the complete throw until the shot is outside the field of view. The square area corresponds to the zooming on the relevant data to be used to determine the moment of release. Section B presents the selected moment of release (Tinitial = Frame 91), when the separation of the shot and the finger is greater than the diameter of the shot and the second position (Tfinal = Frame 92). Section C provides the velocity of the shot after release as well as the average acceleration (Quality indicator 1) and the mean instantaneous acceleration (Quality indicator 2).
The second of the two efforts to reduce and report error and validate measures of the shot trajectory involved our selection of software that allowed the operator to process the data over an unlimited number of iterations from Step 4 to Step 7, until discrepancies between calculated and official measures had been minimized. Each iteration represented one combination of data points as determined in Step 5.

RESULTS

Table 3
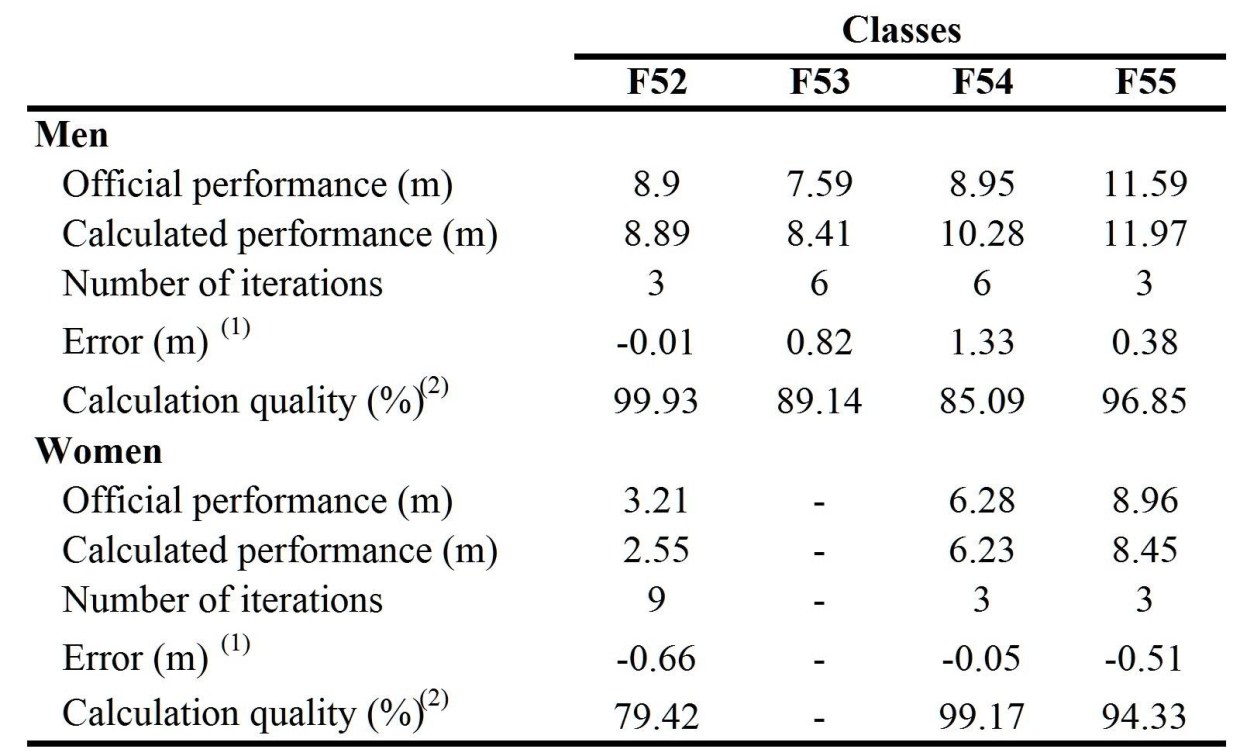
Outcome of the quality control procedure. The number of iterations corresponds to the number of attempts made by the operator during the quality control procedure to minimise the difference between the official and calculated performance. The error corresponds to the difference between the official and calculated performance (Quality indicator 3 (1)). The calculation quality corresponds to the percentage of the absolute value of the calculation error in relation to the official performance, such as: Calculation quality=[100-(Abs(Error)/Official performance)*100] (Quality indicator 4 (2)).
Kinematic Analysis - Table 3
Table 3 presents, by competitive class, the quality control procedure’s outcomes, including number of iterations, calculation error, and calculation quality. The smallest difference between a calculated and an official performance measure was obtained from a minimum of 3 (maximum of 9) iterations. Calculation error ranged from 0.01 m to 1.33 m, with a mean of 0.54±0.46 m. The absolute calculation quality ranged from 79% to 100%, with a mean of 92±8 %.

DISCUSSION

These results overall might be considered satisfactory, since athlete performance during 4 out of 7 puts was calculated with accuracy surpassing 94%. However, accuracy surpassed only 79% for three competitive classes (F53 male, F54 male and F52 female), and the number of iterations was high. This finding indicates that, for these puts, the shot trajectory parameters were not determined with sufficient precision, the result primarily of pincushion distortion, sampling frequency, and projection of shot displacements onto the sagittal plane.
Pincushion distortion

Tracking of the shot’s displacement took place at the right top corner of the screen, outside the calibration volume with its maximum 1.5 m on the vertical, 0.5 m on the horizontal, axis. In principle, this zone is the most prone to pincushion distortion, in which straight lines appear to bow in toward the middle. While such distortion must be acknowledged, it is unlikely to have contributed strongly to the lack of accuracy.
Sampling frequency

Despite its sampling frequency of 50 Hz, the shot appears fuzzy at the instant of release because it has traveled significant distances between successive frames. This made it sometimes difficult, during Step 4, to track the exact center of the shot at the instant of release. Sampling frequency could have had impact on the estimation of the position of the shot and on the estimation of the speed of release. However, speed of release and error do not seem to be correlated here. Quality Indicator 5 assisted in determining the most accurate pointing, as illustrated in Table 2.
Projection of the displacements of the shot onto the sagittal plane

In this study, the main source of error was the positioning of the camera to the side of the athlete, which limited calculation of the speed of release to the sagittal plane alone. Visual analysis of the footage, however, showed that the throwing technique of athletes in these classes included more rotation in the transverse plane. The consequent projection of out-of-plane movement onto the sagittal plane tends to result in underestimation of speed of release and overestimation of release angle. This is reflected in our finding of a constant mean instantaneous acceleration after release on horizontal axis (Quality Indicator 2), rather than a nil mean, as was obtained for the Class F55 males. The slope of the curve corresponds, then, to the angle of the shot trajectory in the transverse plane.

In principle, the best way to alleviate these limitations would be to use a three-dimensional motion analysis system with a data acquisition rate ranging up to 100 Hz. Such a system should provide enough samples to accurately determine the shot’s position at the instant of release and to enable further smoothing of the data if required. Furthermore, with such a system the actual trajectory of the shot could be calculated in three, not two, dimensions, which would improve the accuracy of velocity and angular data

Ideally, put-throwing analysis should require at least four cameras, aligned diagonally with each corner of the plate, as well as a preferred fifth camera located above the athlete ( Allard, Stokes, & Blanchi, 1995; Marzan, 1975). Such a camera arrangement, while possible in an experimental framework, would be difficult to implement on the field during a world-class event, its invasive nature perhaps prompting organizing committees to deny researchers access. In addition, some 20 people work in the immediate throwing area alone, making it highly likely that the field of view of cameras on the floor would become obstructed or compromised as the recording of attempts progressed ( Frossard, Schramm, & Goodman, July 2003; Frossard, Stolp, & Andrews, 2003). A more feasible alternative involves using two commercially available high-speed cameras recording at 100 Hz or better, with full resolution. These cameras should be placed, at a distance, to the front and on the side of the thrower, allowing a bi-planar analysis in the sagittal and frontal planes. (Recordings made in this fashion should also accommodate three-dimensional reconstructions.) It would then become possible to estimate the rotation of the throwing upper arm in the transverse plane. Furthermore, the camera in front would provide data allowing one to determine the distance of the shot’s landing position in relation to the sagittal plane. Alternatively, the offset could be obtained from the laser pointer used by officials as they read the 3D coordinates of the shot at the point of landing. The offset could be used to correct for projection onto the sagittal plane.

CONCLUSION
A quality control procedure for video-recording elite male and female shot-putters during world-class events has been developed whose outcome is the calculation, with reasonable accuracy, of performances at outdoor competitive events. The developers of the quality control procedure acknowledge that diminished accuracy results mainly from limited sampling frequency supplied by the selected SONY video camera and from significant out-of-plane movement. The point is made that kinematic analyses of shot-putters at this level would be more beneficial if they were three-dimensional, rather than two-dimensional, even though most throwing action occurs in the sagittal plane. Because use of a three-dimensional motion analysis system is precluded on the field of play for logistical reasons, practical compromises must be made.

The present study made three majors contributions by demonstrating (a) the need to systematically implement a quality control procedure when conducting kinematic analyses of event-constrained recordings; (b) the benefits of using quality indicators to support decisions about tracking and determining instants of release; and (c) the need to report quality control outcomes in terms of both error and calculation quality. Equipped with data of this type, sport scientists, classifiers, coaches, and athletes will have a better feel for the level of accuracy truly obtainable during competitive events. A better appreciation of such data’s limitations should serve them all well. The quality control procedure that has been proposed can be implemented within an accuracy-based effort.

Recommendations from this study would be particularly important to future studies focusing predominantly on from-the-field data. It is further anticipated that this study will provide key information to sport scientists, coaches, and elite shot-put athletes trying to fully grasp the correlation between shot trajectory parameters and either classification or performance.

REFERENCES

Allard, P., Stokes, I. A. F., & Blanchi, J. P. (Eds.) (1995). Three-dimensional analysis of human movement. Champaign, IL: Human Kinetics.

Ariel, G. (1979). Biomechanical analysis of shotputting. Track and Field Quarterly Review, 79(4), 27–37.

Chow, J. W., Chae, W., & Crawford, M. J. (2000). Kinematic analysis of shot-putting performed by wheelchair athletes of different medical classes. Journal of Sports Sciences, 18, 321–330.

Chow, J. W., & Mindock, L. A. (1999). Discus throwing performances and medical classification of wheelchair athletes. Medicine & Science in Sports & Exercise, 99, 1272–1279.

Dessureault, J. (1978). Kinetic and kinematic factors involved in shotputting. Biomechanics 6B, 51–60.

Frossard, L., O’Riordan, A., & Goodman, S. (2005). Applied biomechanics for evidence-based training of Australian elite seated throwers. International Council of Sport Science and Physical Education “Perspectives” series in Press.

Frossard, L., O’Riordan, A., Goodman, S., & Smeathers, J. (2005). Video recording of seated shot-putters during world-class events. 3rd International Days on Sports Science.

Frossard, L. A., Schramm, A., & Goodman, S. (2003, July). Kinematic analysis of Australian elite seated shot-putters during the 2002 IPC World Championships: Parameters of the shot’s trajectory. XIth Congress of the International Society of Biomechanics, Dunedin, International Society of Biomechanics.

Frossard, L. A., Stolp, S., & Andrews, M. (2003). Systematic video recording of seated athletes during shotput event at the Sydney 2000 Paralympic Games. International Journal of Performance Analysis in Sport .

Frossard, L. A., Stolp, S., & Andrews, M. (2006). Video recording of elite seated shot putters during world-class events. The Sport Journal, 9(3), [pages]. Retrieved from http://www.thesportjournal.org/2006Journal/Vol9-No3/Frossard.asp.

Higgs, C., Babstock, P., Buck, J., Parsons, C., & Brewer, J. (1990). Wheelchair classification for track and field events: A performance approach. Adapted Physical Activity Quarterly, 7, 22–40.

Laveborn, M. (2000). Wheelchair sports: International Stoke Mandeville Wheelchair Sports Federation track and field classification handbook. Aylesbury, UK: International Stoke Mandeville Wheelchair Sports Federation.

Lichtenburg, D. B., & Wills , J. G. (1978). Maximizing the range of the shot put. American Journal of Physics, 46(5), 546–549.

Linthome, N. (2001). Optimum release angle in the shotput. Journal of Sports Sciences, 19, 359–372.

Marzan, G. T. (1975). Rational design for close-range photogrammetry. University of Illinois at Urbana-Champaign.

McCann, B. C. (1993). The medical disability–specific classification system in sports. Vista ’93 The Outlook: Proceedings of the International Conference on High Performance Sport for Athletes with Disabilities, Edmonton, Rick Hansen Centre.Vanlandewijck and Chappel.

McCoy, R. W., Gregor, R. J., Whiting, W. C., & Rich, R. G. (1984). Technique analysis: Kinematic analysis of elite shot-putters. Track Technique, 2868–2871

O’Riordan, A., & Frossard, L. (2006). Seated shot-put: What’s it all about? Modern Athlete and Coach, 44(2), 2–8.

O’Riordan, A., Goodman, S., & Frossard, L. (2004). Relationship between the parameters describing the feet position and the performance of elite seated discus throwers in Class F33/34 participating in the 2002 IPC World Championships. AAESS Exercise and Sports Science Conference.

Sušanka, P., & Štepánek, J. (1988). Biomechanical analysis of the shot put. Scientific Report on the Second IAAF World Championship. Monarco, IAAF: 1-77.

Tsirakos, D. M., Bartlett, R. M., & Kollias, I. A. (1995). A comparative study of the release and temporal characteristics of shot put. Journal of Human Movement Studies, 28, 227–242.

Tweedy, S. M. (2002). Taxonomic theory and the ICF: Foundation for the Unified Disability Athletics Classification. Adapted Physical Activity Quarterly, 19, 221–237.

Vanlandewijck, Y. C., & Chappel, R. J. (1996). Integration and classification issues in competitive sports for athletes with disabilities. Sport Science Review, 5, 65–88.

Williamson, D. C. (1997). Principles of classification in competitive sport for participants with disabilities: A proposal. Palaestra, 13(2): 44–48.

Zatsiorsky, V. M., Lanka, G. E., & Shalmanov, A. A. (1981). Biomechanical analysis of shotputting technique. Exercise and Sports Science Review, 9, 353–387.

2016-10-12T11:13:54-05:00January 7th, 2008|Sports Exercise Science, Sports Management, Sports Studies and Sports Psychology|Comments Off on Quality Control Procedure for Kinematic Analysis of Elite Seated Shot-Putters During World-Class Events

Nutrition-related knowledge, attitude, and dietary intake of college track athletes

ABSTRACT
Although it is recognized that athletic performance is enhanced by optimal nutrition, nutrition-related knowledge deficits and dietary inadequacies continue to persist among many college athletes. The purpose of this study of college track athletes was to measure nutrition knowledge, attitude regarding healthy eating and athletic performance, and dietary intake, identifying relationships among these parameters. A self-administered nutrition knowledge and attitudes survey and the youth/adolescent semi-quantitative food frequency questionnaire were used to measure nutrition knowledge and nutrition attitude and to assess diet quality, employing a convenience sample of 113 track athletes from two NCAA Division I schools. Mean knowledge was fair, with highest component scores attained for carbohydrate, vitamins and minerals, and protein. Low scores were found for vitamins E and C. Mean attitude scores were high and similar by sex. Overall mean diet quality was 84 ± 10 (M ± SD) of 110 possible. High mean dietary intake scores were found for vitamins C and A, cholesterol, saturated fat, calcium, and magnesium; low mean dietary intake scores were found for vitamin E, fiber, sodium, and potassium. Weak correlations existed between nutrition knowledge and attitude versus diet quality. In summary, we identified adequate intake and knowledge (carbohydrates), poor intake and knowledge (vitamin E), and adequate intake and lack of knowledge (vitamin C and protein). Future research should explore factors other than knowledge and attitude that may have primary influence on dietary intake among college athletes.

INTRODUCTION

It is well recognized that athletic performance is enhanced by optimal nutrition (American College of Sports Medicine, American Dietetic Association, and Dietitians of Canada, 2000). However, college athletes encounter numerous barriers that can hinder healthy eating, including lack of time to prepare healthy foods (due to rigorous academic and training schedules), insufficient financial resources to purchase healthy foods, limited meal planning and preparation skills, and travel schedules necessitating “eating on the road”(Malinauskas, Overton, Cucchiara, Carpenter, & Corbett, 2007; Palumbo, 2000). Research has demonstrated that athletes are interested in nutrition information, and that sport nutrition information is increasingly available (Froiland, Koszewski, Hingst, & Kopecky, 2004; Jonnalagadda, Rosenbloom, & Skinner, 2001; Zawila, Steib, & Hoogenboom, 2003).

Nevertheless, nutrition-related knowledge deficits and dietary inadequacies persist among many college athletes (Jacobson, Sobonya, & Ransone, 2001; Rosenbloom, Jonnalagadda, & Skinner, 2002; Malinauskas, Overton, Cucchiara, Carpenter, & Corbett, 2007; Zawila, Steib, & Hoogenboom, 2003). College athletes exhibit a lack of knowledge about the roles of protein, vitamins, and minerals in the body and also about supplementation with these nutrients (Jacobson, Sobonya, & Ransone, 2001; Rosenbloom, Jonnalagadda, & Skinner, 2002; Zawila, Steib, & Hoogenboom, 2003). For example, Jacobson and colleagues (2001) reported that male athletes are likely to believe that protein provides immediate energy and that high-protein diets increase muscle mass. Zawila and colleagues (2003) reported nutrition knowledge deficits among female cross-country runners.

Nutrition can play a key role in optimizing physical performance and recovery from strenuous exercise (American College of Sports Medicine, American Dietetic Association, and Dietitians of Canada, 2000). However, many college athletes have diets that warrant change to promote health and support performance (Malinauskas, Overton, Cucchiara, Carpenter, & Corbett, 2007). Specifically, diets that are low in fruits, vegetables, and whole grains and high in fat and processed foods are common among college athletes (Clark, Reed, Crouse, & Armstrong, 2003; Hinton, Sanford, Davidson, Yakushko, & Beck, 2004). To improve dietary intake among college athletes, further research is warranted identifying dietary inadequacies as well as factors influencing the dietary intake of athletes (Hinton, et al, 2004; Turner & Bass, 2001).

It is unclear if college athletes’ nutrition knowledge and attitudes about nutrition have an association with their dietary intake. Wilta and colleagues (1995) found that greater nutrition knowledge was associated with healthier dietary practices among runners, whereas Turner and colleagues (2001) reported no significant correlate relationships between knowledge and dietary intake among female athletes. These conflicting findings suggest that further research is needed to learn whether knowledge and attitude are primary factors impacting college athletes’ dietary intake. The purpose of the present study was to assess the nutrition knowledge, nutrition-related attitudes, and dietary intake of college track athletes. Specific research objectives were (a) to measure nutrition knowledge in regard to carbohydrate, protein, vitamins and minerals in general, and selected antioxidant vitamins; (b) to assess attitude regarding healthy eating and athletic performance; (c) to evaluate dietary intake; and (d) to identify if, for college track athletes, relationships exist among nutrition knowledge, attitude, and dietary intake.

METHODS

Approval to conduct the study was secured from the appropriate Institutional Review Board prior to data collection. Written consent was obtained from each participant. All data collection was performed by a single researcher.
Nutrition knowledge and attitude survey

A registered dietitian constructed a nutrition knowledge and attitude pilot survey (Jonnalagadda, et al, 2001; Zawila, et al, 2003). The knowledge section included five subject areas (carbohydrates, protein, vitamins and minerals in general, vitamin C, vitamin E) with 2–5 true/false statements per subject area. The attitude section included five statements of belief that healthy eating supports athletic performance. Participants used a 5-point Likert scale (1 = strongly disagree, 3 = neither agree nor disagree, 5 = strongly agree) to indicate level of agreement with each statement. The survey was reviewed for content validity by a second registered dietitian and for content clarity by a person in a profession other than health care. To pilot test the survey, 47 track athletes (26 males, 21 females) from a NCAA Division I program in the Piedmont region of the United States completed the self-administered survey. Only minor syntax modifications were necessary based on participant responses.

Assessing diet quality
The semi-quantitative youth/adolescent food frequency questionnaire (YAQ) assesses dietary intake over the 12 preceding months. The YAQ has demonstrated reproducibility and validity in youth and has been used to measure nutrient intakes among college athletes (Hinton, et al, 2004; Rockett, Wolf, & Colditz, 1995; Rockett et al., 1997). In the present study, data obtained with the YAQ were used to calculate diet quality scores. The total score was the sum of 11 “nutrient component scores,” including nutrients of concern (fiber, calcium, potassium, magnesium, and vitamins A, E, and C) and nutrients promoting metabolic dysregulation (saturated fat, cholesterol, added sugar, and salt) as indicated in the 2005 Dietary Guidelines for Americans (U.S. Department of Health and Human Services [USDHH] & U.S. Department of Agriculture [USDA], 2005). Under a framework provided by the Healthy Eating Index, each nutrient component score was 10 at maximum and 0 at minimum (Basiotis, Carlson, Gerrior, Juan, & Lino, 1999). A component score of 10 was assigned for a nutrient when intake met or exceeded the Dietary Reference Intake. Proportionately lower scores were assigned to nutrients when was intake less than recommended (Food and Nutrition Board, Institute of Medicine [FNBIM], 1997, 2000, 2001). Cholesterol, saturated fat, sodium, and fiber recommendations were based on 2005 Dietary Guidelines, while sugar recommendations were based on Recommended Dietary Allowances (USDHH & USDA, 2005; Food and Nutrition Board, Institute of Medicine, 2003). To obtain the maximum score of 10, criteria to be met included intakes of < 300 mg cholesterol, < 10% calories from saturated fat or sugar, < 2300 mg sodium, and > 14 g fiber/1,000 calories. To obtain the minimum score of 0, criteria to be met included intakes of > 15% calories from saturated fat or sugar, > 450 mg cholesterol, and > 4600 mg sodium (USDHH & USDA, 2005; Food and Nutrition Board, Institute of Medicine, 2003). Values between the maximum and minimum criteria were scored proportionately (Basiotis, et al, 1999).

Survey administration
A convenience sample of track athletes (N = 113) from two NCAA Division I track programs in the southeastern United States participated in the study during the fall of 2006.

Statistical analysis
All statistical analysis was conducted using SPSS 13.0. Descriptive statistics include means, standard deviations, 95% confidence intervals, and frequency distributions. Independent t-tests were used to compare mean knowledge and diet quality scores by sex. Simple linear regression was used to examine relationships between knowledge, attitude, and diet quality. An alpha level of .05 was used for all statistical tests.

RESULTS

A total of 118 participants completed the study. Data from 5 were excluded due either to incompleteness (n = 2), to a respondent’s age being less than 18 years (n = 1), or to a respondent’s competing only in field events (n = 2). The final sample size was 113 (61 males, 52 females), and the overall participation rate was 71%. Demographic characteristics of participants are reported in Table 1. The majority (67%) of participants were freshmen and sophomores. The participants’ reported event specialties were sprinting (45%), middle-distance (27%), and long-distance (29%). YOU ARE HERE
Table 1

Demographic Characteristics of College Track Athletes

Parameter (M ± SD) Males (n = 61) Females (n = 52)
Age (in years) 19.3 ± 1.2 19.1 ± 1.1

n % n %

Academic classification
Freshman 22 36 20 39
Sophomore 19 32 17 33
Junior 13 21 8 15
Senior 5 8 7 13
5th-year senior 2 3
Ethnic origin
American Indian 1 2 1 2
African American 21 35 19 37
Hispanic 1 2
Caucasian 30 49 26 50
Asian 1 2

Other 7 11 5 9
Not reported 1 1
Event specialty
Sprinting 25 41 24 46
Middle-distance running 12 20 4 8
Long-distance running 14 23 16 31
Not reported 10 16 8 15

Note. An athlete was described as a sprinting specialist if he or she reported primary competition events shorter than 800 m; as a middle-distance specialist if he or she reported primary competition events 800 m to 1500 m; and as a long-distance specialist if he or she reported primary competition events longer than 1500 m.

Mean nutrition knowledge and attitude scores are reported in Table 2. The mean knowledge score for all participants was 58% ± 13% (M ± SD), which did not differ significantly by sex. Although mean knowledge component scores were similar for males and females, by subject area the rate of correct responses ranged widely, from 26% to 76%. The highest mean knowledge scores were for carbohydrate, vitamins and minerals, and protein. Mean scores of less than 50% were found for vitamin E and vitamin C. Mean attitude scores were high and were similar for males and females.

Table 2
Nutrient Knowledge* and Attitude† Scores of College Track Athletes

Parameter (M ± SD) Males (n = 61) Females (n = 52) 95% CI

Nutrition knowledge 58.7 ± 1.6 57.8 ± 1.8 (55.9, 60.9)

Carbohydrate 76.1 ± 20.9 74.6 ± 17.3 (17.2, 33.3)
Protein 55.1 ± 19.9 54.2 ± 16.0 (0.2, 6.1)
Vitamins and minerals 63.0 ± 20.6 62.3 ± 20.0 (-6.9, 8.2)
Vitamin C 26.2 ± 34.9 33.7 ± 36.7 (7.8, 20.8)
Vitamin E 43.0 ± 30.7 47.1 ± 33.8 (5.2, 16.7)

Nutrition attitudes 80.4 ± 14.0 77.6 ± 12.4 (19.2, 20.4)

*Percent correct.
†Percent agreement that healthy eating supports athletic performance.

Mean diet quality scores are reported in Table 3. Overall mean diet quality for all participants was 83.6 ± 9.8. There were no significant differences in diet quality between the sexes. High mean dietary component scores were found for vitamin C, vitamin A, cholesterol, saturated fat, calcium, and magnesium, while low mean dietary component scores were found for vitamin E, fiber, sodium, and potassium. Mean fiber, cholesterol, and magnesium scores were significantly greater for females than males.

Table 3
Diet Quality Scores of College Track Athletes

Parameter (M ± SD) Males (n = 61) Females (n = 52) 95% CI_

Diet quality 82.6 ± 8.8 84.8 ± 10.8 (-5.8, 1.6)
Vitamin E 5.6 ± 2.1 5.3 ± 2.4 (-0.6, 1.2)
Vitamin C 9.4 ± 1.5 9.6 ± 1.2 (-0.7, 0.4)
Vitamin A 8.4 ± 2.3 8.5 ± 2.2 (-1.0, 0.7)
Fiber 6.1 ± 1.6 6.8 ± 1.7* (-1.3, -0.1)
Cholesterol 7.6 ± 3.5 8.6 ± 2.9* (-2.2, .2)
Saturated fat 8.0 ± 2.7 8.3 ± 2.6 (-1.3, 0.7)
Sucrose 7.8 ± 3.1 7.5 ± 3.2 (-0.9, 1.5)
Sodium 6.9 ± 3.1 7.1 ± 3.3 (-1.4, 1.0)
Potassium 6.8 ± 2.1 6.2 ± 2.3 (-0.3, 1.4)
Calcium 8.5 ± 1.7 8.4 ± 2.1 (-0.6, 0.9)

Magnesium 7.7 ± 1.9 8.5 ± 2.1* (-1.5, 0.1)

Note. Dietary intake was assessed using the youth/adolescent food frequency questionnaire (Rockett, Wolf, & Colditz, 1995). With this instrument, dietary quality is represented as the sum of the 11 nutrient component scores. Each component score ranged from 0 (minimum) to 10 (maximum), based on actual dietary intake as compared to recommended intakes (FNBIM, 1997, 2000, 2001, 2003; USDHH & U.S. Department of Agriculture, 2005). Higher scores indicate nutrient intakes relatively close to recommended levels.
*p < .05

There were very weak correlations for diet quality and attitude (r = 0.048) and diet quality and knowledge (r = 0.001). There was little correlation between knowledge scores for specific nutrients and corresponding dietary intake: carbohydrate (r = 0.011), protein (r = -0.009), vitamin C (r = -0.004), and vitamin E (r = -0.005).

DISCUSSION

The purpose of this study was to assess nutrition knowledge, attitude, and dietary intake of college track athletes. Specifically, we asked if knowledge and attitude were related to dietary intake. This research is novel because we examined relationships between knowledge about specific nutrients (carbohydrate, protein, and vitamins C and E) and actual intakes of these nutrients. Further, there is a lack of research on college athletes’ knowledge concerning antioxidant vitamins, despite the fact that many of them do supplement their diets with antioxidants (Froiland, Koszewski, Hingst, & Kopecky, 2004; Herbold, Visconti, Frates, & Bandini, 2004).

Among the college track athletes participating in this study, knowledge about carbohydrate and general knowledge of the roles of vitamins and minerals in exercise was fair. These athletes lacked knowledge, however, about the roles of protein, vitamin C, and vitamin E. For example, 82% (n = 93) of the athletes believed that vegetarian athletes require protein supplements to meet their protein needs, and 40% (n = 45) believed that the body relies on protein for immediate energy. Previous studies have similarly indicated a lack of knowledge of the specified nutrients among college athletes. Rosenbloom and colleagues (2002) found that 46% of athletes believed protein is the main energy source for the muscle and 34% believed athletes require protein supplementation.

Indeed, athletes may be tempted to use supplements to gain a competitive edge. Primary reasons athletes give for nutrient supplementation include increasing strength and energy and improving athletic performance (Froiland, Koszewski, Hingst, & Kopecky, 2004; Herbold, Visconti, Frates, & Bandini, 2004). In the present study, a majority (67%, n = 76) of the athletes believed athletes must take a multivitamin each day and 56% (n = 66) believed vitamins and minerals supply energy. Other studies, as well, have reported many athletes believing vitamins and minerals can increase energy (Jonnalagadda, et al, 2001; Rosenbloom, Jonnalagadda, & Skinner, 2002).

Furthermore, misconceptions about antioxidant vitamins characterized the majority of athletes in our study. For example, 53% (n = 60) believed it was necessary for an athlete to supplement with vitamin C to boost immune functioning, and 56% (n = 63) believed that vitamin E supplementation was necessary to protect red blood cells from oxidative damage and to promote oxygen transport to muscles. Other researchers have reported athletes supplementing with vitamins C and E to enhance their immune system and prevent illness (Froiland, Koszewski, Hingst, & Kopecky, 2004; Neiper, 2005). Overall, the nutrition knowledge deficits identified in the present study confirm that many college athletes lack understanding of the roles of protein, vitamins, and minerals in the body, and thus lack the ability to assess whether their dietary intake of nutrients warrants use of a supplement. Education strategies for sports professionals and athletes should focus on the roles of selected nutrients in exercise, how to obtain adequate dietary intake of the nutrients, and how to evaluate need for nutrient supplementation.

The mean nutrition attitude score was high for both sexes. Seventy-one percent (n = 80) strongly agreed that “Eating healthy foods will improve my athletic performance.” Our findings about positive nutrition-related attitudes are consistent with those of Zawila and colleagues (2003), who reported that runners exhibited positive attitudes regarding nutrition education. College athletes may be receptive to learning how to improve their dietary intake to correct nutrient inadequacies that can impact their sport performance.

The mean diet quality for both males and females was greater than 80%, indicating an overall healthy diet among those surveyed. In regard to mean component scores, males and females alike had high scores (greater than 8) for vitamin A, vitamin C, and calcium. In contrast, mean scores for intake of vitamin E, potassium, fiber, and sodium were low, indicating a need for nutrition education moving dietary intake of these nutrients into line with dietary recommendations.

We found that neither nutrition knowledge nor attitude correlated with dietary intake; knowledge was less than 1% predictive of dietary intake. Conflicting results have been reported for athletes regarding relationships between nutrition knowledge and dietary intake. Wilta and colleagues (1995) found that dietary intake was 27% predictive of nutrition knowledge among runners and thus concluded that runners with greater nutrition knowledge make better food choices. On the other hand, Turner and colleagues (2001) reported that osteoporosis knowledge was only 3% predictive of dairy intake among athletes and thus concluded that, among college athletes, there was no significant correlation between knowledge of osteoporosis and intake of dairy products. In the present study, nutrition-related attitude was only 5% predictive of dietary intake, indicating that attitude about eating to support performance was not the primary influence on dietary intake. In addition, no significant correlations were found between knowledge of specific nutrients and actual dietary intake of the nutrients. While examining these relationships, we identified adequate intake with adequate knowledge (carbohydrate), poor intake with lack of knowledge (vitamin E), and adequate intake with lack of knowledge (protein and vitamin C). As a result of this study’s findings, we suggest that future research should explore factors other than nutrition knowledge and attitude that influence dietary intake among college athletes, since knowledge and attitude were not found here to be primary factors impacting dietary intake.

Address correspondence to: B. Malinauskas, Ph.D., R.D., Assistant Professor, Department of Nutrition and Dietetics, East Carolina University,
Greenville, NC 27858-4353, malinauskasb@ecu.edu

REFERENCES

American College of Sports Medicine, American Dietetic Association, and Dietitians of Canada. Nutrition and athletic performance. (2000). Medicine and Sports Science, 32(12), 2130–2145.

Basiotis, P. P., Carlson, A., Gerrior, S. A., Juan, W. Y., & Lino, M. The healthy eating index: 1999–2000. U.S. Department of Agriculture, Center for Nutrition Policy and Promotion. (Publication No. CNPP–12). Retrieved from http://www.usda.gov/cnpp/Pubs/HEI/HEI99-00.pdf

Clark, C, Reed, D. B., Crouse, S. F., & Armstrong, R. B. (2003). Pre- and post-season dietary intake, body composition, and performance indices of NCAA Division I female soccer players. International Journal of Sports Nutrition and Exercise Metabolism, 13, 303–319.

Food and Nutrition Board, Institute of Medicine. Dietary reference intakes for calcium, phosphorous, magnesium, vitamin D, and fluoride. Washington: National Academy of Sciences, 1997.

Food and Nutrition Board, Institute of Medicine. (2000). Dietary reference intakes for vitamin C, vitamin E, selenium, and carotenoids. Washington, DC: National Academy of Sciences.

Food and Nutrition Board, Institute of Medicine. (2001). Dietary reference intakes for vitamin A, vitamin K, arsenic, boron, chromium, copper, iodine, iron, manganese, nickel, silicon, vanadium, and zinc. Washington, DC: National Academy of Sciences.

Food and Nutrition Board, Institute of Medicine. (2003). Dietary reference intakes for energy, carbohydrate, fiber, fat, protein, and amino acids. Washington, DC: National Academy of Sciences.

Froiland, K., Koszewski, W., Hingst, J., & Kopecky, L. (2004). Nutritional supplement use among college athletes and their sources of information. International Journal of Sports Nutrition and Exercise Metabolism, 14, 104–120.

Herbold, N. H., Visconti, B. K., Frates, S, & Bandini, L. (2004). Traditional and nontraditional supplement use by collegiate female varsity athletes. International Journal of Sports Nutrition and Exercise Metabolism, 14, 586–593.

Hinton, P. S., Sanford, T. C., Davidson, M. M., Yakushko, O. F., & Beck, N. C. (2004). Nutrient intakes and dietary behaviors of male and female collegiate athletes. International Journal of Sports Nutrition and Exercise Metabolism, 14, 389–404.

Jacobson, B. H., Sobonya, C., & Ransone, J. (2001). Nutrition practices and knowledge of college varsity athletes: A follow-up. Journal of Strength and Conditioning Resistance, 15(1), 63–68.

Jonnalagadda, S. S., Rosenbloom, C. A., & Skinner, R. (2001). Dietary practices, attitudes, and physiological status of collegiate freshman football players. Journal of Strength and Conditioning Resistance, 15(4), 507–513.

Malinauskas B. M., Overton, R.F., Cucchiara, A.J., Carpenter, A.B., & Corbett, A.B. (2007). Summer league college baseball players: Do dietary intake and barriers to eating healthy differ between game and non-game days? The Sport Management and Related Topics Journal, 3(2), 23–34.

Neiper, A. (2005). Nutritional supplement practices in UK junior national track and field athletes. British Journal of Sports Medicine, 39, 645–649.

Palumbo, C. M. (2000). Case problem: Nutrition concerns related to the performance of a baseball team. Journal of the American Dietetic Association, 100, 704–705.

Rosenbloom, C. A., Jonnalagadda, S. S., & Skinner, R. (2002). Nutrition knowledge of collegiate athletes in a Division I National Collegiate Athletic Association institution. Journal of the American Dietetic Association, 103, 418–421.

Rockett, H. R., Breitenbach, M., Frazier, A. L., Witschi, J., Wolf, A. M., Field, A. E., & Colditz, G. A. (1997). Validation of a youth/adolescent food frequency questionnaire. Preventive Medicine, 26(6), 808–16.

Rockett, H. R., Wolf, A. M., & Colditz, G. A. (1995). Development and reproducibility of a food frequency questionnaire to assess diets of older children and adolescents. Journal of the American Dietetic Association, 95(3), 336–40.

Turner, L. W., and Bass, M. A. (2001). Osteoporosis knowledge, attitudes, and behaviors of female collegiate athletes. International Journal of Sports Nutrition and Exercise Metabolism, 11, 482–489.

U.S. Department of Health and Human Services & U.S. Department of Agriculture. (January 2005). Dietary Guidelines, 2005. (6th ed.). Washington, DC: U.S. Government Printing Office.

Wilta, B., Stombaugh, I., & Buch, J. (1995). Nutrition knowledge and eating practices of young female athletes. Journal of Physical Education, Research, & Dance, 66, 36–41.

Zawila, L. G., Steib, C. M., & Hoogenboom, B. (2003). The female collegiate cross-country runner: Nutritional knowledge and attitudes. Journal of Athletic Training, 38(1), 67–74.

2016-10-12T10:33:47-05:00January 7th, 2008|Contemporary Sports Issues, Sports Exercise Science, Sports Management, Sports Studies and Sports Psychology|Comments Off on Nutrition-related knowledge, attitude, and dietary intake of college track athletes

Leisure constraints experienced by university students in Greece

ABSTRACT
The aim of this study was (a) to investigate students’ leisure constraints; (b) to identify students’ profiles; and (c) to explore the effects of gender, residence, participation in physical activities, and health habits on the intensity of constraints experienced. Using the scale developed by Alexandris and Caroll (1997), it was observed that students’ perceived their leisure activities to be constrained by, mainly, accessibility and facilities. Analyses of variance employing constraints as the dependent variables, with (a) residence before age 18 and (b) health habits as independent variables, showed, for the dimension “lack of company,” some statistically significant differences between students born and raised in small cities and those born and raised in big cities. Furthermore, students from small cities reported significantly more constraints arising from lack of company during leisure activities. In contrast, in four of the seven constraint dimensions, students who paid much attention to their nutrition habits (i.e., who ate more healthily) perceived fewer constraints on leisure activities than did students paying no attention to nutrition. Providing leisure and sport education, inculcating positive attitudes about participation, might reduce students’ experience of leisure constraints and should be developed as a strategic marketing effort to involve both private and public sectors, since it is undeniable that an active lifestyle is healthier than a sedentary lifestyle.

INTRODUCTION
Leisure constraints research focuses on investigating factors that inhibit or prohibit participation and enjoyment in leisure (Jackson, 2000). As a scientific field, it belongs to the broader field of leisure studies, and only in the last two decades has it arrived as a distinct field, thanks to systematic research (Jackson, 2005). Studying leisure constraints might lead to both humanitarian and managerial outcomes. From a humanitarian point of view, it would be valuable to understand the reasons underlying the final decision to participate in activities, since participation, even in soft forms of physical activity, has been found to offer various benefits to participants, such as a high level of self-esteem, freedom from some diseases, a high quality of life, and improvement of cardiac health (Strauss, 2000). From a managerial point of view, probing the source of leisure constraints may ultimately help in better organizing and promoting leisure activities. Research may also become valuable in the development of focused leisure policies and strategies for every institute or company that provides organized leisure activities.

Furthermore, a thorough understanding of what keeps people away from physical activities is essential for the identification of appropriate points of intervention to promote active lifestyles and the health benefits they offer (Davison & Lawson, 2006). Additionally, as Larson (2000) noted, leisure is a crucial developmental context for young people and adolescents. From this point of view, investigating leisure constraints among the specific age-based category of young students is vital. Knowledge gained could improve the implementation of leisure services for youth—the future, hopefully healthier, society.

It is valuable to investigate leisure constraints, since they seem to determine to a great degree actual participation in activities (Alecandris, Tsorbatzoudis & Grouios, 2002). Moreover, identifying the strongest constraints may provide information helpful in creating strategies to promote leisure and sport activities. Understanding differences in perceived constraints associated with gender, age, participation, and nutrition habits, should be useful for planning, promoting, and managing organized leisure sport activities.

The present study aimed to (a) identify the leisure constraints experienced by students in Thessaloniki in northern Greece; (b) depict students’ profiles in terms of their health habits; (c) identify the hierarchy of intensity of the experience of constraints; and (d) investigate differences in constraints experienced, by gender, residence, participation in physical activities, and nutrition habits.

LITERATURE REVIEW
Leisure constraints began to be systematically investigated in the 1980s. At that time, they were closely related to participation, presenting “barriers” that existed between a person’s desire to participate actively in a leisure activity and his/her actual participation. (Jackson, 2005) The optic angle changed greatly throughout the 1980s and 1990s (Jackson & Scott, 1999), as the variety of constraints acknowledged to wield an influence grew. This was the outcome of such new methodological approaches as factor analysis and cluster analysis (Hawkins & Freeman, 1993; Norman, 1996; Norman, 1995; Stodolska, 1998).

Constraints, however, are no longer considered the only factors that influence participation. In other words, a person’s experience of constraints does not necessarily lead to non-participation (Jackson, 2005). Crawford and Godbey (1987) distinguished three categories of leisure constraints: (a) intrapersonal constraints, including negative individual psychological states and/or other characteristics of an individual that interact with personal preferences (e.g., self-esteem and perceived physical skills); (b) interpersonal constraints, stemming from interactions and relationships among individuals (e.g., access to partners’ or friends’ company for leisure activities); and (c) structural constraints, which intervene between leisure preferences and participation (e.g., costs of participating and problems with facilities). Crawford and Godbey’s classification of leisure constraints (1987) reflects the dimensionality underlying leisure constraints and has been well supported by subsequent research (Backman, 1991; Henderson, Stalnaker, & Taylor, 1998; Hultsman, 1995; Jackson, 1991).

The hierarchical model by Crawford, Jackson and Godbey (1991), which was based on earlier work by Scott (1991), assigns intrapersonal and interpersonal constraints the strongest influence on formation of leisure habits, relegating structural constraints to a role of least importance. Individuals experience the three types of constraint hierarchically, according to the model, through the participation decision-making process; constraints interact with motivations and preferences and shape the level of participation. Individuals may, however, negotiate their way through constraints, finding ways to participate in the face of them.

Time- and cost-related constraints rank among the most frequent and powerful constraints on leisure activities generally (Jackson, 2005). Walker and Virden (2004) noted that constraints on time are the strongest ones, and the ones most common in relevant studies.

Leisure constraints and gender
Most of the relevant studies (Alexandris & Carroll, 1997; Jackson, 2005; Horna, 1989; Jackson & Henderson, 1995; Rocklynn, 1998) have come to the common conclusion that women face more intense leisure constraints than men, and this results mainly from lack of time. They tend to suggest that women’s place within society, women’s roles and responsibilities, often limit women’s freedom of choice. Furthermore, lack of technical skills, of private transportation, and of financial resources are also experienced by women more intensely than men (Harahoussou, 1996; Harrington & Dawson, 1995).
Leisure constraints, educational level, age and marital status

Leisure constraints have also been found to be related to demographic data other than gender, such as education, age, and marital status (Alexandris & Carroll, 1997; Jackson & Henderson, 1995; Witt & Goodale, 1981). People with more education have been found to experience a lower level of constraints, while older people report greater time constraints and married people report more constraints related to family responsibilities.
Leisure constraints and residence

The direct relationship between leisure constraints and residence has not previously been investigated. However, in a national survey in the United States (Klepeis et al., 1996) concerning energy expenditure for leisure-time physical activity, differences were reported among the country’s regions. Inhabitants of the Pacific region (California, Nevada, Arizona, and Hawaii) were more physically active than those of the Central region (Nebraska, Kansas, Iowa, and Missouri), for example.

Leisure constraints and participation in leisure activities
During the process of deciding to participate in leisure activities, experienced constraints may affect individuals’ preferences, interests, and enjoyment derived from participation. Alexandris, Tsorbatzoudis, and Grouios (2002) found that leisure constraints may affect frequency of participation in activities, sometimes leading even to complete non-participation. However, studies exist flatly countering that conclusion (Kay & Jackson, 1991; Scott, 1991). This discrepancy between findings makes the present investigation of leisure constraints and frequency of participation of some importance.
Leisure constraints and nutrition habits

Many studies demonstrate that regular participation in physical activity is part of a healthy lifestyle (U.S. Department of Health and Human Services, 2000). Physical activity may prevent those diseases fostered by the under-mobility characterizing everyday life; they may also enhance quality of life more generally (Berlin & Colditz, 1998; Blair & Morrow, 1998; Corbin, Lindsey & Welk, 2000). It is also undeniable that healthy nutrition habits are important for good health (Twisk, Van Mechelen, Kemper & Post, 1997; U.S. Department of Health and Human Services, 1999).

Nutrition habits have been studied in relation to exercise habits (Pitsavos et al., 2005; Rimal, 2002; Schnohr et al., 2004), establishing that physically active people have healthier nutrition habits than those who are less physically active. However, nutrition habits have not previously been investigated in terms of their relation to leisure constraints. The authors of the present study asked whether constraints experienced on healthful leisure activities might have a negative association with healthy nutrition habits, in a context of a healthy modus vivendi.

Leisure constraints, smoking, and alcohol use
Smoking has also been studied in relation to participation in leisure activities (Schnohr et al., 2000; Theodorakis & Hassandra, 2005). Study results suggest in common that physically active people are less likely to smoke than inactive people, and there are similar findings concerning alcohol use (Krick & Sobal, 1990; Schnohr et al. 2000), in that physically inactive people were found to be relatively likelier to drink heavily. The present study’s direct exploration of a relationship between leisure constraints and smoking and drinking should pinpoint these habits’ roles in decisions about participating (the negotiation process) in activities.

METHOD
Participants and procedure
The present research was conducted among university students in Greece. Self-report questionnaires were distributed at student clubs and in teaching classrooms, between December 2005 and February 2006. Of 380 questionnaires distributed, 320 were returned (a response rate of 84%).

Instrument
Alexandris and Caroll’s scale (1997), which was developed and standardized for the general adult population in Greece, was used to measure experienced (or perceived) constraints. The scale comprises 39 statements, classified in seven dimensions, or constraint categories, about students’ current participation in leisure activities. The seven-point Likert-type scale offers responses ranging from “very important” (1) to “not important” (7). Questions about demographic details followed.

RESULTS
Of the surveyed students, 57.2% were women and 42.8% were men. The mean age was 21.60 years (S.D. = 2.11). As to residence, 33.8% had grown up in one of the two biggest urban centers in Greece, Athens and Thessaloniki, while 18.8% came from cities of no more than 200,000 inhabitants; 18.4% came from cities of no more than 50,000 inhabitants; 17.5% from cities of 25,000 or fewer inhabitants; and 11.6% from cities of 15,000 or fewer inhabitants. Students were asked for information about their nutrition, alcohol consumption, smoking, and drug use. The results are shown in table 1.

Table 1
Health habits

Nutrition Alcohol Smoking Drugs
Always consume healthy food 10.3% Never drink 17.8% Non-smoker 71.9% Never used 90%
Mostly healthy food 34.7% 1 time per month 21.9% 1-3 per day 5.6% <1 time per month 6.6%
Sometimes healthy food 41.6% 1 time per week 42.2% 4-10 per day 6.9% 1-3 times per month 1.3%
Do not consume healthy food 13.4% >1 per week 18.1% 11-20 per day 9.7% 1 time per week 2.1%
>20 per day 5.9%

Students were also asked about their behavior concerning physical activity. More precisely, they were asked how often weekly they visited private gyms, whether they considered themselves to be athletes, how often they participated in university sport programs, and how often they practiced individually. All these questions were referred to weekly participation.

Table 2

Participation in physical activities (hourly totals per week)

Not at all 1-2 hours 3-4 hours 5-6 hours >7 hours Total
Private gyms 76.3% 8.4% 6.6% 4.1% 4.6% 100%
Sport clubs 83.4% 4.1% 4.4% 2.8% 5.3% 100%
University 81.9% 5.3% 5.9% 3.1% 3.8% 100%
Individual 41.9% 37.2% 15.9% 2.5% 2.5% 100%

Descriptive statistics derived from the leisure constraints scale are contained in Table 3, which also presents the results (alpha scores) of reliability testing of each dimension’s measure.
Table 3
Descriptive statistics from scale, including reliability

Dimensions

M

SD

Alpha

Lack of access

3.59

1.76

.77

Lack of facilities

3.92

1.49

.81

Lack of company

4.37

1.50

.78

Lack of time

4.54

1.09

.60

Lack of knowledge

5.00

1.71

.84

Lack of interest

5.33

1.40

.85

Psychological dimension

5.72

1.13

.89

The dimension “lack of access” is perceived as the most important constraint, followed by “lack of facilities” and “lack of company.” The reliability of the dimensions ranges from .60 to .89.

Anova
Students’ residence prior to age 18
The ANOVA revealed statistically significant differences (F4,313=2.52, p<.05) in the dimension “lack of company” based on place of residence before age 18; the post hoc Scheffe test showed that students who had lived in cities of 15,000 citizens (M=3.90) found lack of company to be a more important constraint than did students from the biggest cities (M2 = 4.60).
Nutrition habits

The ANOVA revealed statistically significant differences related to students’ nutrition habits in four out of seven constraint dimensions. The dimensions in which there were significant differences were: (a) lack of time (F3,316 = 4.58, p<.05); (b) psychological dimension (F3,316=6.33, p<.05); (c) lack of company (F3,314=4.69, p<.05); and (d) lack of interest (F3,314=5.44, p<.05). The post hoc Scheffe test revealed that (a) for students who did not pay attention to nutrition and did not consume healthy food (M=4.29), time was a more important constraint than for students who paid much attention to nutrition and consumed healthy food (M=5.08); (b) for students who did not pay attention to nutrition and did not consume healthy food (M1=5.21), the psychological dimension was a more important constraint than for students who paid attention to nutrition and consumed healthy food (M2=6.29); (c) for students who did not pay attention to nutrition and did not consume healthy food (M1=3.74), “lack of company” was a more important constraint than for students who paid attention to nutrition and consumed healthy food (M2=4.76); and (d) for students who did not pay attention to nutrition and did not consume healthy food (M1=4.79), “lack of interest” was a more important constraint than for students who paid attention to nutrition and consumed healthy food (M2=5.71). No statistically significant differences were seen according to gender or to weekly sport participation.

DISCUSSION

Students’ profile
The majority of the students in the sample were undergraduate men beginning the third decade of life. Most were born and had grown up in cities of more than 200,000 inhabitants; they were largely non-smokers and mainly social drinkers. They tended to give little or no attention to nutrition habits. As far as participation in physical activities, the majority did not participate in university leisure or sports programs, nor were they active athletes at sport clubs. However, almost one-third of them did regularly visit private gyms, and most spent from one to seven or more hours per week in individually organized physical activities. These results seem to be in accord with similar studies (Pitsavos et al., 2005; Rimal, 2002; Schnohr et al., 2004), in that physically active people have previously been found to have more healthy nutrition habits than physically inactive people.

Leisure constraints
In the present study, “lack of access” was the dimension deemed their most important constraint by the students. Perceived “lack of facilities” was the second most important constraint, and “lack of company” was the third. This finding accords with findings of previous studies, throughout which these three dimensions usually constitute the most important factors preventing people from participating in leisure activities (Alexandris & Carroll, 1997; Alexandris & Carroll, 1999).

A possible explanation for the importance of “lack of access” is that students lack opportunity to participate in physical activities close to home, since most live in the center of a city. Transportation often demands time, with traffic jams a daily problem in, for example, Thessaloniki. In addition, students, especially those living in Thessaloniki on a temporary basis, to study, typically do not own cars. By its unpunctuality, furthermore, public transportation apparently discourages students from using it.

The finding concerning lack of facilities may reflect the low quality of some sport and leisure facilities, including overcrowding. Studies conducted in Greek environments have showed that leisure services, especially in public and municipal facilities, are not satisfying, mainly due to insufficient promotion of sport and leisure activities for all (Alexandris & Carroll, 1999). As Alexandris (1998) noted, insufficient sport facilities and limited opportunities in leisure programs are often responsible for low participation.

Facilities-related problems also give an idea of how students feel about university facilities and programs. One statement from the instrument, “I do not like activities that are offered in organized programs,” was indicated by the students to be a significant constraint; they report preferring individual activities in high-quality facilities, according to the descriptive statistics.

Finally, “lack of company,” the third most important dimension of constraint in this study, may be explained by the generic phenomenon of isolation, which seems stronger in big cities. However, the finding may also reflect the fact that, after all, young people prefer other kinds of activities in their free time, despite declaring that they would participate in physical activities if accompanied by a companion. As Aittasalo, Miilunpalo, and Suni (2003) pointed out, in technologically developed countries, a sedentary lifestyle is adopted by more and more people.

The dimension “lack of time,” which is characterized as the most common and strongest constraint by Jackson (2005), in this study ranks only fourth in the hierarchy of intensity. In other words, one might argue that students do not experience time as a strong constraint on their leisure activities. A reason may be that students’ daytime programs comprise studying and attending lectures only some of which are compulsory. Therefore, students have more free time than those adults who are already in the labor market.

Regarding residence before age 18, students from towns of no more than 15,000 inhabitants experienced the constraint “lack of company” more intensely than did students who came from the two biggest cities in Greece. In other words, it was more common among students born and raised in small communities to feel a lack of friends or partners for leisure activity companionship. This is straightforward. People from small communities have more opportunity to develop friendly relations and interactions with people than do city dwellers. When they move to a bigger city (as many students in the sample had, in order to attend college), such people experience “lack of company” comparatively intensely.

Regarding students’ nutrition habits, the statistically significant differences that were observed distinguished “students who paid much attention to their nutrition by always consuming healthy food” from “students who did not pay any attention at all to their nutrition habits.” More precisely, students who paid attention to nutrition experienced leisure constraints at a lower level than students unconcerned with the food they consumed. It seems, then, that students who take care of themselves in terms of diet do the same in terms of physical activity, their approach counterbalancing any constraints experienced. As Twisk et al. (1997) pointed out, physical activity and diet are two important components of contemporary life. Healthy food and regular participation in leisure activities, or physical activities of soft form, seem to play an important part in good health. While nutrition habits have previously been studied in relation to participation in physical activities (Pitsavos et al., 2005; Schnohr et al., 2004; Rimal, 2002), the results of the present study represent a more sensitive approach and lead to the conclusion that people with healthy nutrition habits feel less constrained in their leisure physical activities than do people unmindful of their nutrition habits.

The portion of this study examining smoking and drinking in a context of leisure constraints showed no statistically significant differences between smokers/drinkers and non-smokers/non-drinkers. However, it has been found that smoking and drinking can affect leisure participation (Krick & Sobal, 1990; Schnohr et al., 2000; Theodorakis & Hassandra, 2005). The “bad” habits of smoking and alcohol use do not seem strong enough to affect constraints; they affect actual participation, but not the beginning of decision making, where negotiation plays a part.

The novelty of the current study lies in the fact that it directly links leisure constraints to nutrition habits. So far, nutrition habits have been examined for their relevance to actual participation. One could argue that this finding highlights even more clearly the important role that healthy nutrition habits can play in a balanced, high-quality life.

The fact that most of the students did not participate in university leisure and sport programs should, first of all, put university leisure and sport program providers on alert. Students experienced problems with facilities; overcrowding might mean facilities were inadequate to cover students’ needs, or perhaps that there were some very popular activities. University leisure providers should pinpoint student needs and preferences, then redesign their programs as necessary. This could be achieved with such marketing tools as SWOT analysis, which focuses on gathering data about potential participants and describing their needs.

Of course, students’ characteristic preference for individually organized activities might be another indication of the social alienation that people experience and/or prefer in big cities. This is an important issue, though one beyond the authors’ scope. Access to sport facilities seems to be another constraint for students. It is in part an issue of urban planning concerning local authorities and public transportation officials; but as far as universities are concerned, student buses could be provided to transport students from a department or other central point on campus, to exercise facilities or sites for outdoor recreation.

In conclusion, providing leisure and sport education and fostering positive attitudes towards lifelong fitness could prevent the experience of leisure constraints. Such education should not be approached, however, as an effort to be made only by individual leisure and sport providers. It should be developed as a strategic marketing plan involving the private and the public sector, since it is undeniable that participating in leisure and sport activities promotes health.

Lead author: Amalia Drakou
1, Alexandrou Svolou Street
546 22 Thessaloniki
Greece
Email: adrakou@phed.auth.gr


REFERENCES
Aittasalo, M., Miilunpalo, S., & Suni, J. (2003). The effectiveness of physical activity counselling in a work-site setting. A randomized controlled trial. Patient Education Counselling, 55, 193–202.

Alexandris, K. (1998). Patterns of recreational sport participation among the adult population in Greece. Cyber Journal of Sport Marketing, 2(2), 1–9.

Alexandris K., & Caroll, B. (1997). An analysis of leisure constraints based on different recreational sport participation levels: Results from a study in Greece. Leisure Sciences, 19, 1–15.

Alexandris, K., Tsorbatzoudis, C., & Grouios, G. (2002). Perceived constraints on recreational sport participation: Investigating their relationship with intrinsic motivation, extrinsic motivation and amotivation. Journal of Leisure Research, 34(3), 233–252.

Backman, S. (1991). An investigation of the relationship between activity loyalty and perceived constraints. Journal of Leisure Research, 23, 332–344.

Berlin, J. A., & Colditz, G. A. (1990). A meta-analysis of physical activity in the prevention of coronary heart disease. American Journal of Epidemiology, 132, 612–628.

Blair, S. N., & Morrow, J. R. (1998). Introduction: Cooper Institute /American College of Sport Medicine 1997 Physical Activity Intervention Conference. American Journal of Preventative Medicine, 15, 255–256.

Corbin, C. B., Lindsey, R., & Welk, G. (2000). Concepts of fitness and wellness (3rd ed.). Boston: McGraw-Hill.

Crawford, D. W., & Godbey, G. (1987). Reconceptualizing barriers to family leisure. Leisure Sciences, 9, 119–127.

Crawford, D. W., Jackson, E. L., & Godbey, G. (1991). A hierarchical model of leisure constraints. Leisure Sciences, 13, 309–320.

Davison, K. K., & Lawson, C. T. (2006). Do attributes in the physical environment influence children’s physical activity? A review of the literature. International Journal of Behavioral Nutrition and Physical Activity, (Vol), 3–19.

Elmendorf, W. E., & Willits, E. K. (2005). Urban park and forest participation and landscape preference: A review of the relevant literature. Journal of Arboriculture, 31(6), 311–317.

Ferris, A. L. (1962). National Recreation Survey, Outdoor Recreation Resources Review Commission (Study Report no. 19). Washington, D.C.: U.S. Government Printing Office.

Harahoussou, Y. (1996). Sociocultural influences on Greek women’s involvement in physical recreation. International Review for Sociology of Sport, 31, 219–227.

Harrington, M., & Dawson, D. (1995). Who has it best? Women’s labor force participation, perceptions of leisure and constraints to enjoyment of leisure. Journal of Leisure Research, 27(1), 4–24.

Hawkins, B. A., & Freeman, B. (1993). Factor analysis of leisure constraints for ageing adults with mental retardation. Paper presented at the NRPA Symposium on Leisure Research, San Jose, CA.

Henderson, K., Stalnaker, D., & Taylor, G. (1988). The relationship between barriers to recreation and gender-role personality traits for women. Journal of Leisure Research, 20, 69–80.

Horna, J. L. (1989). The leisure component of the parental role. Journal of Leisure Research, 10(3), 203–215.

Hultsman, W. (1995). Recognizing patterns of leisure constraints: An extension of the exploration of dimensionality. Journal of Leisure Research, 27, 228–244.

Jackson, E. L. (2000). Will research on leisure constraints still be relevant in the twenty-first century? Journal of Leisure Research, 32, 62–68.

Jackson, E. L. (2005). Leisure constraint research: Overview of a developing theme in leisure studies. In Jackson, E. (Ed.), Constraints to Leisure (pp. ??–??). State College, PA: Venture Publishing.

Jackson, E. L. (1991). Leisure constraints/constrained leisure [Special issue]. Journal of Leisure Research, 23, 279–285.

Jackson, E. L., & Scott, D. (1997). Constraints to leisure. In. E. L. Jackson and T. L. Burton (Eds.), Leisure Studies: Prospects for the twenty-first century (pp.299–321). State College, PA: Venture Publishing.

Jackson, E. L., & Henderson, K. (1995). Gender-based analysis of leisure constraints. Leisure Sciences, 17, 31–51.

Johnson, C. Y., Bowker, J. M., & Cordell, K. (2001). Outdoor recreation constraints: An examination of race, gender and rural dwelling. Southern Rural Sociology, 17, 111–133.

Kay, T., & Jackson, G. (1991). Leisure despite constraint: The impact of leisure constraints on leisure participation. Journal of Leisure Research, 23, 301–313.

Klepeis, N. E., Tsang, A., & Behar, J. (1996). Analysis of the National Human Activity Pattern Survey (NHAPS): A resource for assessing exposure to environmental pollutants. Las Vegas, NV: U. S. Environmental Protection Agency.

Krick, J. P., & Sobal, J. (1996). Relationships between health protective behaviors. Journal of Community Health, 15(1), 19–34.

Norman, W. (1995). Perceived constraints: A new approach to segmenting the vacation travel markets. Paper presented at the NRPA Symposium on Leisure Research, San Antonio, TX.

Norman, W. (1996). A perspective on recreational use of South Carolina rivers. South Carolina River News. 2(3), 1–2.

Pitsiavos, C., Panagiotakos, D. B., Lentzas, Y., & Stefanidis, C. (2005). Epidemiology of leisure time physical activity in socio-demographic, lifestyle and psychological characteristics of men and women in Greece: The ATTICA study. BMC Public Health, 5(37).

Rimal, A. (2002). Association of nutrition concerns and socioeconomic status with exercise habits. International Journal of Consumer Studies, 26(4), 322–327.

Rocklynn, C. H. (1998). Adolescent girls and outdoor recreation: A case study examining constraints and effective programming. Journal of Leisure Research, 30(3), 356–379.

Schnohr, C., Hojbejerre, L., Riegels, M., Leder, L., Prescott, E., & Gronbaek, M. (2004). Does educational level influence the effects of smoking, alcohol, physical activity and obesity on mortality? A prospective population study. Scandinavian Journal of Public Health, 32, 250–256.

Scott , D. (1991). The problematic nature of participation in contract bridge: A qualitative study of group related constraints. Leisure Sciences, 13, 321–336.

Stodolska, M. (1998). Assimilation and leisure constraints: Dynamics of constraints on leisure in immigrant populations. Journal of Leisure Research, 3, 521–551.

Strauss, R. C. (2000). Childhood obesity and self esteem. Journal of Pediatrics, 105, 1–15.

Theodorakis, Y., & Hassandra, M. (2005). Smoking and exercise. Differences between exercisers and non-exercisers [Part II]. Inquiries in Sport and Physical Education, 3, 239–248

Twisk, J., Van Mechelen, W., Kemper, H., & Post, G. (1997). The relation between “long-term exposure” to lifestyle during youth and young adulthood and risk factors for cardiovascular disease at adult age. Journal of Adolescent Health, 20, 309–319.

U.S. Department of Health and Human Services. (2000). Healthy people 2010: Understanding and improving health (2nd ed.). Washington, D.C.: U.S. Government Printing Office.

U.S. Department of Health and Human Services. (1999). Public Health Service, Center for Disease Control and Prevention, National Center for Chronic Disease. Prevention and Health Promotion, Division of Nutrition and Physical Activity.

Virden, R. J., & Walker, G. J. (1999). Ethnic/racial and gender variation among meanings given to, and preferences for, the natural environment. Leisure Studies, 21, 219–239.

Witt, P. A., & Goodale, T. L. (1981). The relationship between barriers to leisure enjoyment and family stages. Leisure Sciences, 4, 29–49.

2013-11-27T19:26:11-06:00January 7th, 2008|Contemporary Sports Issues, Sports Exercise Science, Sports Studies and Sports Psychology|Comments Off on Leisure constraints experienced by university students in Greece

The Prevalence and Focus of Workplace Fitness Programs in Denmark: Results of a National Survey

Abstract

Purpose: This study describes the prevalence of physical activity
programs at Danish workplaces with one-hundred or more employees

Design: Cross-sectional

Setting: Denmark

Subjects: All private and public workplaces of the designated
size (n=2422).

Measures: A two-phase research model was used. Phase 1 consisted
of telephone interviews involving all workplaces. Phase 2 was conducted
using a structured, self-administered questionnaire which elicited more
detailed descriptions of workplaces identified as promoting physical activity
(n=449). Response rates were 92% and 69% in Phases 1 and 2 respectively.

Data Analysis: Data were analyzed using StatView statistical
software.

Results: 18.6% of all workplaces (n=2422) offer employees opportunities
for physical activity on a regular basis. Analysis of the data from workplaces
included in Phase 2 (n=449) showed the following: The most frequently
cited motive for providing opportunities for physical activity is to promote
social contact between employees.
63% of the workplaces have instructors for the activities on offer, while
39% mention that some form of assessment is linked to the offer of physical
activity. 50% of the programs have been implemented within the last ten
years.

Conclusions: The results indicate that the concept of physical
activity as part of everyday working life has acquired real momentum in
Denmark in recent decades, but nevertheless is still at an early stage.

Physical activity at the workplace—a historical outline

Physical activity at the workplace is not a recent phenomenon in Denmark.
Traditional company sports began more than half a century ago and were
organized in a national association. The primary aim of this association
over the years has been to organize competitions and tournaments among
various firms and companies. However, only recently has physical activity
received much attention as a catalyst for health and well being among
employees, or as a building block in corporate culture.

Thus, marked promotion of physical activity at the workplace first emerged
in 1987 when the Danish government presented the Government Preventive
Program, influenced by WHO’s strategy Health for All—Year
2000 (Ministry of Health, 1989). In the subsequent action plans, it is
the relationship between physical activity and the prevention of specific
illnesses that has been the constant theme—although the 1990s saw
a change of emphasis, with concepts like well being and social determinants
of health coming to the fore. This latter trend is reflected partly in
a variety of educational initiatives dealing with the promotion of physical
activity and fitness, and partly in official governmental guidelines for
the implementation of physical activity at workplaces from 1997 onwards
(National Board of Health, 1997). The overall development has been borne
out through the publication and promotion of the ambitious 2002 government
strategy entitled Healthy throughout life – a follow-up on The Danish
Government Programme on Public Health and Health Promotion 1999-2008 published
in 1999 (Ministry of Health, 1999. Government of Denmark, 2002).

In continuation of these political and health policy trends, this article
presents one of few comprehensive overviews of physical activity programs
at Danish workplaces. The results obtained and experiences gained from
this survey should be used to promote the continued implementation of
workplace fitness programs in particular and of workplace health promotion
in general. Furthermore, this article seeks to make a contribution to
the collection of fundamental knowledge and facts which is needed in order
to make possible international comparative research into minor or major
aspects of health promotion.

Methods

Design

The results presented in this paper are from an exploratory survey which
was conducted with the aim of systematically collecting background data
on a subject of which relatively little is currently known, namely health
promotion and physical activity at the workplace in Denmark. It was decided
to collate a limited amount of information from a large number of survey
returns concerning key variables related to both structural and human
resources.

The aims of the national survey were thus:

  • To determine the number of Danish workplaces offering physical activity
    to employees on a regular basis
  • To identify trends underlying the programs offered
  • To determine who is responsible for these programs
  • To describe how and where programs are made available
  • To document who meets the costs of establishing and running programs.

Sample

The sample included all private and public workplaces in Denmark with
one-hundred or more employees. Statistics Denmark provided information
as regards the name, addresses, and telephone numbers of each workplace,
the type of workplace, and the number of employees. The data were arranged
geographically, listed by municipality. Statistics Denmark updates information
on roughly ½ million Danish workplaces every sixth month, and supplies
information requested within ten days. The basic data can be regarded
as extremely reliable, because of the close co-operation between Statistics
Denmark and the Danish taxation authorities.

The grounds for selecting one-hundred employees as the lower limit were:

  1. The lower limit was chosen in the light of the time and resources
    available for the study. 2,422 Danish workplaces were registered as
    having one-hundred or more employees. This was considered to be a practicable
    number of workplaces to investigate, given the above mentioned conditions.
  2. Experiences gained from a pilot project carried out some years ago,
    concerning the extent of opportunities for physical activity at workplaces
    in a selected region of Denmark, indicated one-hundred employees as
    a suitable threshold value. The pilot study investigated all workplaces
    with at least twenty employees. It was found that only one of the workplaces
    offering physical activity on a formal, planned and regular basis had
    less than one-hundred employees (Berggren & Skovgaard, 1995). This
    finding is somewhat different from results presented in other research
    studies where physical activity, defined in much the same way as mentioned
    above, is frequently cited as a current health promotion initiative
    at workplaces employing less than one-hundred people (Wilson et al.,
    1999).

Measures

Collection of data was divided into two phases:

Phase 1: Selection via telephone contact
The 2,422 workplaces were contacted over the telephone. The use of a protocol
assisted interview system made it possible to discriminate between a group
of workplaces that were to take part in the later survey and a group that
did not live up to a criterion concerning workplace promotion of physical
activity.

Workplace promotion of physical activity was defined for the respondents
as: activities which lay outside the auspices of the three national Danish
sports associations and offered employees at least thirty minutes of physical
activity once a week or more frequently.

Furthermore, it was a requirement that respondents could answer ‘yes’
to one or both of the following sub-criteria:

  1. The ongoing initiatives regarding physical activity takes place solely
    or partial at the workplace;
  2. Workplace management bears some of the running expenses in connection
    with the activities.

The protocol assisted interview system included a standardized interview
guide. This gave a detailed definition of the term workplace promotion
of physical activity. There was a set of instructions related to the interview
guide which stipulated a specific order in which questions were to be
asked. This meant that the sub-criteria were mentioned last. The interview
protocol required that if the initial contact person (typically someone
in the secretariat) was unable to provide the information requested, this
person should be asked to transfer the request to another contact person
(usually someone in the personnel or administrative department).

The telephone interviews were conducted by qualified personnel with experience
in working on questionnaire-based projects. Before the work started there
were two preparatory meetings in which the interview protocol was reviewed,
commented upon, and revised.

Of the initial 2,422 workplaces listed, it proved impossible to get in
touch with 163. A further twenty workplaces either could not or refused
to participate in the survey. There was thus no information available
for a total of 183 workplaces. Ninety-two percent of the companies in
the sample were reached in Phase I, and this was judged to be acceptable.

Phase 2: Detailed questionnaire survey
This part of the survey covered all workplaces that fulfilled the requirements
set out in the definition of workplace promotion of physical activity.

All workplaces that fulfilled these conditions agreed to take part in
the subsequent survey, based on a structured, self administered questionnaire,
which was to be answered in writing and returned in an enclosed addressed
reply envelope. The questionnaire had a total of thirty-two questions
with multiple choice response categories, frequently with the possibility
of adding further comments in marked sections.

The questionnaire form was sent to a named contact person at the workplace
who was selected as being a knowledgeable and appropriate informant in
this context.

Of the 449 workplaces that received the questionnaire (corresponding
to 18.6% of all Danish workplaces with at least one-hundred employees),
310 (69%) responded. An analysis of the non-respondents showed no systematic
and consistent pattern when respondent and non-respondent groups were
compared with respect to:

  • Number of employees
  • Whether the workplace was in the private or public sector
  • Type of workplace
  • Geographical location (postal code)

Analysis

This article is mostly based on the information collected by means of
the questionnaire survey. The internal missing response rate, i.e. the
proportion of a given questions to which no response was made on the survey
forms returned, never exceeded 3% and followed no systematic pattern.
The internal missing responses are therefore considered to have only minor
effect on the reliability of the survey results.
The data from the forms were entered into a database by a firm specializing
in this type of work.
The data entered were then checked for errors against the original questionnaire
forms.
Descriptive data analysis was carried out using the StatView statistical
software package.

Results

General data—the size of workplaces
18.6% of all Danish workplaces with at least one-hundred employees offer
regular physical activity as previously defined. A comparison with the
results from the pilot study cited above suggests that a large increase
in the number of Danish workplaces offering physical activity has taken
place over a short period of time. The national survey also shows that
roughly half of the workplaces have begun to offer opportunities for physical
activity within the last decade. It is also noteworthy that in only one
in five states were making such an offer before 1980.

As shown in table I (part A), nearly half (48%) of the Danish workplaces
offering regular physical activity have 100-199 employees, while about
a third of the workplaces (32%) lie within the 200 499 range. The somewhat
smaller figure for larger workplaces (those with five-hundred or more
employees) that offer opportunities for physical activity corresponds
quite closely to the overall number of such larger workplaces existing
in Denmark. Indeed, Table I suggests that as a rule, the proportion of
Danish workplaces, which fall within a given size group, tends to tally
with the share of workplaces offering physical activity within the same
size group.

From the outset, it was assumed that physical activity programs at the
workplace would be more prevalent among smaller and medium sized workplaces.
This expectation was based on the conjecture that it would perhaps be
easier to agree on perspectives and aims of physical activity at smaller
and medium-sized workplaces. The findings described above do not support
such an assumption.

Who initiates physical activity at the workplace, and why?
At almost half the workplaces investigated (44%) it was the employees
who had taken the initiative. If one includes joint initiatives between
employees and employer, the involvement of employees grows to 79%. The
initiative came from management alone in only 19% of workplaces.

Table I suggests that within the last decade a shift has taken place
in the primary reasons given for introducing physical activity at Danish
workplaces. Surveys conducted at selected workplaces in the early and
mid 1990s pointed to a clear emphasis on such aims as ‘to reduce
absence due to illness’ and ‘to increase efficiency’
(Andersen, Berggren, & Lüders, 1996). The national survey, on
the other hand, shows that the three most frequently cited aims are:

  • To promote social contact between employees
  • To accommodate employee requirements
  • To contribute to the overall work environment

Activities offered

The national survey shows that the three most frequently offered activities
at Danish workplaces are weight training, cardiovascular exercise using
fitness equipment (e.g. steppers, treadmills, ellipticals, and rowers),
and various kinds of aerobics.

Table II shows that while almost 80% of all workplaces state that weight
training is offered, this figure falls to 70% if the requirement is for
both weight training and cardiovascular exercise using fitness equipment
to be offered. The fall becomes even more dramatic if activities such
as aerobic dance and general gymnastics are included as well.

It is noteworthy that just over 10% of all workplaces have such wide
ranges of activities on offer that they include all the four types of
activity mentioned above.

Establishing and running activities

Financially, the provision of physical activity at the workplace involves
both employers and employees. Table II shows that meeting the costs incurred
in establishing the facilities for physical activity involves the employer
to a considerable extent. In 35% of cases this is done in cooperation
with the employees. In roughly one out of ten cases the economic burden
of establishing the activities is the sole concern of the employees.

The employer is also involved in the running costs, as just over 30%
of companies state that the employer covers the annual running costs,
while another 40% report that the users and the employer share these costs.

In 20% of cases it is the employees alone who cover the running costs,
while in a small proportion of workplaces (6%) the running costs are financed
in some other way, for example through grants from unions or foundations.

Access to facilities for physical activity

Workplaces were asked to what extent they offer physical activity within
and outside working hours. It is a motivating factor for the employees
that the workplace offers such facilities during working hours. Furthermore,
the use of working hours for physical activity implies that the workplace
takes the task of activating employees seriously.

Sixty-two percent of the workplaces investigated stated that physical
activity is only offered outside working hours. Thus, at most of the investigated
workplaces the willingness to invest in employees’ physical activity
by reducing the hours spent working is not present. It is, however, notable
that 32% of workplaces state that such activity is available both within
and outside working hours.

In almost 90% of workplaces the offer is predominantly taken up immediately
after work. To some extent, this might be because it can be awkward to
return to the workplace once one has started on domestic or other commitments.

Who provides instruction?

The survey shows that 63% of workplaces provide instructors in connection
with some of the activities on offer. It transpires, however, that in
only 32% of cases are all activities conducted under some form of guidance.
The activity that most typically lacks such guidance is the use of weight
training equipment.

Only two out of five instructors state that they have some form of relevant
formal training for the job. Furthermore, the survey reveals that the
majority of those who have had such training acquired their knowledge
through weekend or other short courses.

Family

Just over 40% of the workplaces state that members of employees’
families also have access to the activities. A slightly higher proportion
(43%) does not admit other members of the family or partners. The difference
in the size of these two groups is, however, so small that it cannot be
said that there is any clear tendency for workplaces to either give or
deny family members access to physical activity facilities.

Evaluation

Thirty-nine percent of the workplaces state that some form of evaluation
is linked to the offer of physical activity, but it is only very few (11%)
of these that can be said to conduct a systematic, regular assessment
of their activities. This is not, however, a distinctively Danish phenomenon,
but rather an indication of a general trend whereby the majority of health
promotion programs are not subject to evaluation. Useful evaluation demands
adequate resources: the availability of time, money, and regular staff
or consultants skilled in carrying out evaluation activities. Company
budgets rarely allow room for such ideal provisions (Chapman, 1999).

Discussion

Summary

This study constitutes one of the first Scandinavian attempts at a national
survey of workplace promotion of physical activity. In general, the data
presented in this article should be seen as an attempt to provide the
fundamental information and analysis that is needed for cross-national
comparisons on health promotion topics.

Just under 19% of all Danish workplaces with at least one-hundred employees
make regular provision for physical activity. The results suggest that
the size of the workplace appears to have no independent effect on the
extent to which opportunities for physical activity are provided. Interestingly
enough, four-fifths of the programs currently in operation began during
the last twenty years. It is also worth mentioning that in around 40%
of cases, employees and employers both contribute to establishment and
running costs for the programs. Furthermore, it should be noted that the
majority of workplace exercise programs only offer a limited range of
activity types, and make no provision for systematic evaluation of the
programs through user surveys, measurement of results, etc. This last
finding is to be viewed in light of the fact that the three most frequently
named goals of the provision of opportunities for physical activity are
related to the well-being of employees and general working conditions.

Limitations

This study has a number of limitations.

First, there has been no previous attempt to measure the extent and nature
of the provision of opportunities for physical activity at Danish workplaces.
In 1997, 2002, and 2005 the National Board of Health commissioned inventories
on health promotion activities and strategies at Danish workplaces (National
Board of Health, 2006). The reports coming out of this work also deal
with physical activity. However, the National Board of Health applies
a much broader definition of workplace promotion of physical activity
than the one used in the present study. The various dataset are therefore
non-comparable and dynamic studies of development over time are not possible.

Second, the data collecting process was designed with the analysis of
aggregated data in mind. It is therefore not possible to use the data
to evaluate exactly how the various physical activity programs operate
and why they have been set up as they are, or to determine whether there
are typical decision-making and amendment processes which lead to the
establishment, revision, and abandonment of physical exercise programs.

Third, although the survey instruments used standard items, estimates
of reliability and validity are not available. However, for Phase 1 of
the survey, the protocol assisted interview system was developed by a
working group comprising people who all had previous experience with questionnaire-based
projects. The questionnaire used in Phase 2 was constructed on the basis
of a form used in the mentioned pilot study concerning a respondent group
very similar to that in the national survey.

Implications

Official action programs promoted by Danish Government at central, regional,
and local levels, and networks such as the WHO project Healthy Cities,
have frequently stressed the need to offer physical activity as part of
general strategies related to workplace health promotion (Ratzan, Filerman,
& LeSar, 2000. Danish Healthy Cities Network, 2004). Recently, focus
on this area has increased due to new legislative initiatives that obligates
municipal authorities to be the driving force in prevention and health
promotion matters. The workplace has been pointed out as an obvious setting
through which to reach the adult population (National Centre for Workplace
Health Promotion, 2005).

Initiatives such as the ones mentioned have included only brief comments
related to the problem of adherence to and compliance with workplace exercise
programs, and to the role of instructors in this perspective. In contrast
to the situation in many other western countries, there are no Danish
guidelines or rules that regulate and promote the trainer/instructor dimension
of the field of fitness and physical activity at the workplace. Partly
for this reason, most Danish workplaces offering physical activity have
still not fully accepted the consequences of the relationship between
the earlier stated reasons for implementing workplace fitness programs
(cf. Table 1, part B) and the central role of the instructor when what
is expected is both improvement in the physical condition of individuals
and a general improvement to the overall work environment. The results
presented indicate that only a small proportion of workplaces ensure that
their instructors have or obtain relevant pedagogical experience and theoretical
knowledge.

This state of affairs can be linked to the survey finding that only about
10% of all workplaces have multi-range fitness programs that include more
than three types of activity (Table II). Greater variation and breadth
in developing and implementing workplace physical activity schemes could
very likely influence the number of participants and the pattern of employee
exercise adherence and compliance. In general, careful planning and making
exercise a more pleasurable part of the work environment appear to have
at least a short-term positive effect on exercise adherence (Blue et al.,
1995. Andreasen & Møller-Jørgensen, 2005). However,
for many longterm adherence to exercise programs is a greater challenge.
As Chen et al. (2005) point out “The biggest challenge of a work-site
fitness program is to sustain long-term interest and enthusiasm”.
This conclusion could be applied to both the individual and organizational
level (Atlantis et al., 2006). Workplaces wanting to support such long
term efforts must be prepared to invest many types of resources (eg. human,
financial, organizational) (Nurminen E, 2002). Another challenge is engaging
the more sedentary part of the workforce. In general participation rates
in workplace health promotion programs are not that impressive and those
who do take part tend to the employees whose general health and health
behavior profile is better than average (Healthy People 2010, online documents
A).

It is important to stress that though this survey shows that only approximately
20% of Danish workplaces with one-hundred or more employees offer exercise
programs, compared to, for example, the situation in the United States,
where the corresponding figure is about 50% (Healthy People 2010, online
documents B), this is not to be taken as a precise indication of the overall
physical activity level in the Danish adolescent and adult population
as a whole. Thirty-seven percent of men and 23% of women in Denmark over
the age of 15 are members of one or more sport associations and 72% of
the total adult population state that they engage in leisure time sport
activities on a regular basis (Fridberg, 2000, Larsen, 2003). Moreover,
while about 80% of the Danish adult population is moderately active at
least four hours a week this is the case for roughly 40% of the same group
in the United States (Kjøller & Rasmussen, 2002. US Department
of Health and Human Services, 1999).

At the same time, it must be noted that about half of the Danish adult
population is not physically active in a degree that complies with the
primary public recommendation of minimum thirty minutes of moderate-intensity
physical activity per day (National Board of Health, 2002: Jørgensen
and Rosenlund, 2005). This dismal figure corresponds quite well with the
WHO estimate that at least 60% of the global population fails to achieve
the recommendation of at least thirty minutes moderate intensity physical
activity daily (WHO, 2003, WHO, 2004).

Lastly, it must be pointed out that the vast majority of Danish workplaces
have hitherto not considered workplace exercise promotion as a task in
which they played any major role. Only with the stronger political signals
of the last ten to twenty years, concerning the workplace as an important
setting for health promotion and disease prevention, has it been possible
to see much movement and shift of perspective regarding the area of workplace
physical activity among the many decision-makers of importance in this
nexus.

Perspectives: Implications for practitioners and researchers within sports-
and health promotion science

The survey data and other information presented in this article indicates
that workplace fitness programs in Denmark have been gaining ground, especially
in the last ten to twenty years. Combined with other research suggesting
that the Danish labor market as a whole is putting more and more energy
into the general field of health promotion, there seems to be support
for the assumption that the amount of work available for health promotion
practitioners is on the increase and that workplaces are interested in
using health activities as a means of promoting their employees’
well being. If this assumption is correct, future effort should ensure
that:

  • the personnel engaged in physical activity and health promotion at
    workplaces should receive better training and education in exercise
    and health related issues. With a view to encourage development of educational
    programs and tailored personnel engaged in workplace health promotion,
    national guidelines should be considered in order to increase the standards
    for the education of health promotion and/or exercise professionals
    in workplace settings. Countries such as the US, Germany, and the UK
    offer suitable models for established standards for exercise professionals.
    A future objective could be to implement a common reference system in
    the EU to promote good practice as regards Workplace promotion of physical
    activity. An effective starting point is the general quality criteria
    for workplace health promotion developed by the European Network for
    Workplace Health Promotion (ENWHP).
  • the many separate initiatives concerning health promotion, including
    physical activity, must be linked to general efforts made by public
    authorities to improve workplace health and safety.


Basic information concerning workplace fitness
programs I
Total sample (n=2,422)*
Part A
Number of employees 100-199 200-499 500-999 1000+ Unknown
Variable
Percentage of all Danish workplaces (100+ employees) 52 33 11 3 1
Percentage of all Danish workplaces (100+ employees) with fitness
programs
48 32 12 5 3
Part B
Most frequently mentioned reasons for implementing physical
activity at the workplace
Variable %
To promote social contact among employees 28
To meet employee requirements 18
To contribute to the work environment 14

* While the total sample size was 2,422 workplaces, the
number responses to questions included in this table ranged from 2,349
in Part A and 2,400 in Part B.


Basic information concerning workplace fitness
programs II
Total sample (n=310)*
Range of activities on offer
Establishing
Programs
Running
Programs
Variable: Variable: Variable:
activities included in workplace fitness programs who covers the preliminary expenses? who covers the annual running
expenses?
n % n % n %
1i 239 78 employees 37 12 employees 62 20
1+2ii 214 70 employer 127 42 employer 102 34
1+2+3iii 86 28 employee/employer 105 35 employee/employer 121 40
1+2+3+4 iv 34 11 others 32 11 others 19 6

* While the total sample size was 310 workplaces, the number
responses to questions included in this table ranged from 301 to 306.

iWeight training
iiWeight- and cardiovascular exercise training
iiiWeight- and cardiovascular exercise training and aerobics
iv Weight- and cardiovascular exercise training, aerobics,
and general gymnastics


References

  1. Andersen, B., Berggren, F. & Lüders, K. (1996) Det Batter – stadig. Odense: Working papers from Institute of Sport Science & Clinical Biomechanics, University of Southern Denmark.
  2. Andreasen, M. & Møller-Jørgensen, N. (2005). En settingstilgang til sundhedsfremme på arbejdspladsen – TDC erhvervscenter i Odense. In K. Lüders & N. Vogensen N (Eds.), Idrætspædagogisk Årbog 2004/5 (pp. 140-167). Gerlev: Forlaget Bavnebanke.
  3. Atlantis, E., Chow CH., Kirkby, A. & Singh MAF. (2006) Worksite intervention effects on physical health: a randomised controlled trial. Health Promotion International, 21 (3), 191-200.
  4. Berggren, F. & Skovgaard, T. (1995). Aktivitetstilbud og motionsfaciliteter på fynske arbejdspladser. Odense: University press of southern Denmark.
  5. Blue, C.L. & Conrad, K.M. (1995) Adherence to worksite exercise programs – an integrative review of recent research. AAOHN J, 43, 76-86.
  6. Chapman, L.S. (1999) Evaluating your program. TAHP, 3, 1-12.
  7. Chen, S., Cromartie, F. & Esposito E. (2005) The Fitness Assessment on the Employees of a Sport Institution — A Case Study of the United States Sports Academy. The Sport Journal, 8, 1.
  8. Danish Healthy Cities Network (2004). Sund by netværktøjskassen – Sundhed og trivsel på arbejdspladsen http://www.sundbynet.dk/PDF/Netv%E6rkt%F8jskassen/Revideret%20Netv%E6rkt%F8jskasse%20nov.04. Accessed January 4, 2006.
  9. Fridberg, T. (2000) Kultur- og fritidsaktiviter 1975-1998. Copenhagen: The Danish National Institute of Social Research.
  10. Government of Denmark (2002). Healthy throughout life http://www.folkesundhed.dk/ref.aspx?id=190. Accessed January 4, 2006).
  11. Healthy People 2010 Online Documents A http://www.healthypeople.gov/document/HTML/Volume1/07Ed.htm#_Toc490550857. Accessed January 7, 2006.
  12. Healthy People 2010 Online Documents B http://www.healthypeople.gov/document/html/tracking/od22.htm#physactadult. Accessed January 4, 2006.
  13. Jørgensen, ME & Rosenlund, M. (2005). National monitoring  fysisk aktivitet – et metodestudie. Copenhagen: The National institute for public health.
  14. Kjøller, M. & Rasmussen, N.K. (2002) Sundhed & Sygelighed i Danmark 2000 & udviklingen siden 1987. Copenhagen: National Institute of Public Health
  15. Larsen, K. (2003). Den tredje bølge – på vej mod en bevægelseskultur. Copenhagen: Lokale- og anlægsfonden
  16. http://www.loa-fonden.dk/cache/article/file/Den_tredje_boelge.pdf. Accessed January 4, 2006.
  17. Ministry of Health (1989). The health promotion programme of the Government of Denmark. Copenhagen.
  18. Ministry of Health (1999). The Danish Government Programme on Public Health and Health Promotion 1999-2008  http://www.folkesundhed.dk/media/detgamlefolkesundhedsprogr.pdf. Accessed January 7, 2006.
  19. National Board of Health (1997). Official Guidelines for the implementation of Physical Activity at Workplaces. Copenhagen.
  20. National Board of Health (2002). Sundhedsstyrelsen: Befolkningens motivation og barrierer for fysisk aktivitet. Copenhagen.
  21. National Board of Health (2006). Sundhedsfremmeordninger på arbejdspladser 2005
  22. http://www.sst.dk/publ/Publ2006/CFF/Sundhedsfremme_05/Sundhedsfremme_05.pdf. Accessed march 7, 2006.
  23. National Centre for Workplace Health Promotion (2005) Borgerrettet forebyggelse og
  24. sundhedsfremme på arbejdspladsen http://www.ncsa.dk/fileadmin/template/ncsa/pdf_filer/Kommunalforebyggelse.pdf. Accessed January 10, 2006.
  25. Nurminen, E., Malmivaara, A., Ilmarinen, J., Ylstalo, P., Mutanen, P., Ahonen, G. & Aro, T. (2002) Effectiveness of a worksite exercise program with respect to perceived work ability and sick leaves among women with physical work. Scand J Work Environ Health, 28 (2), 85-93.
  26. Ratzan, S.C., Filerman, G.L. & LeSar, J.W. (2000). Attaining Global Health: Challenges and Opportunities. Population Bulletin, 55[1].
  27. US Department of Health and Human Services (1999). Promoting Physical Activity. Champaign: Human Kinetics Publishers.
  28. WHO (2003) Diet, Nutrition and the Prevention of Chronic Diseases. Geneva.
  29. WHO (2004) Global strategy on Diet, Physical Activity and Health http://www.who.int/dietphysicalactivity/en/. Accessed January 4, 2006.
  30. Wilson, M.G., Dejoy, D.M., Jorgensen, C.M. & Crump, C.J. (1999) Health Promotion Programs in Small Worksites: Results of a National Survey.  American Journal of Health Promotion, 13, 358-65.
2019-10-28T14:01:25-05:00September 7th, 2006|Sports Exercise Science, Sports Management, Sports Studies and Sports Psychology|Comments Off on The Prevalence and Focus of Workplace Fitness Programs in Denmark: Results of a National Survey
Go to Top